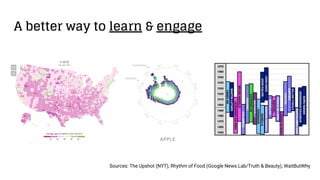
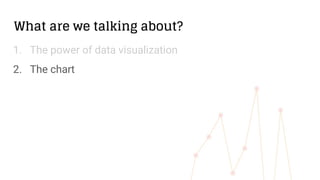
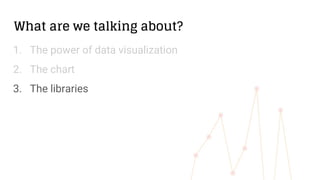
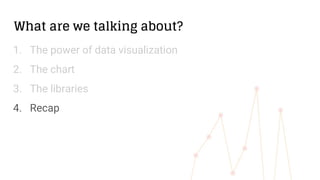
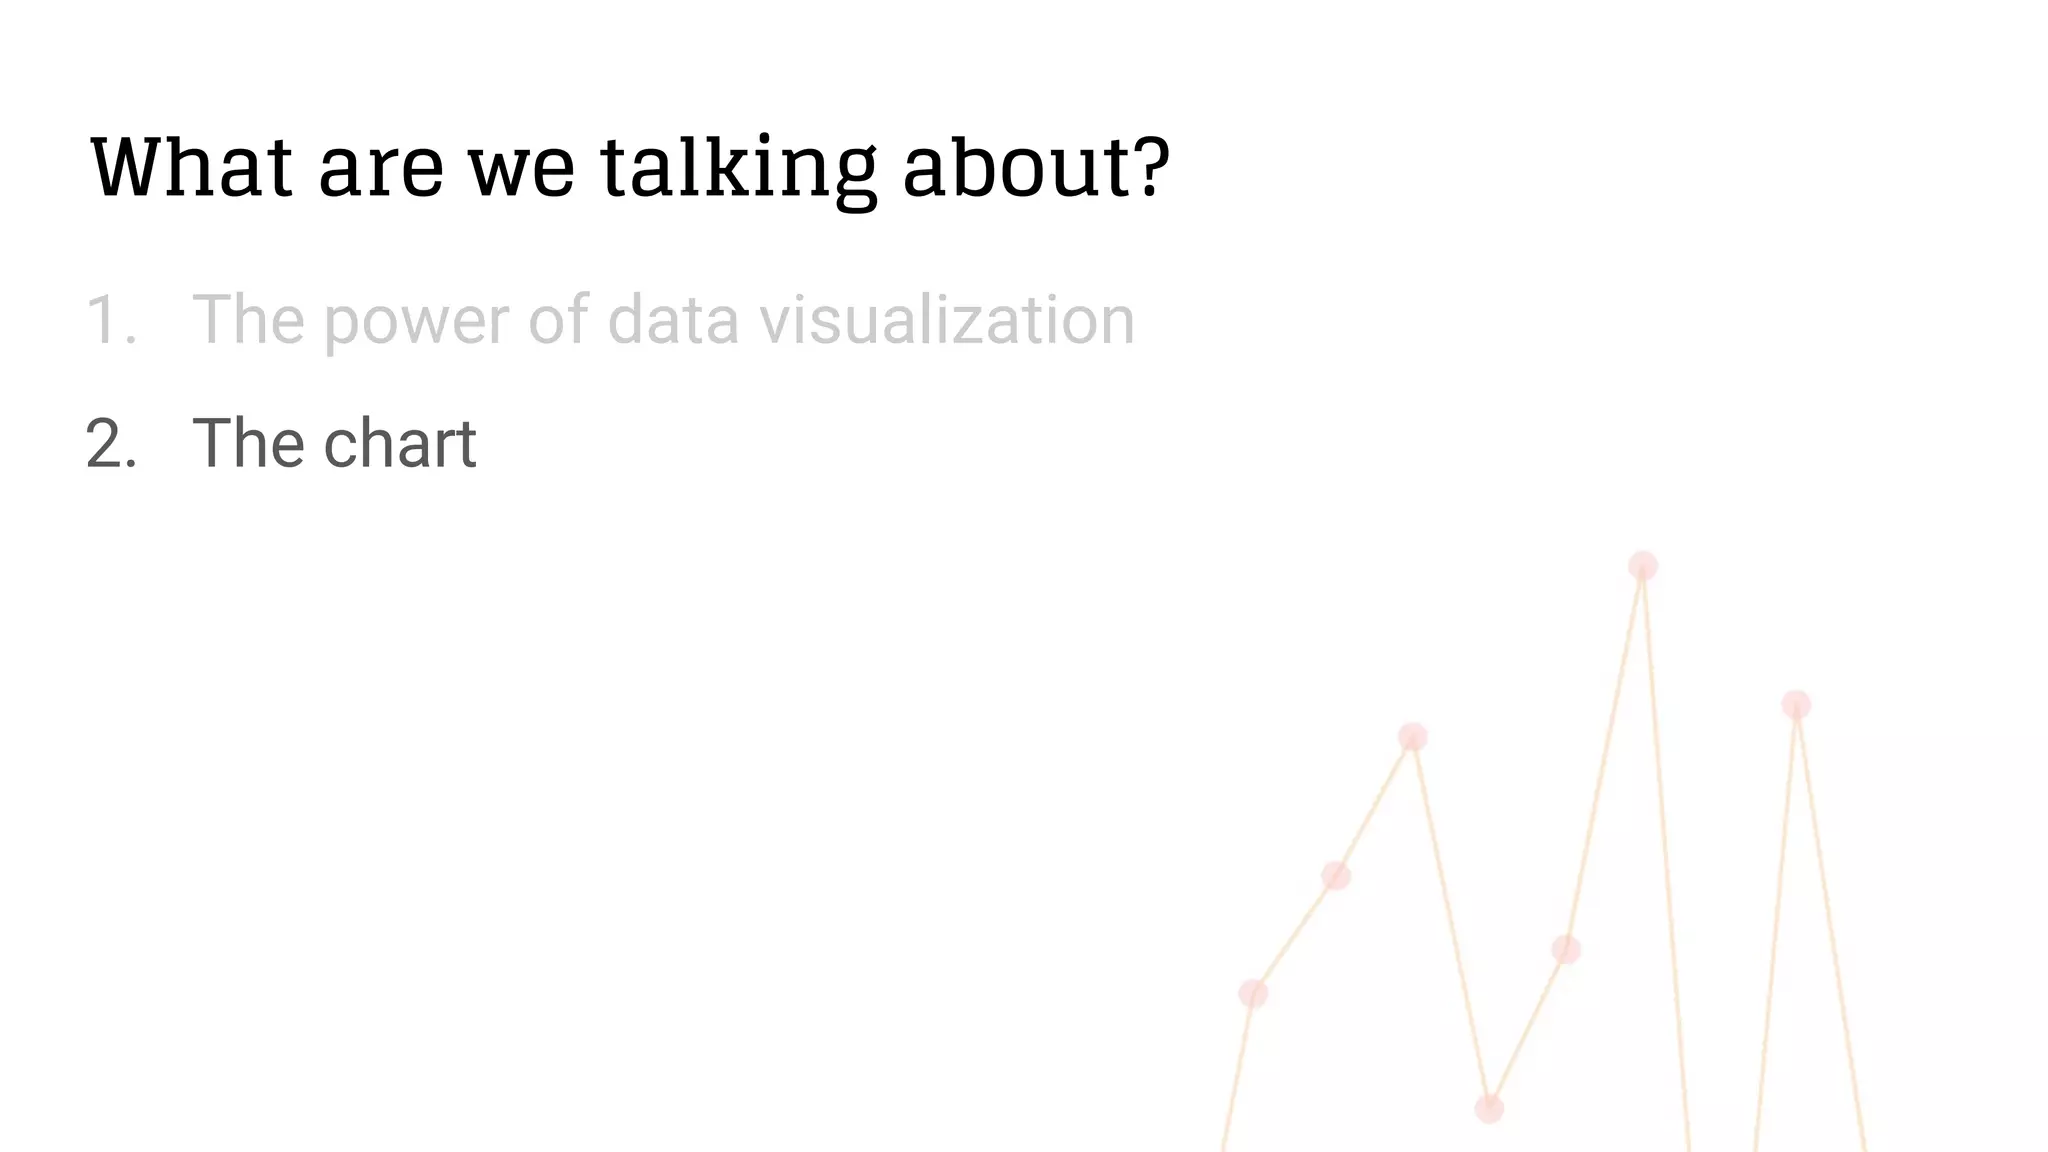
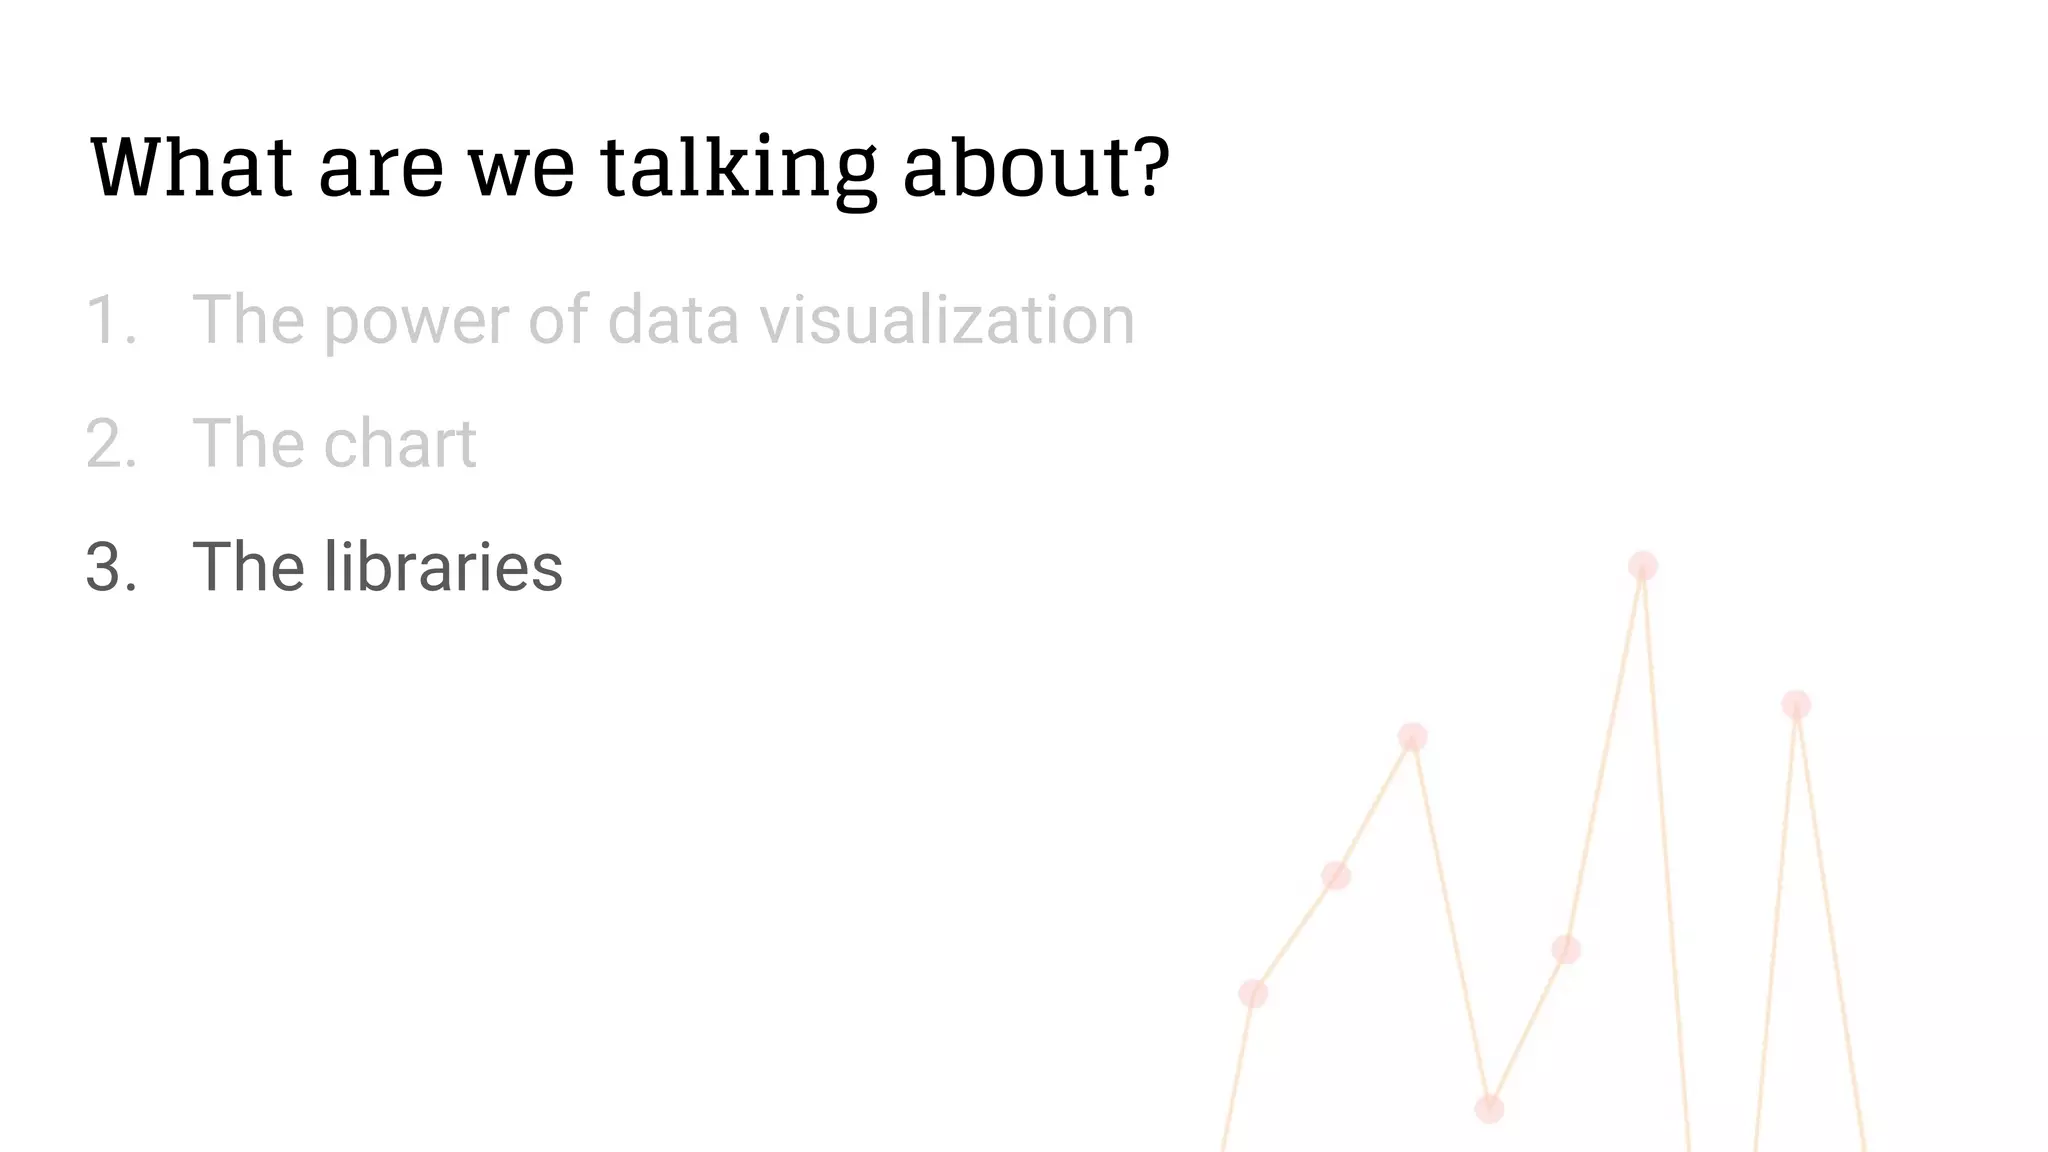
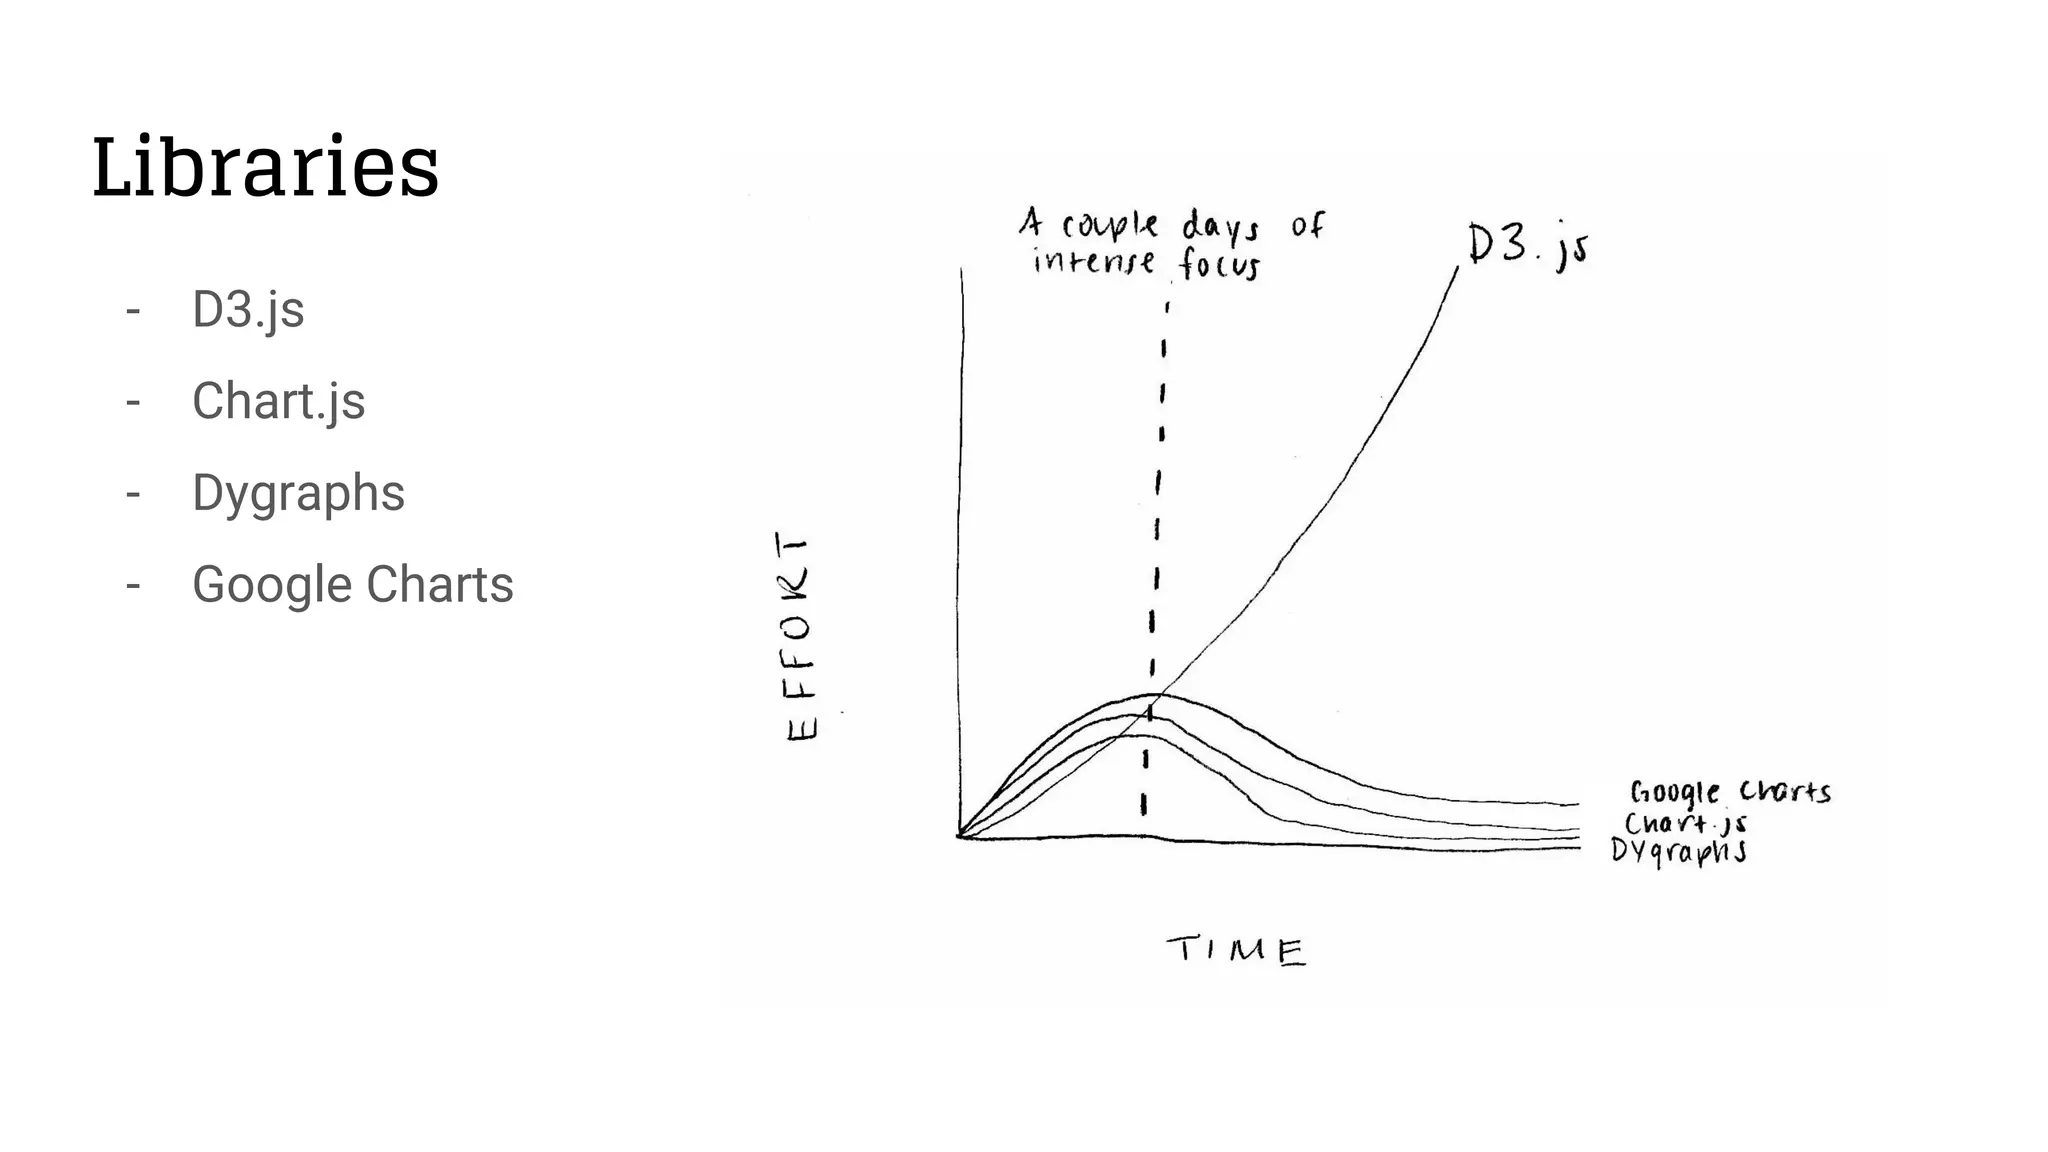
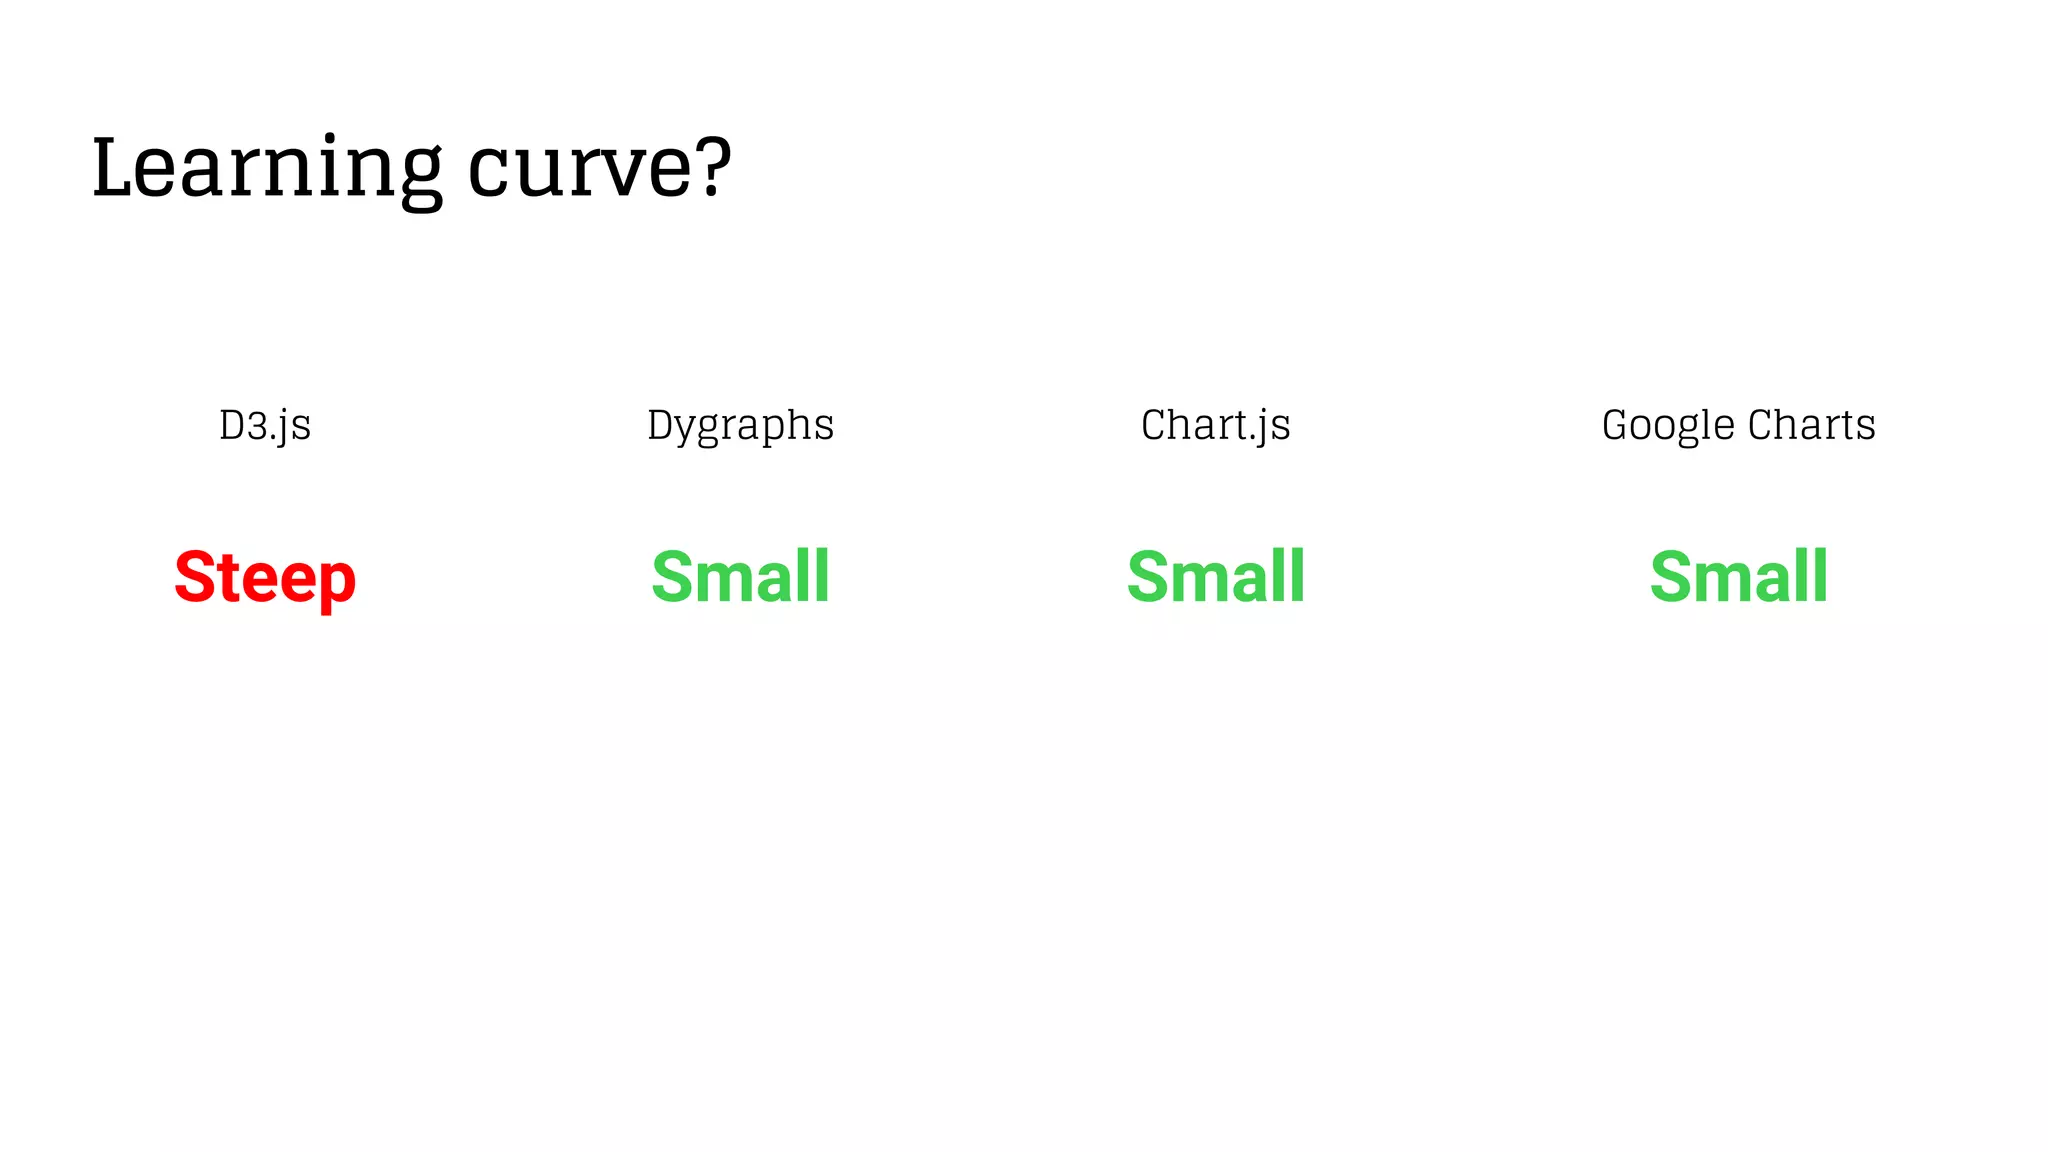
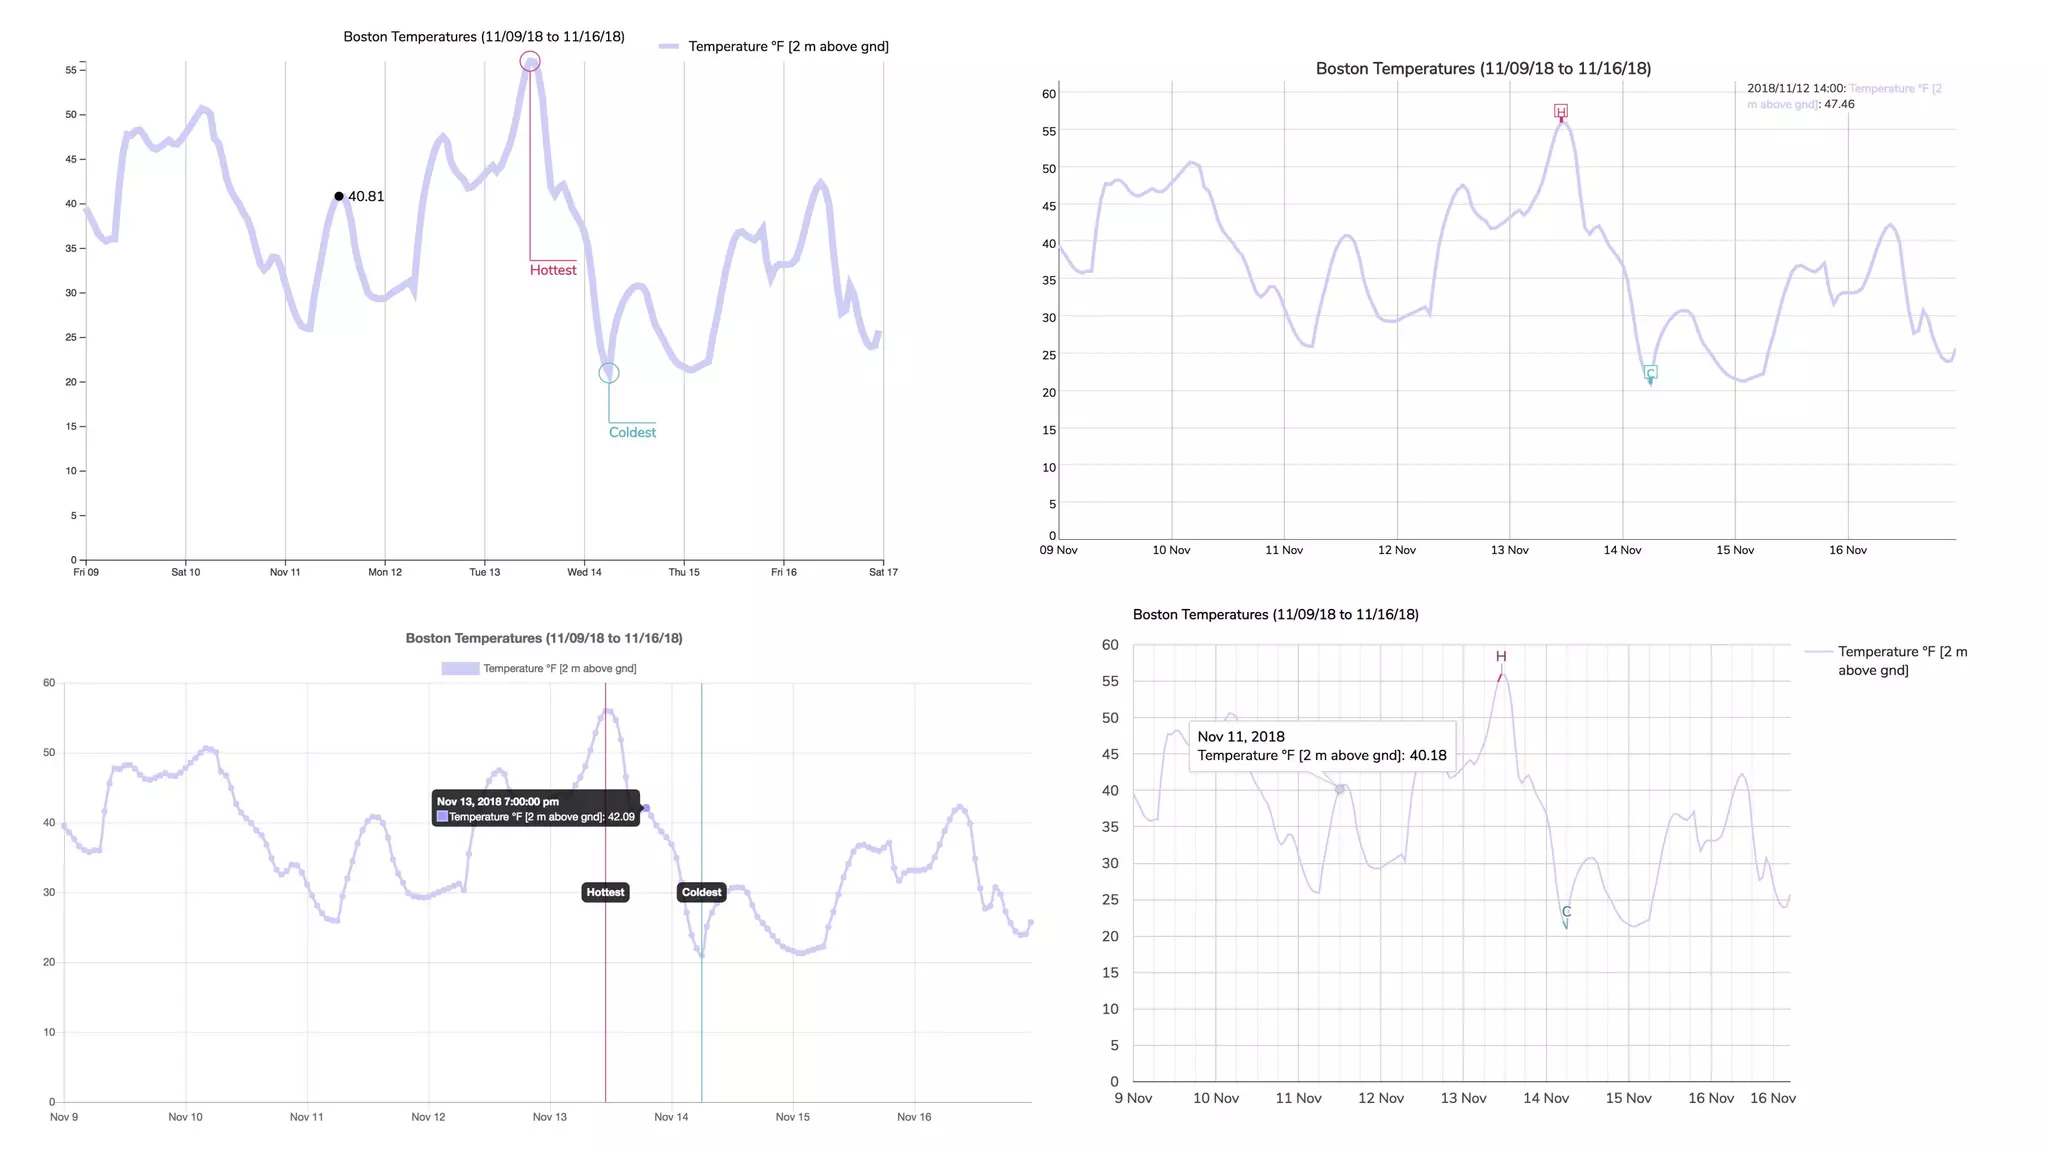
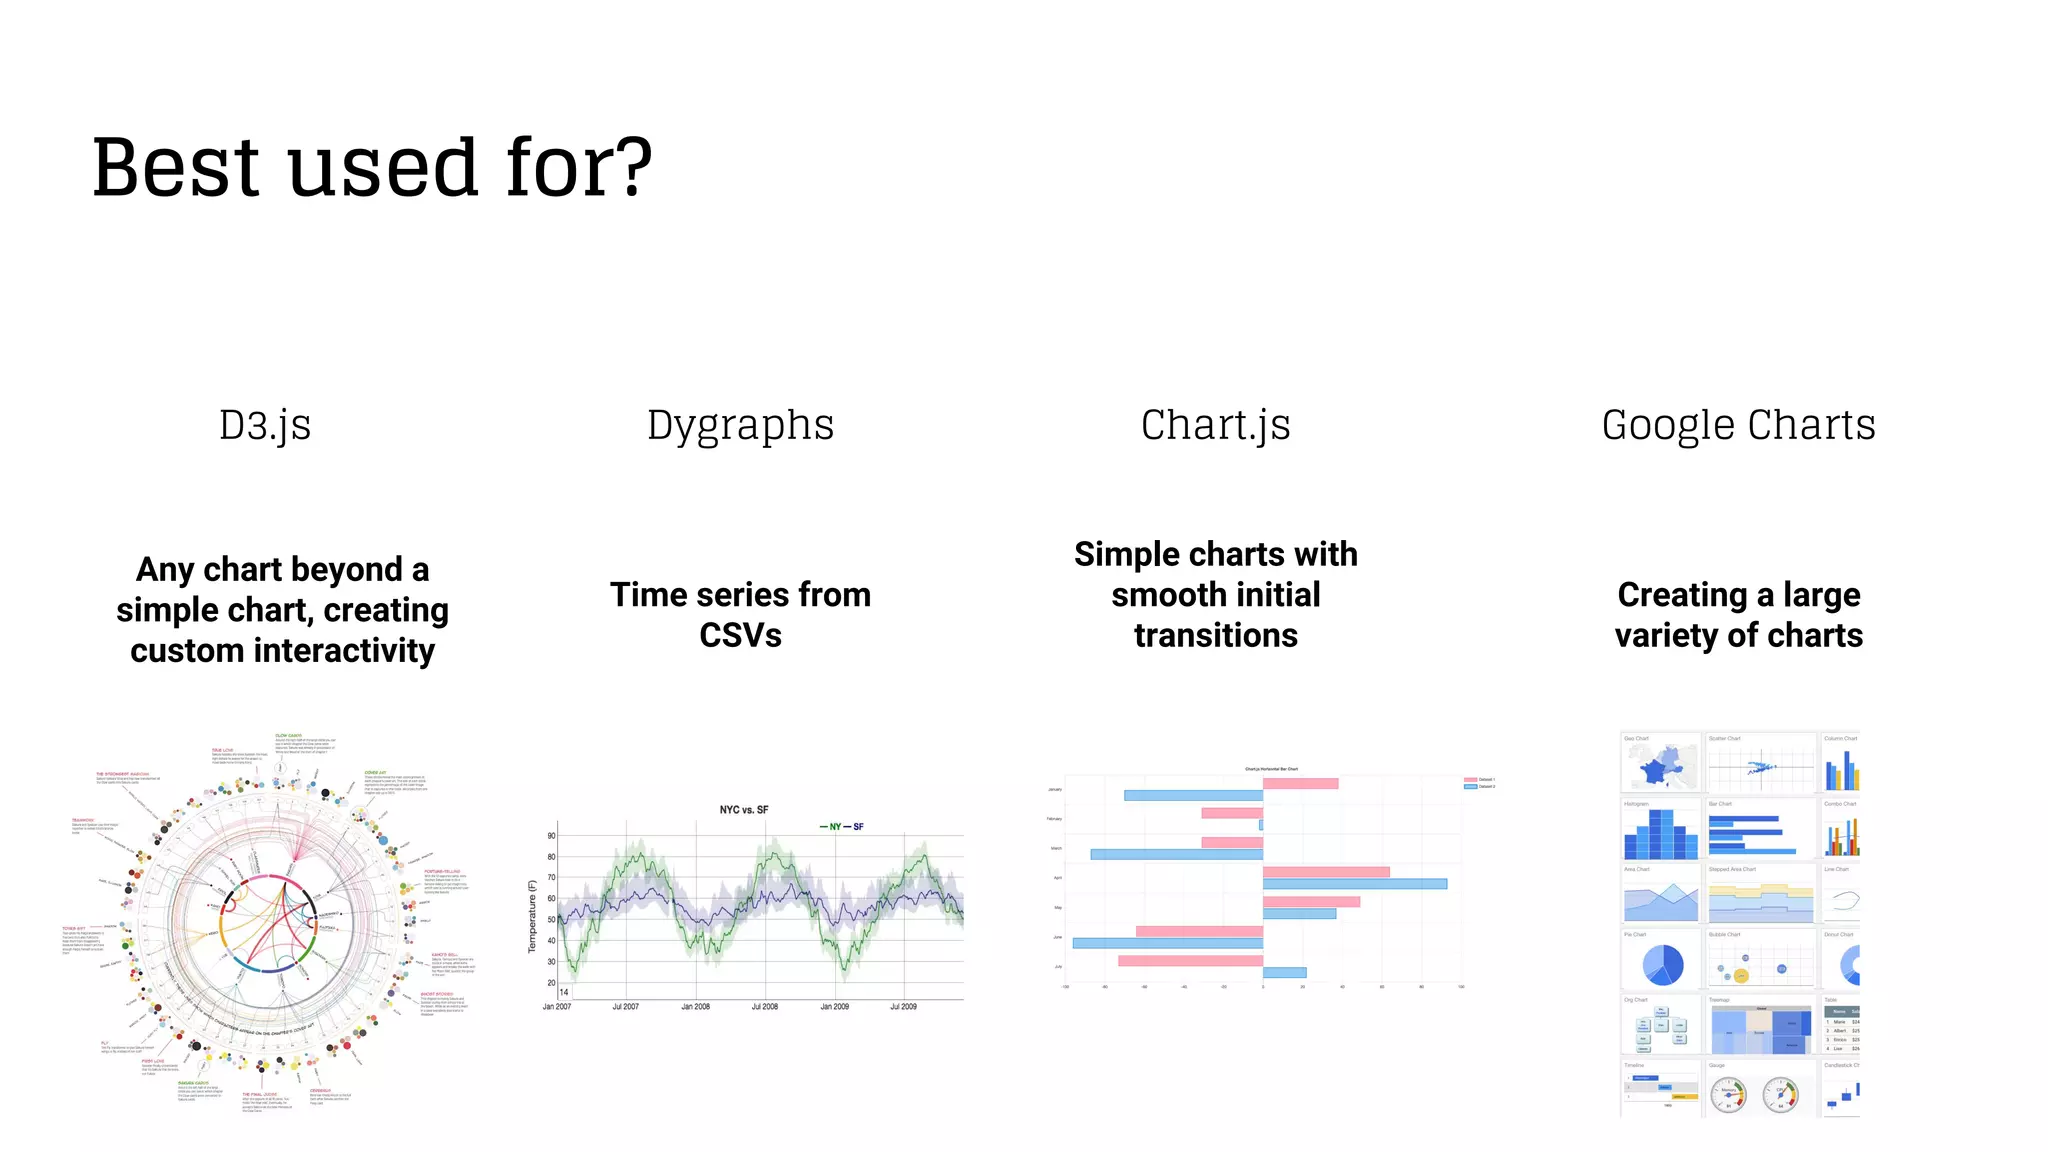
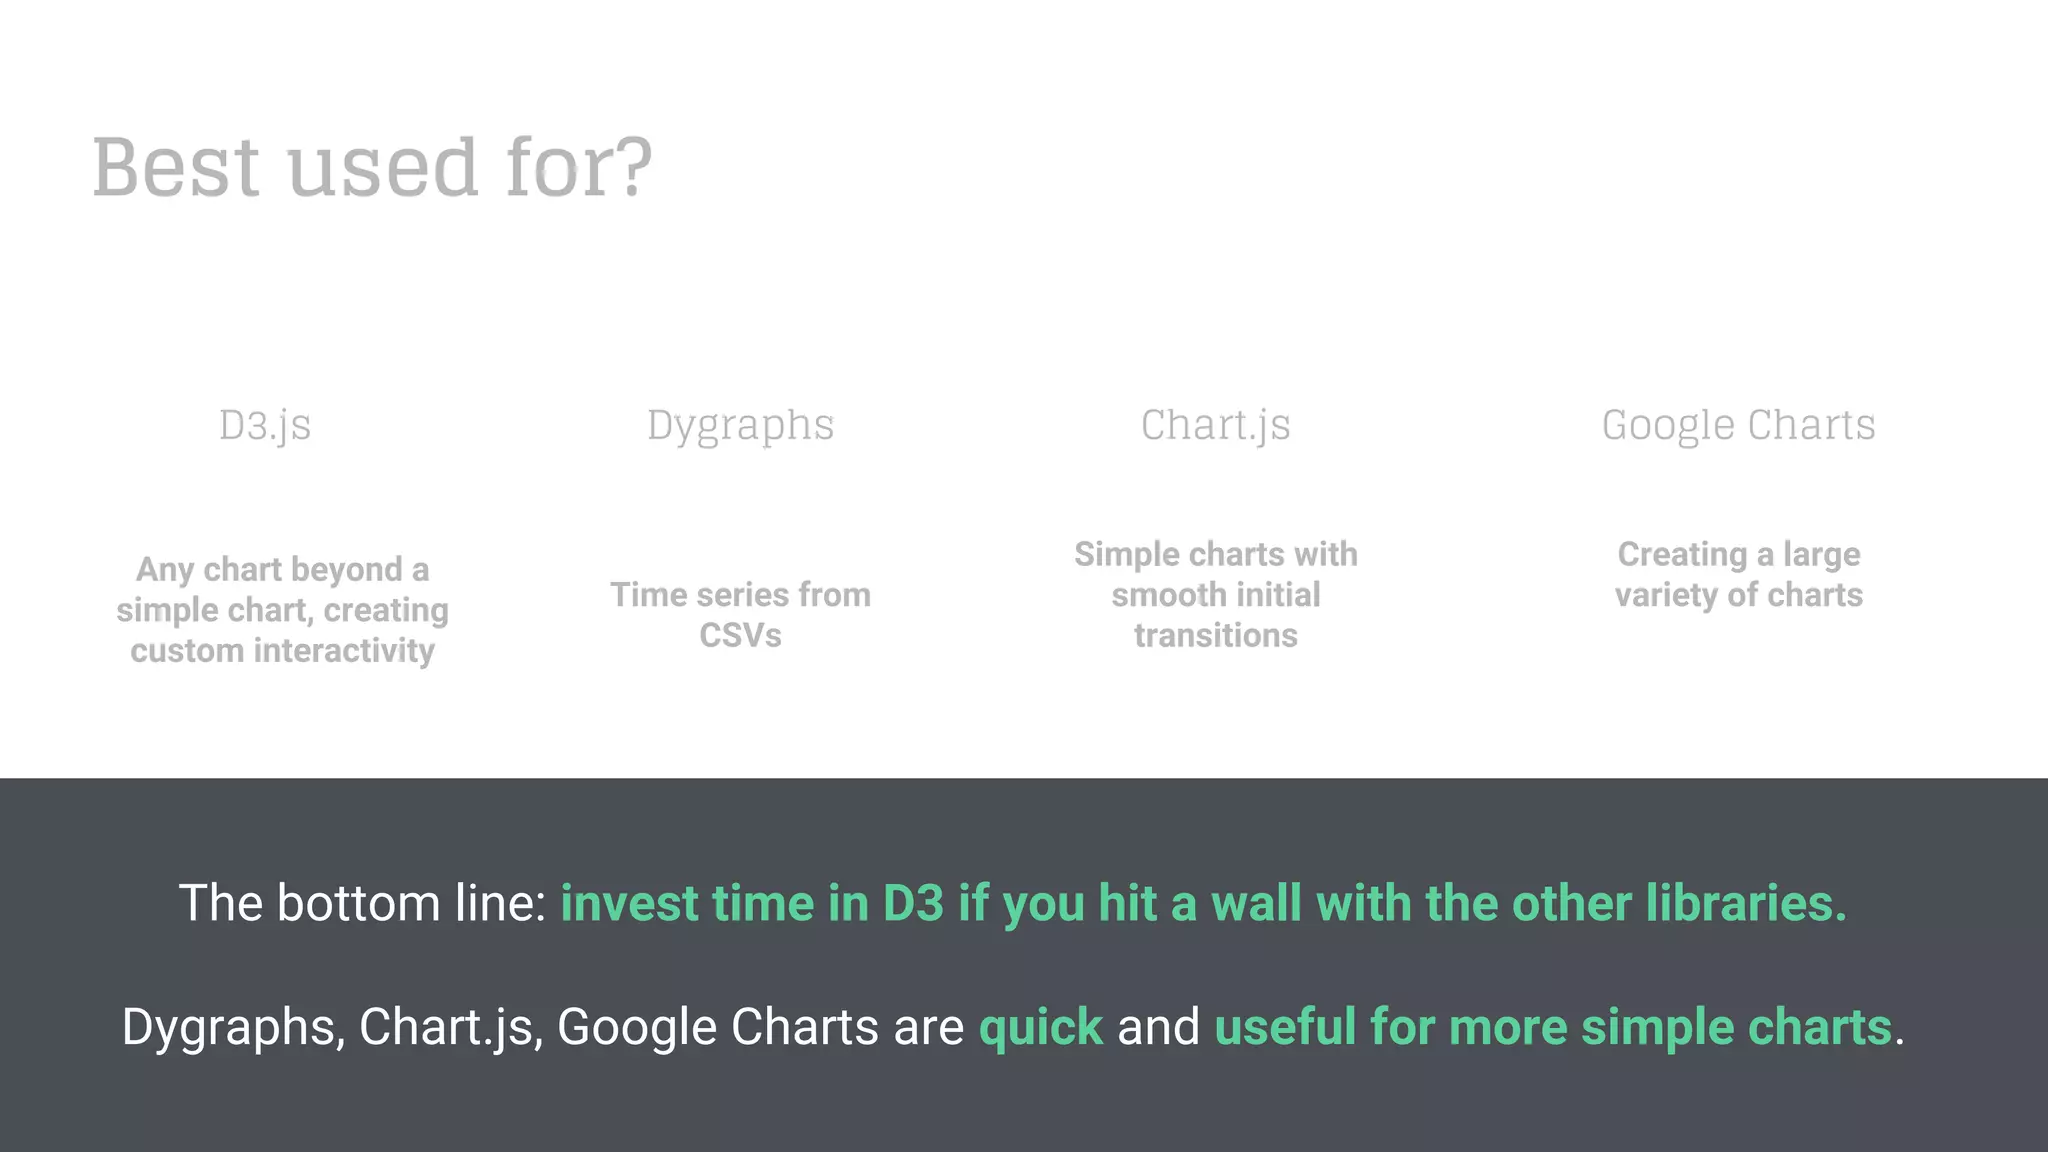
1. The document discusses the power of data visualization and different charting libraries for JavaScript including D3.js, Chart.js, Dygraphs, and Google Charts.
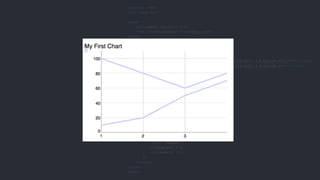
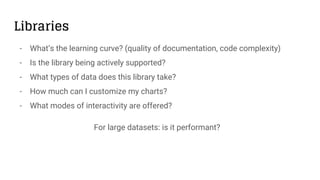
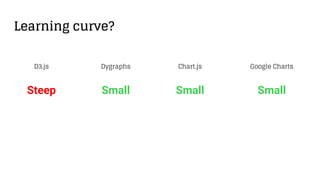
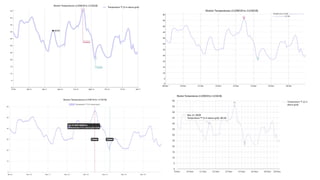
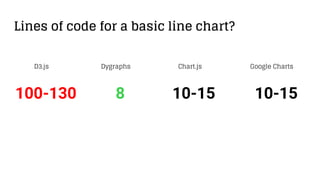
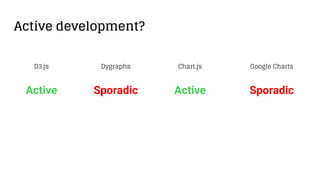
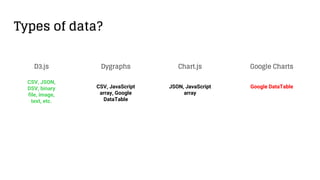
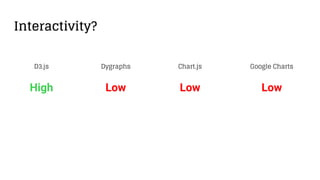
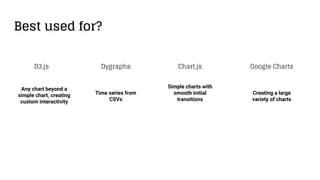
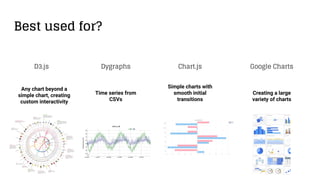
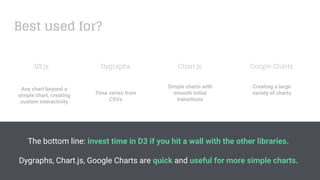
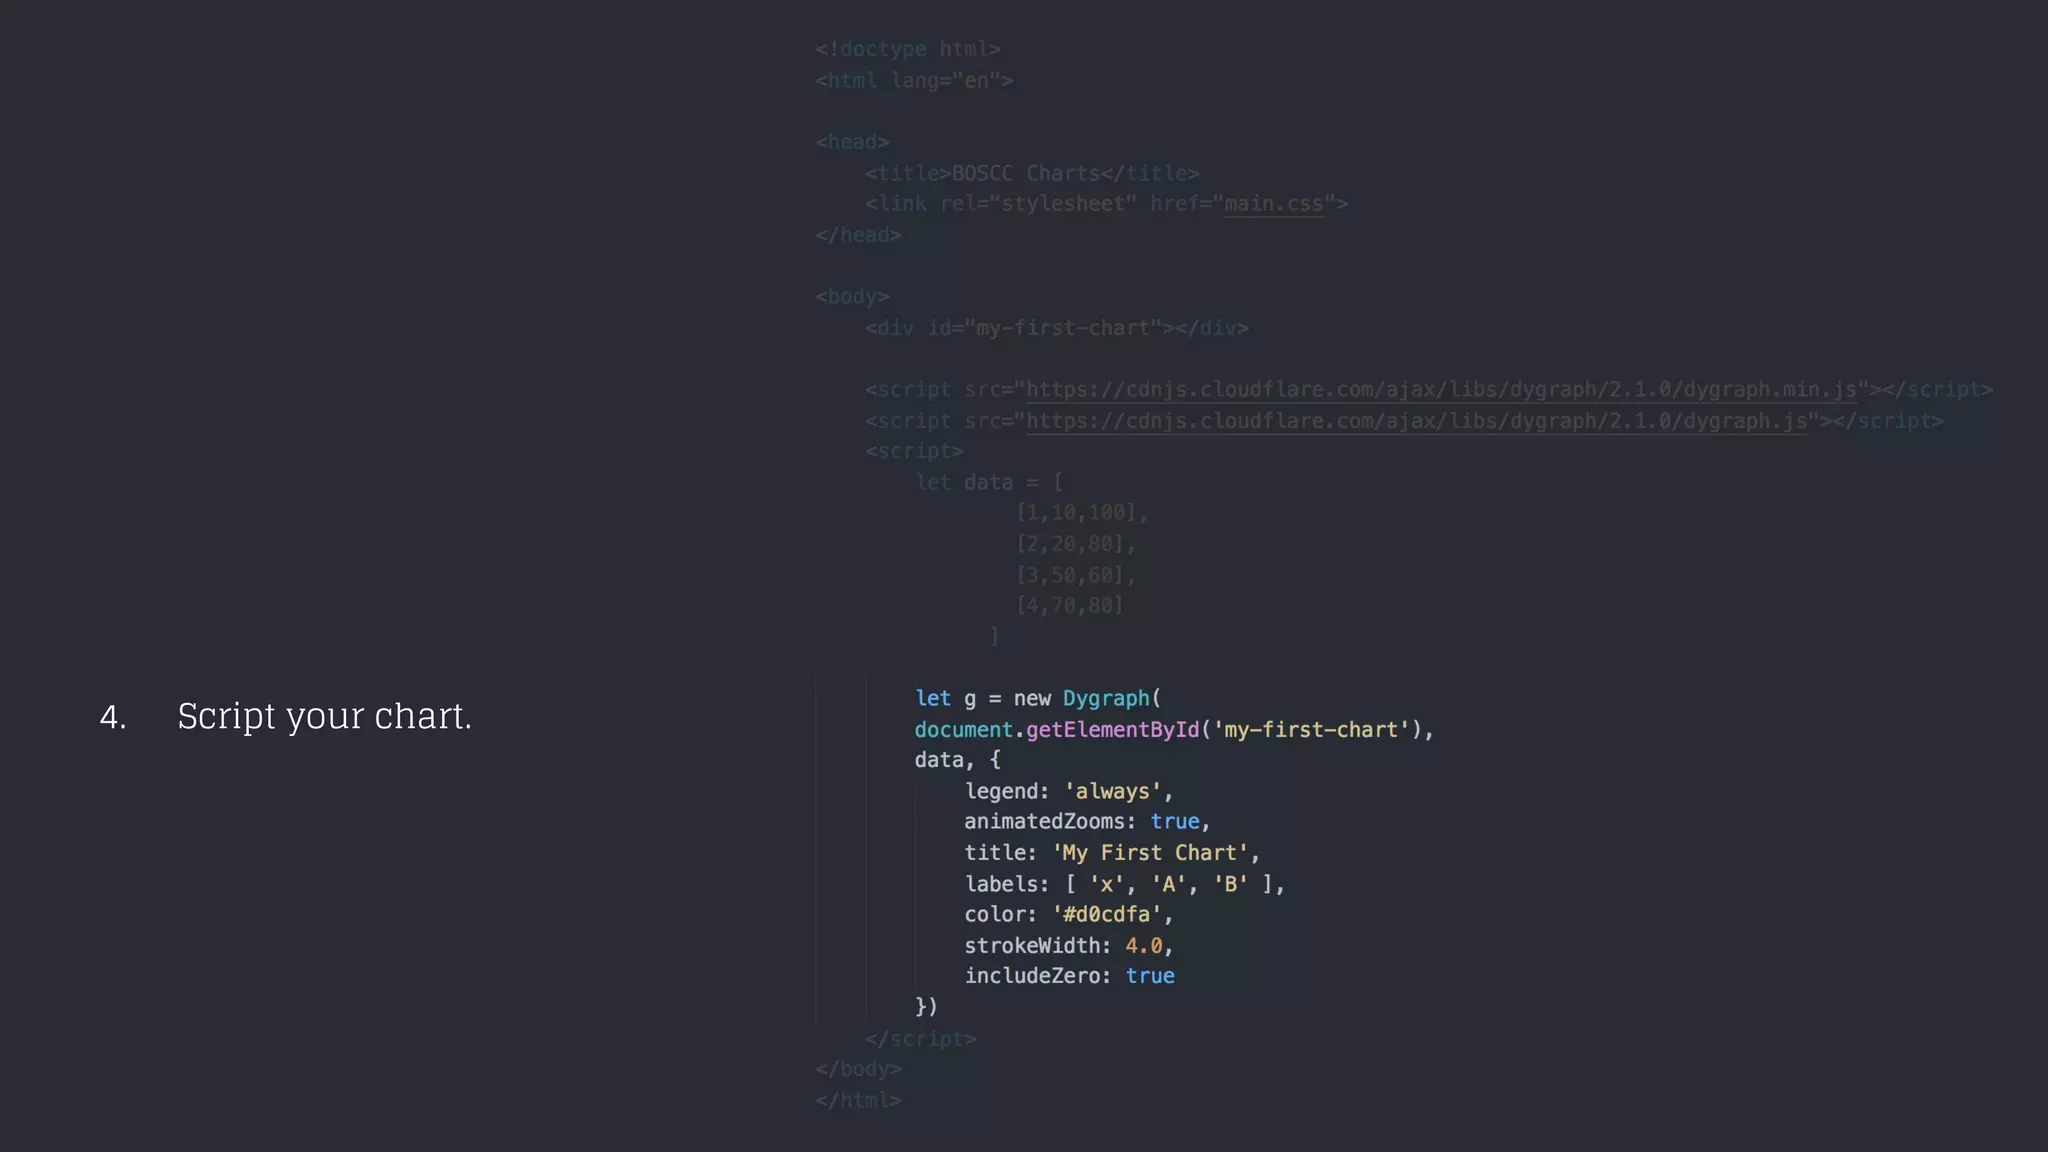
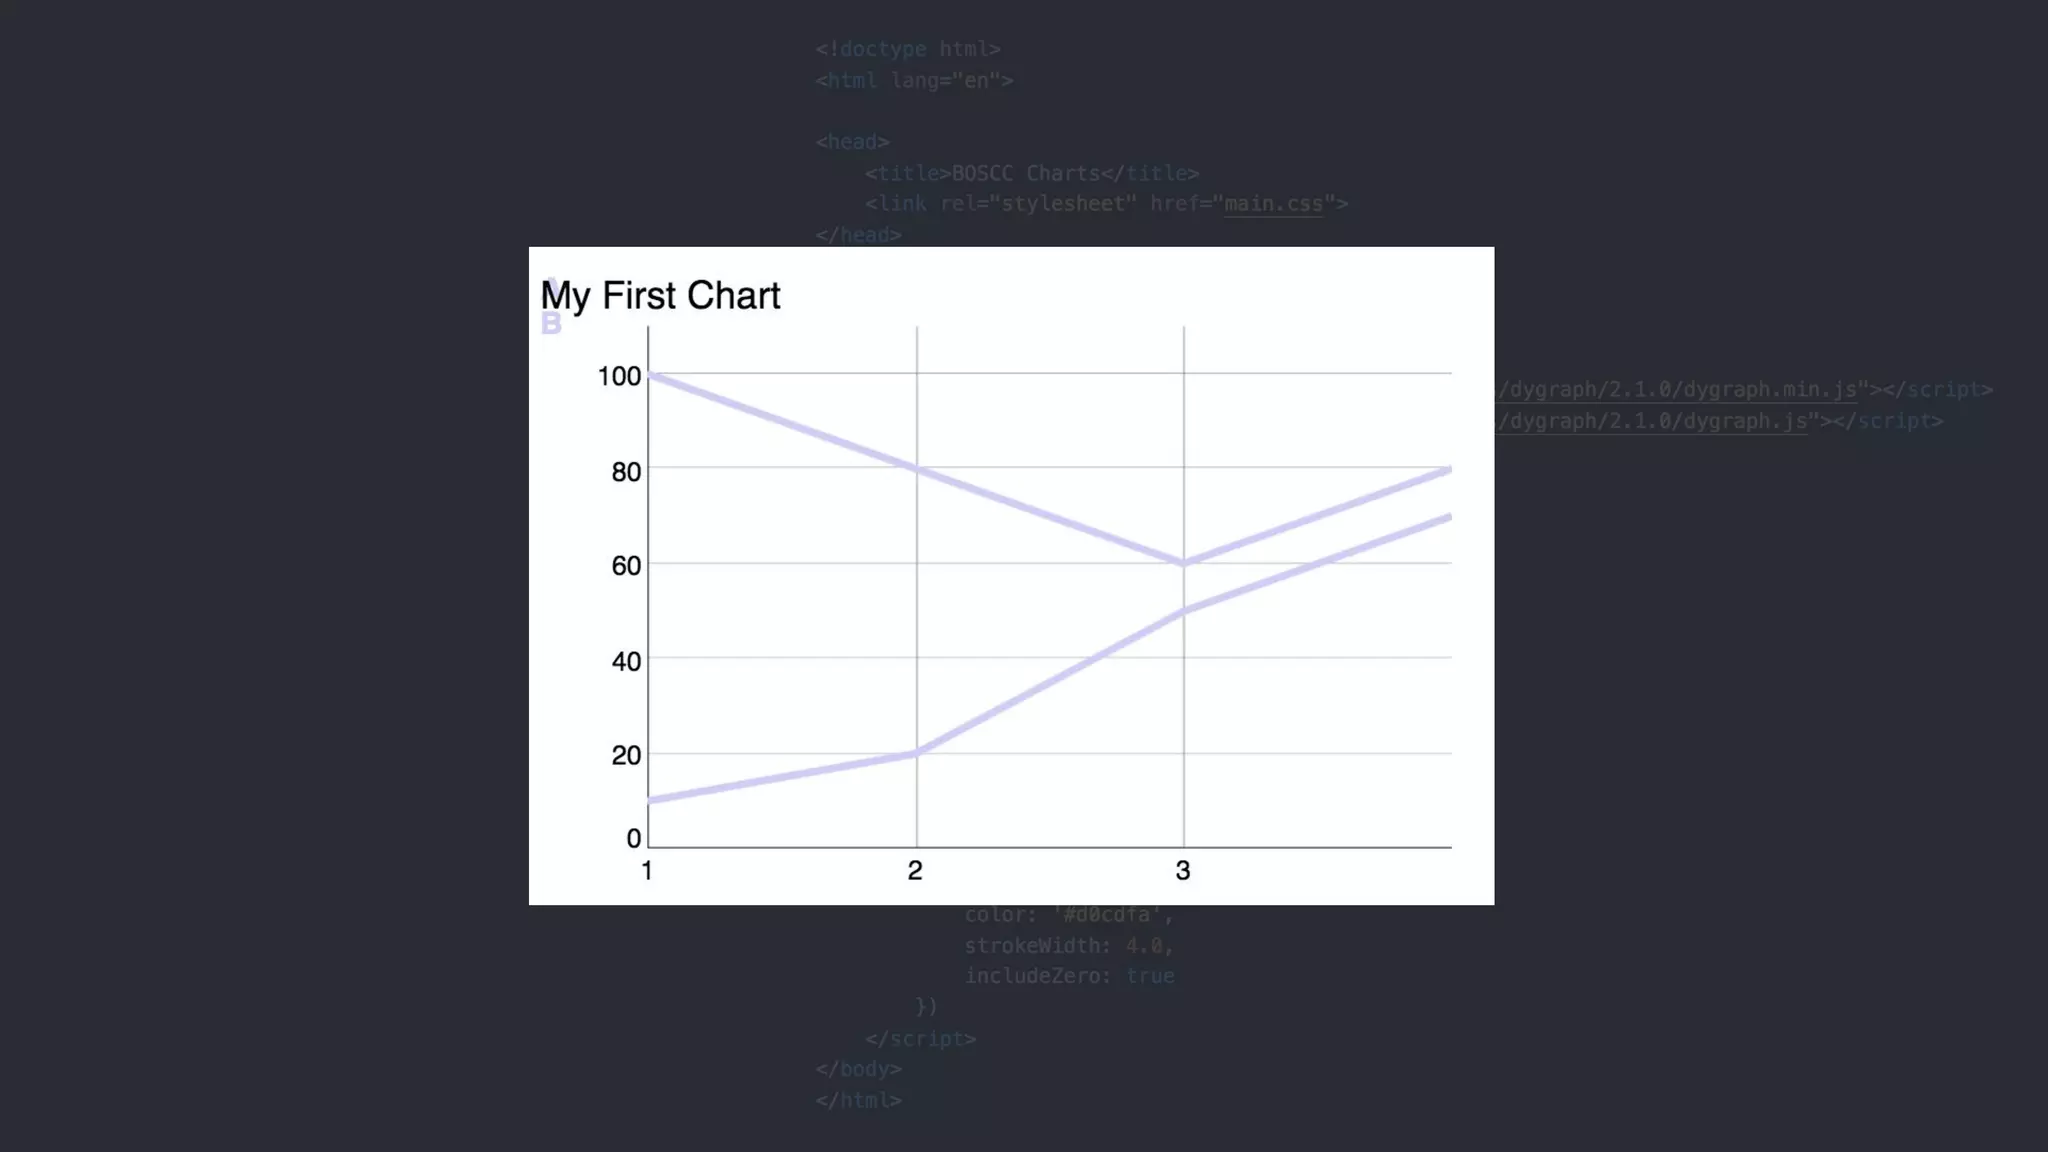
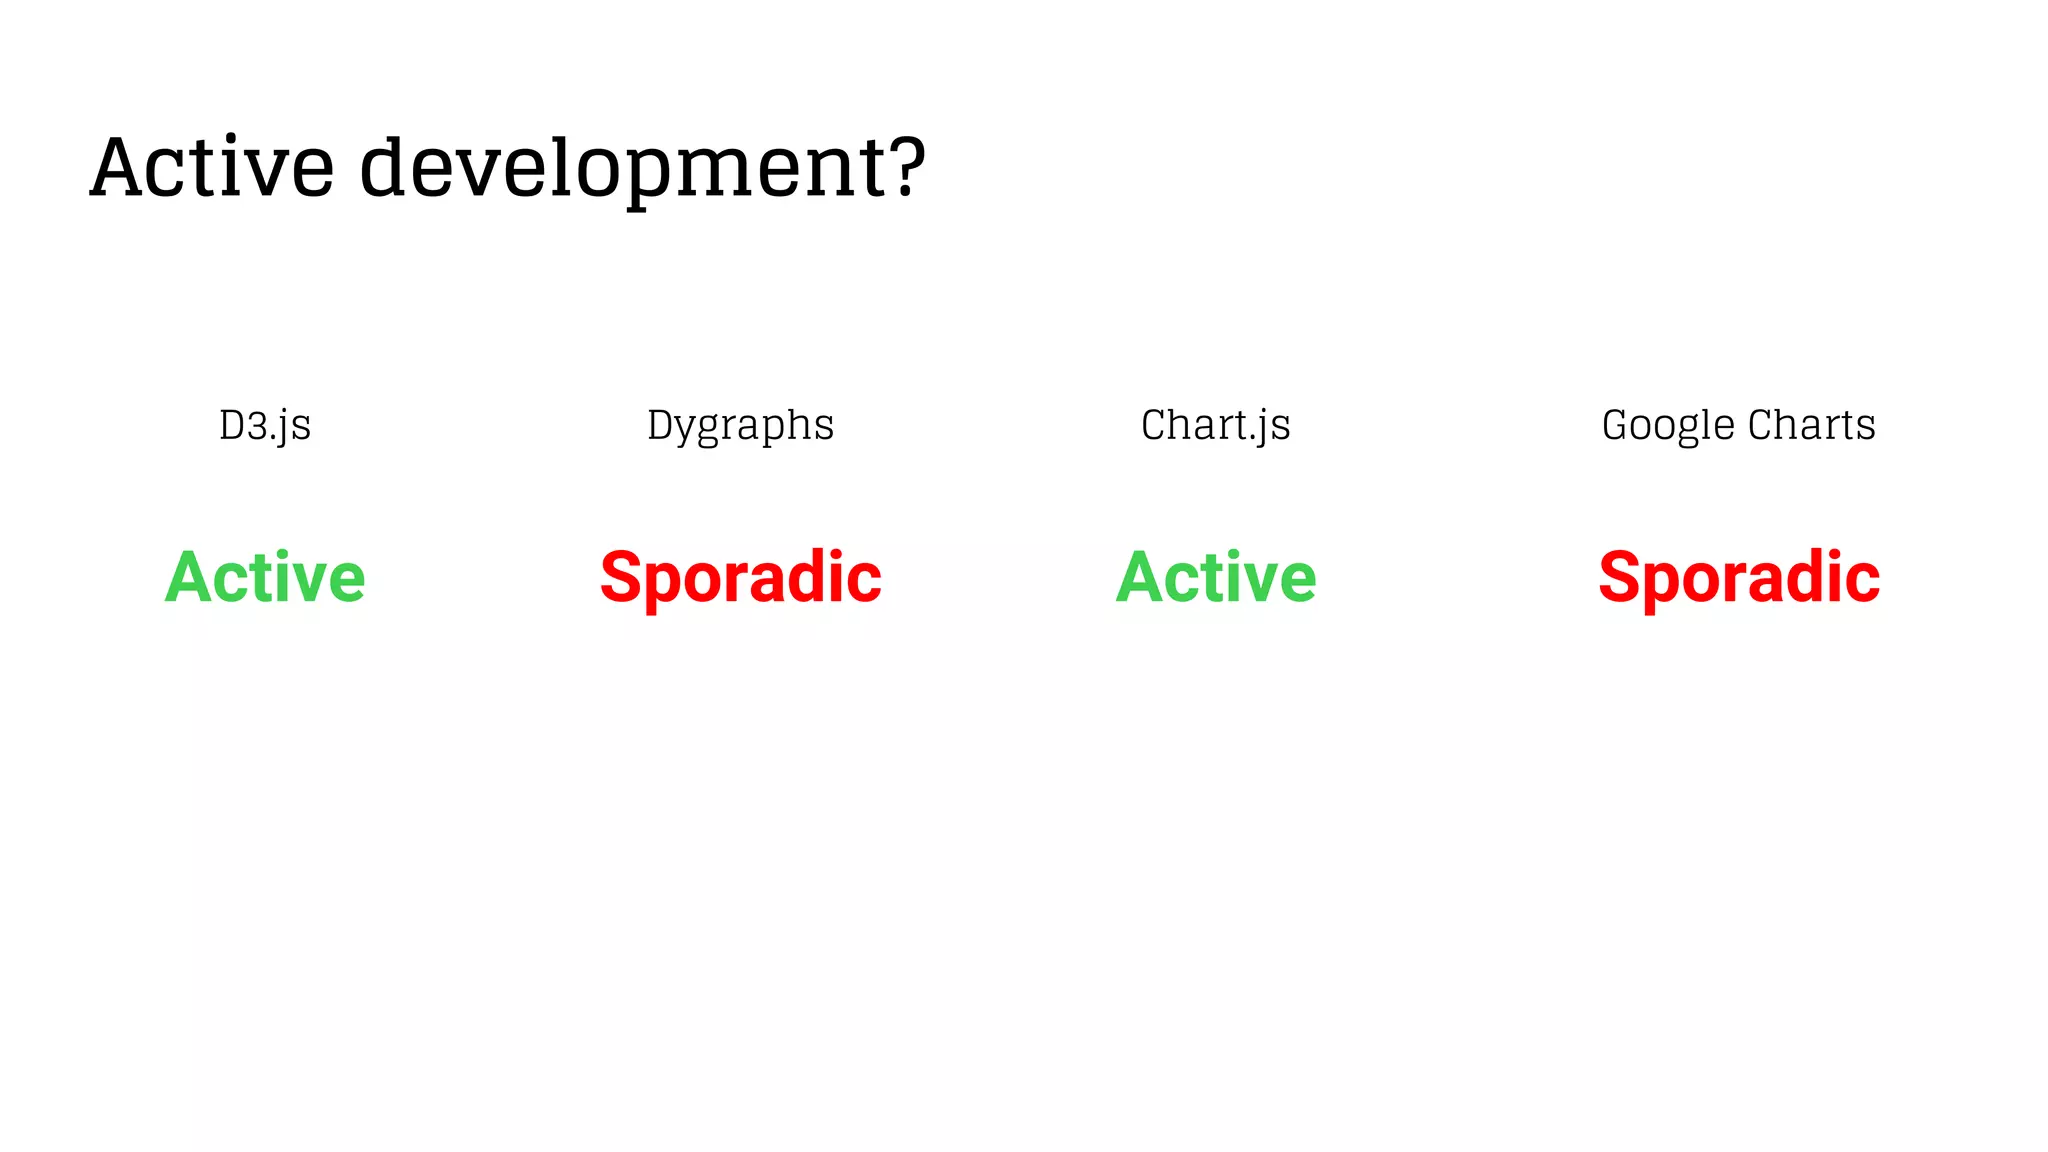
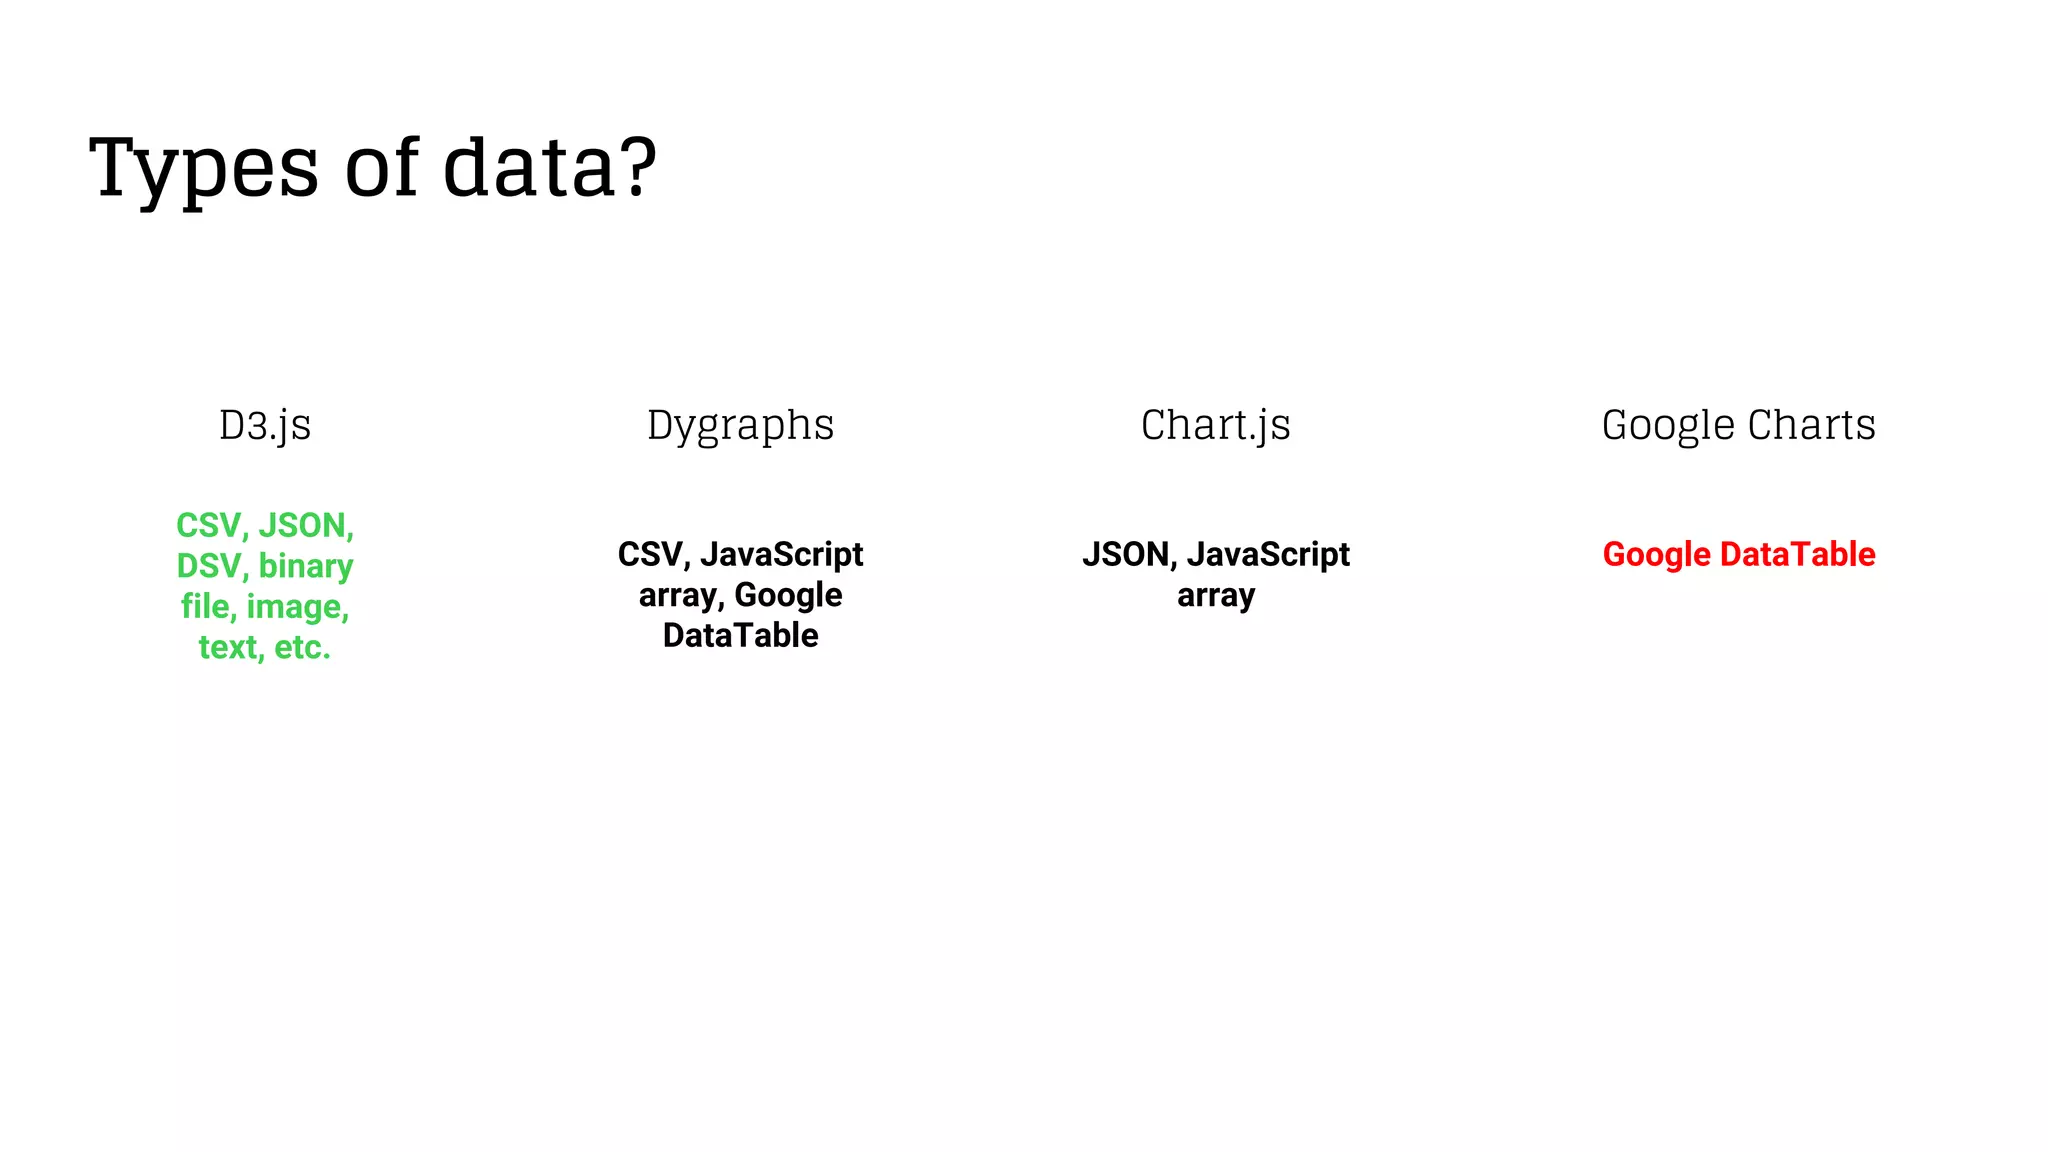
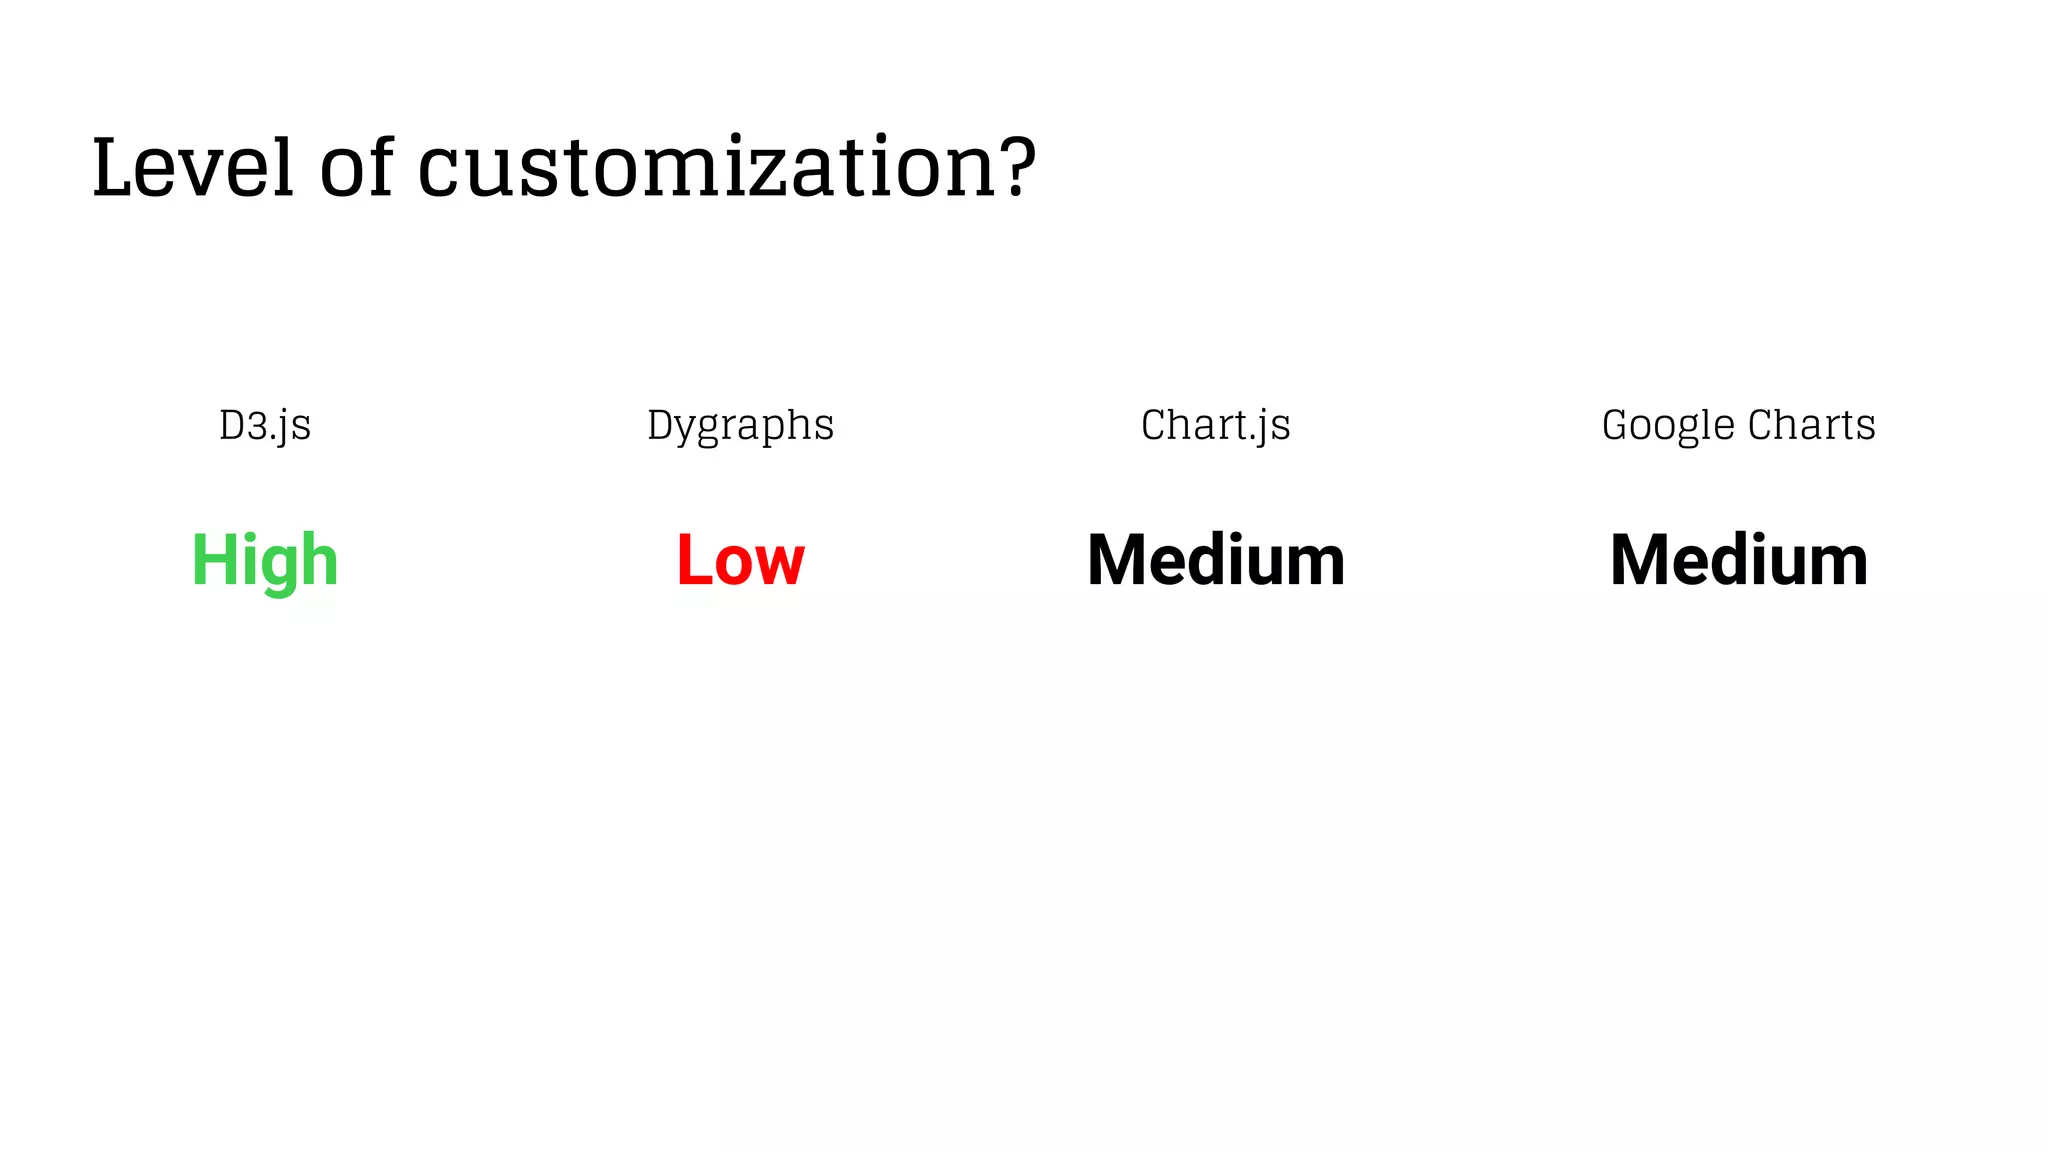
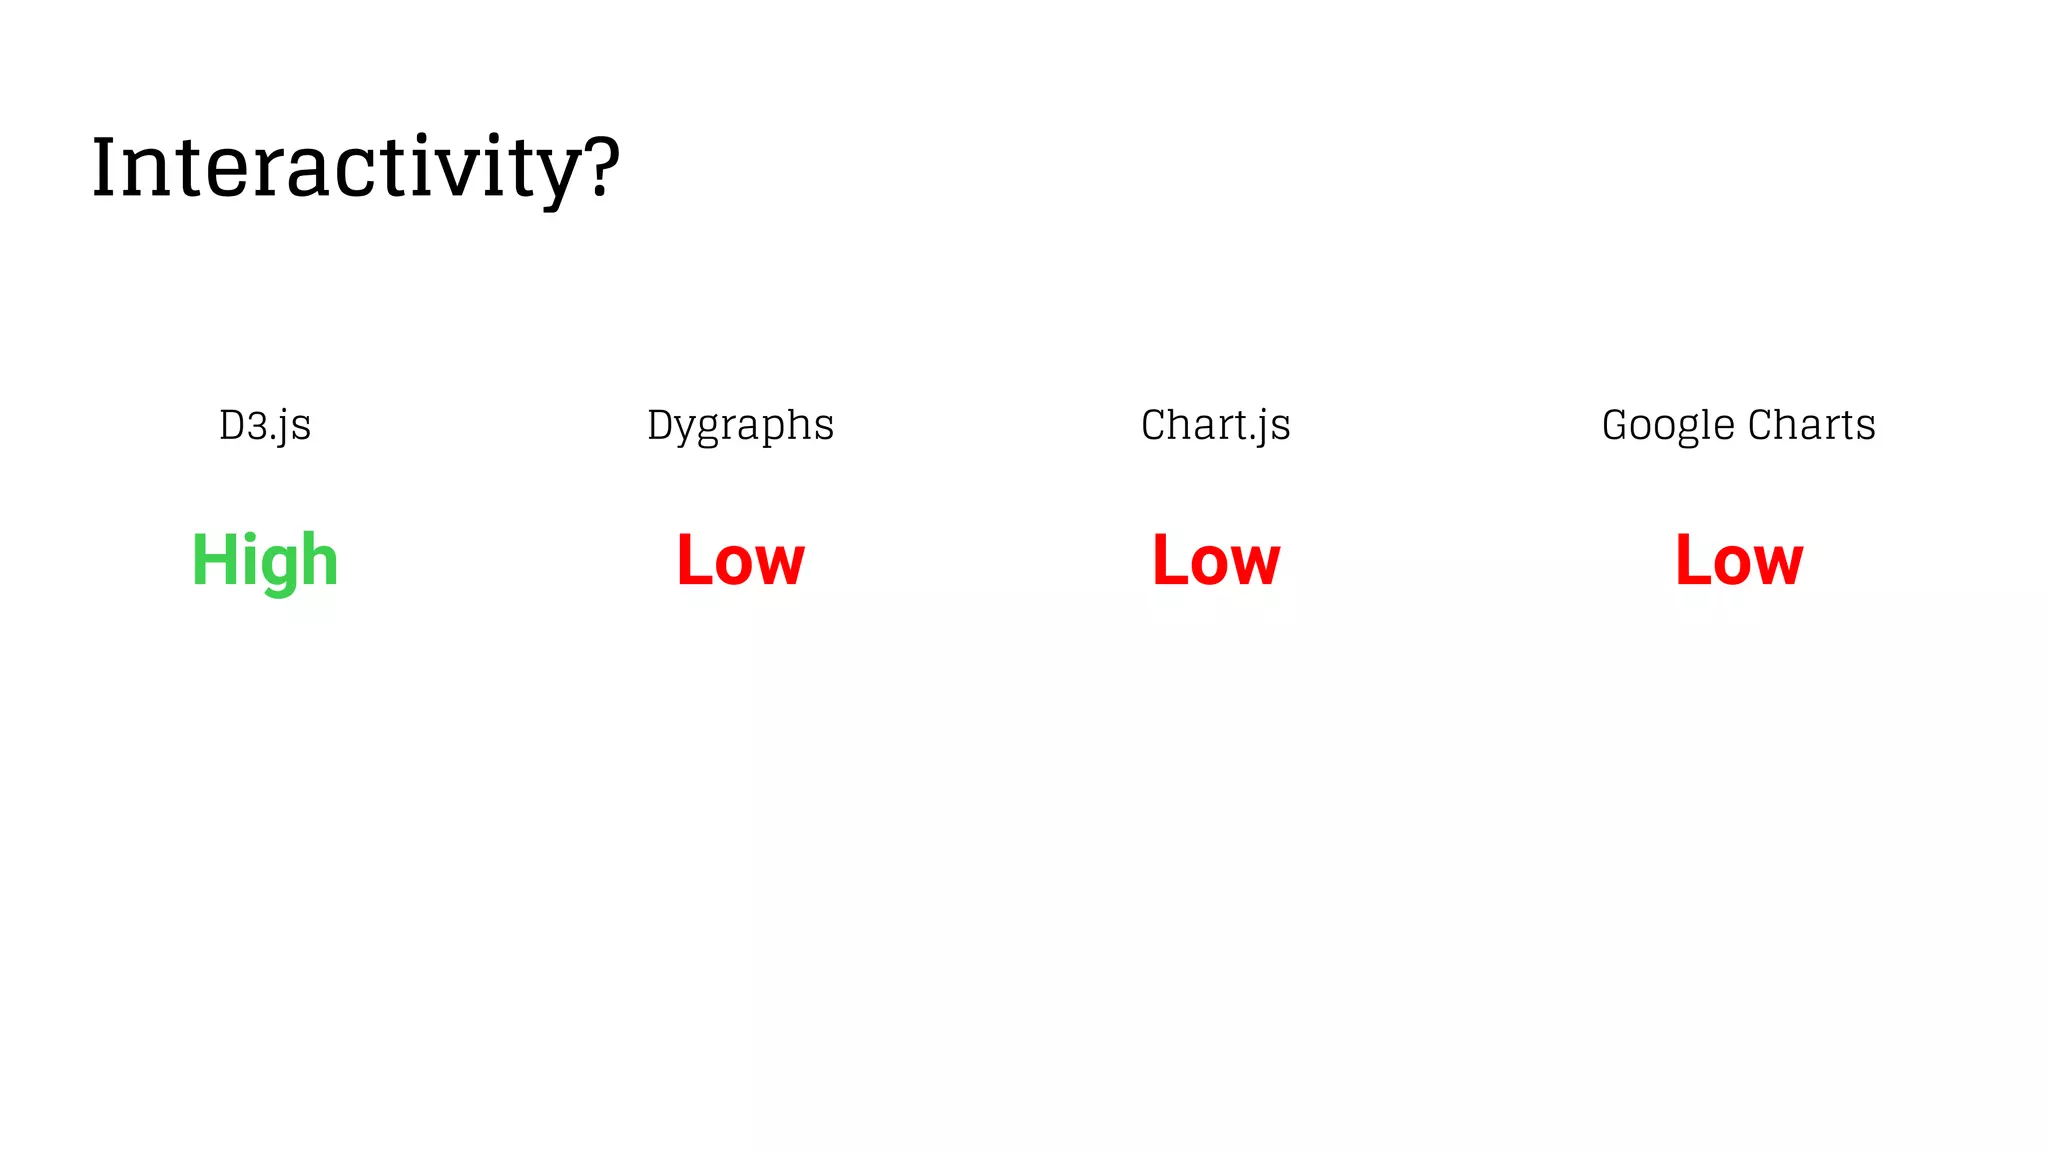
2. It provides information on each library's learning curve, lines of code needed for basic charts, level of customization, interactivity, and best uses.
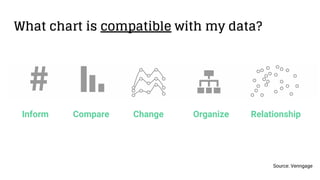
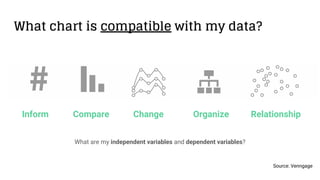
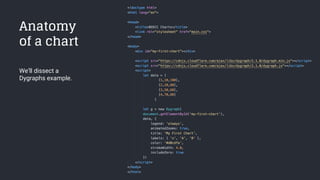
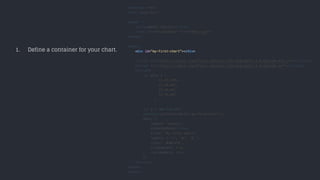
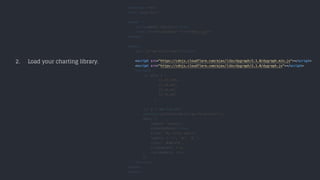
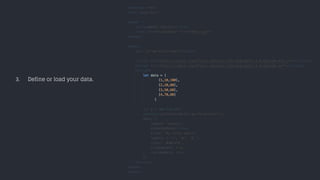
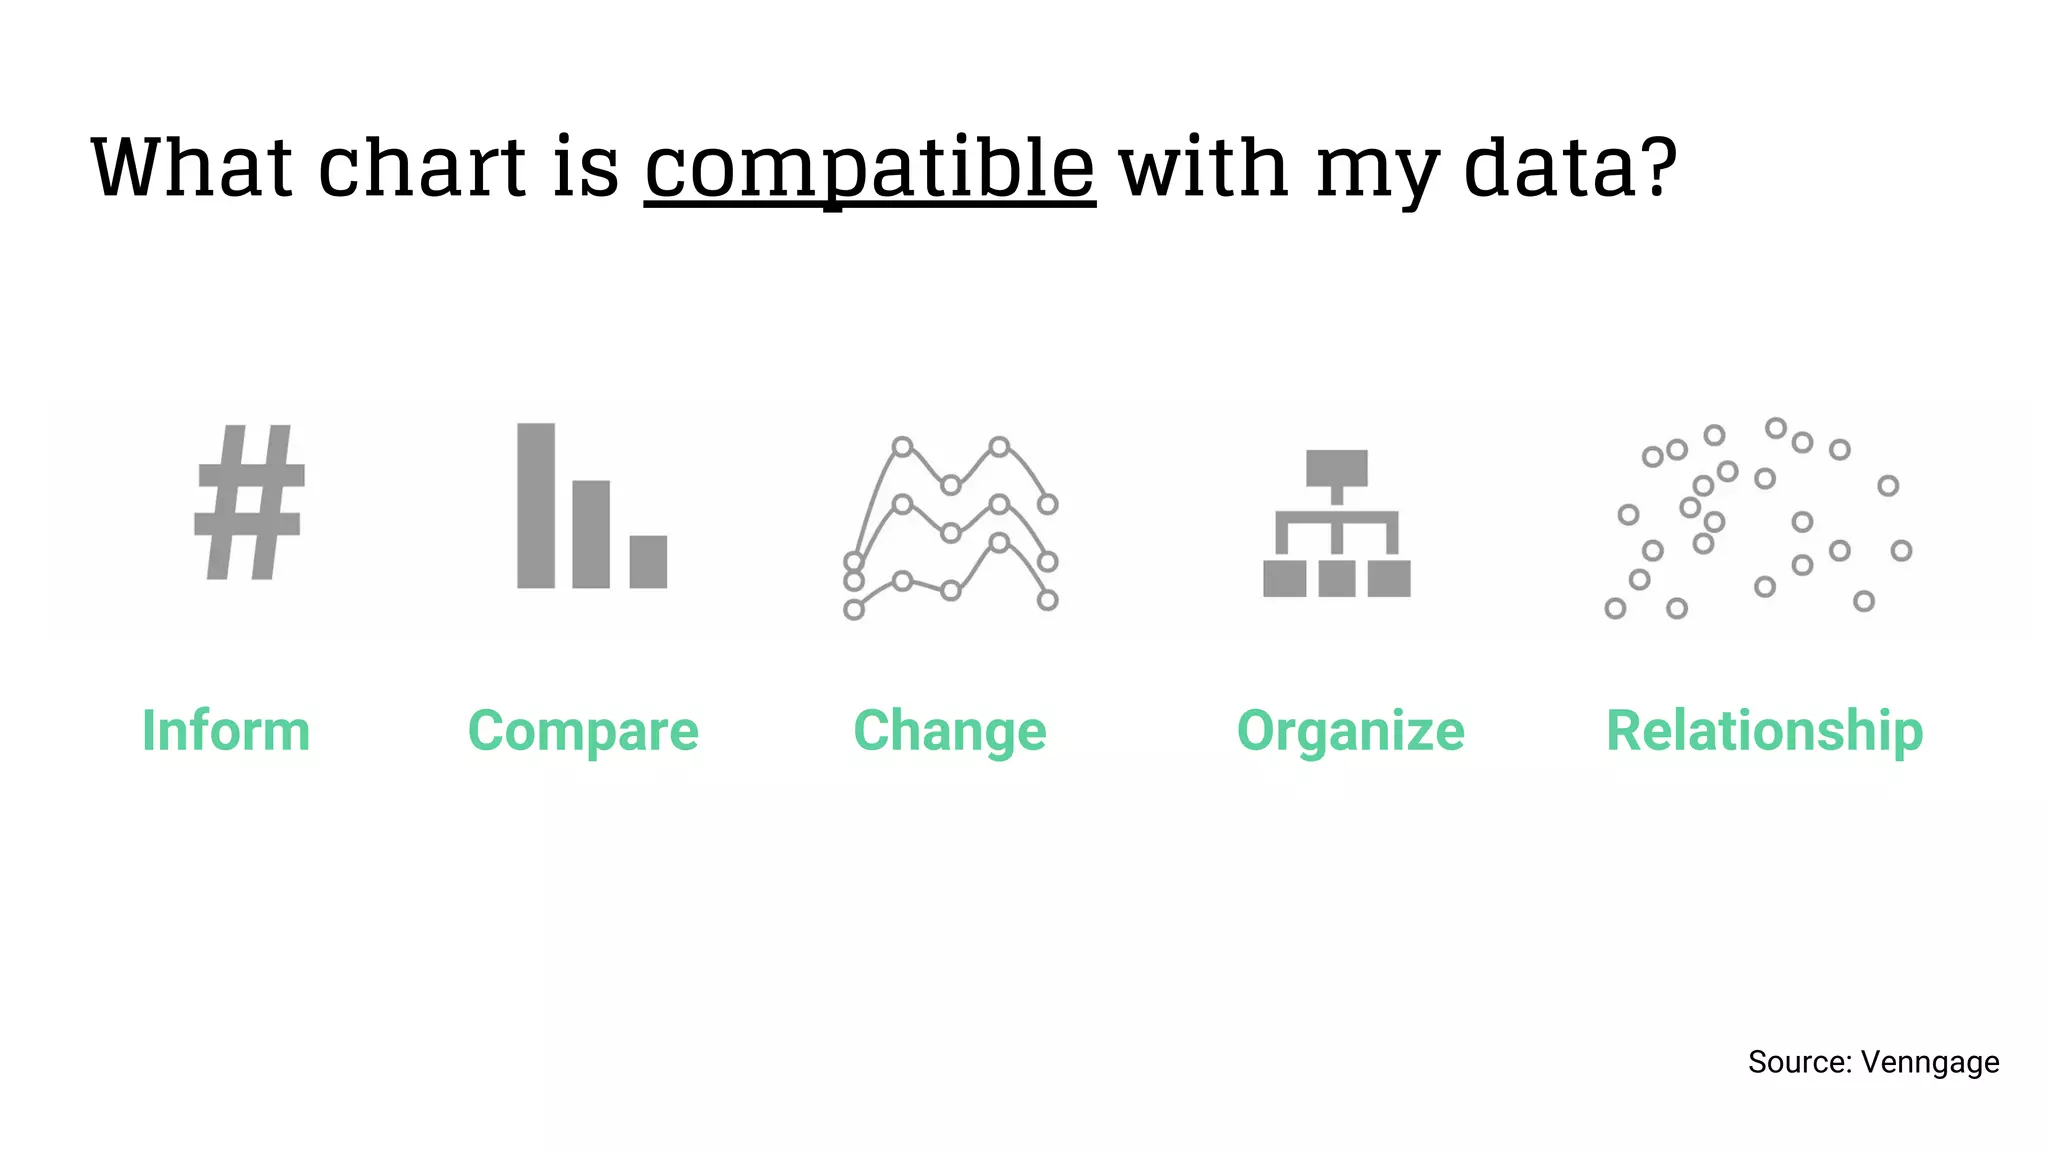
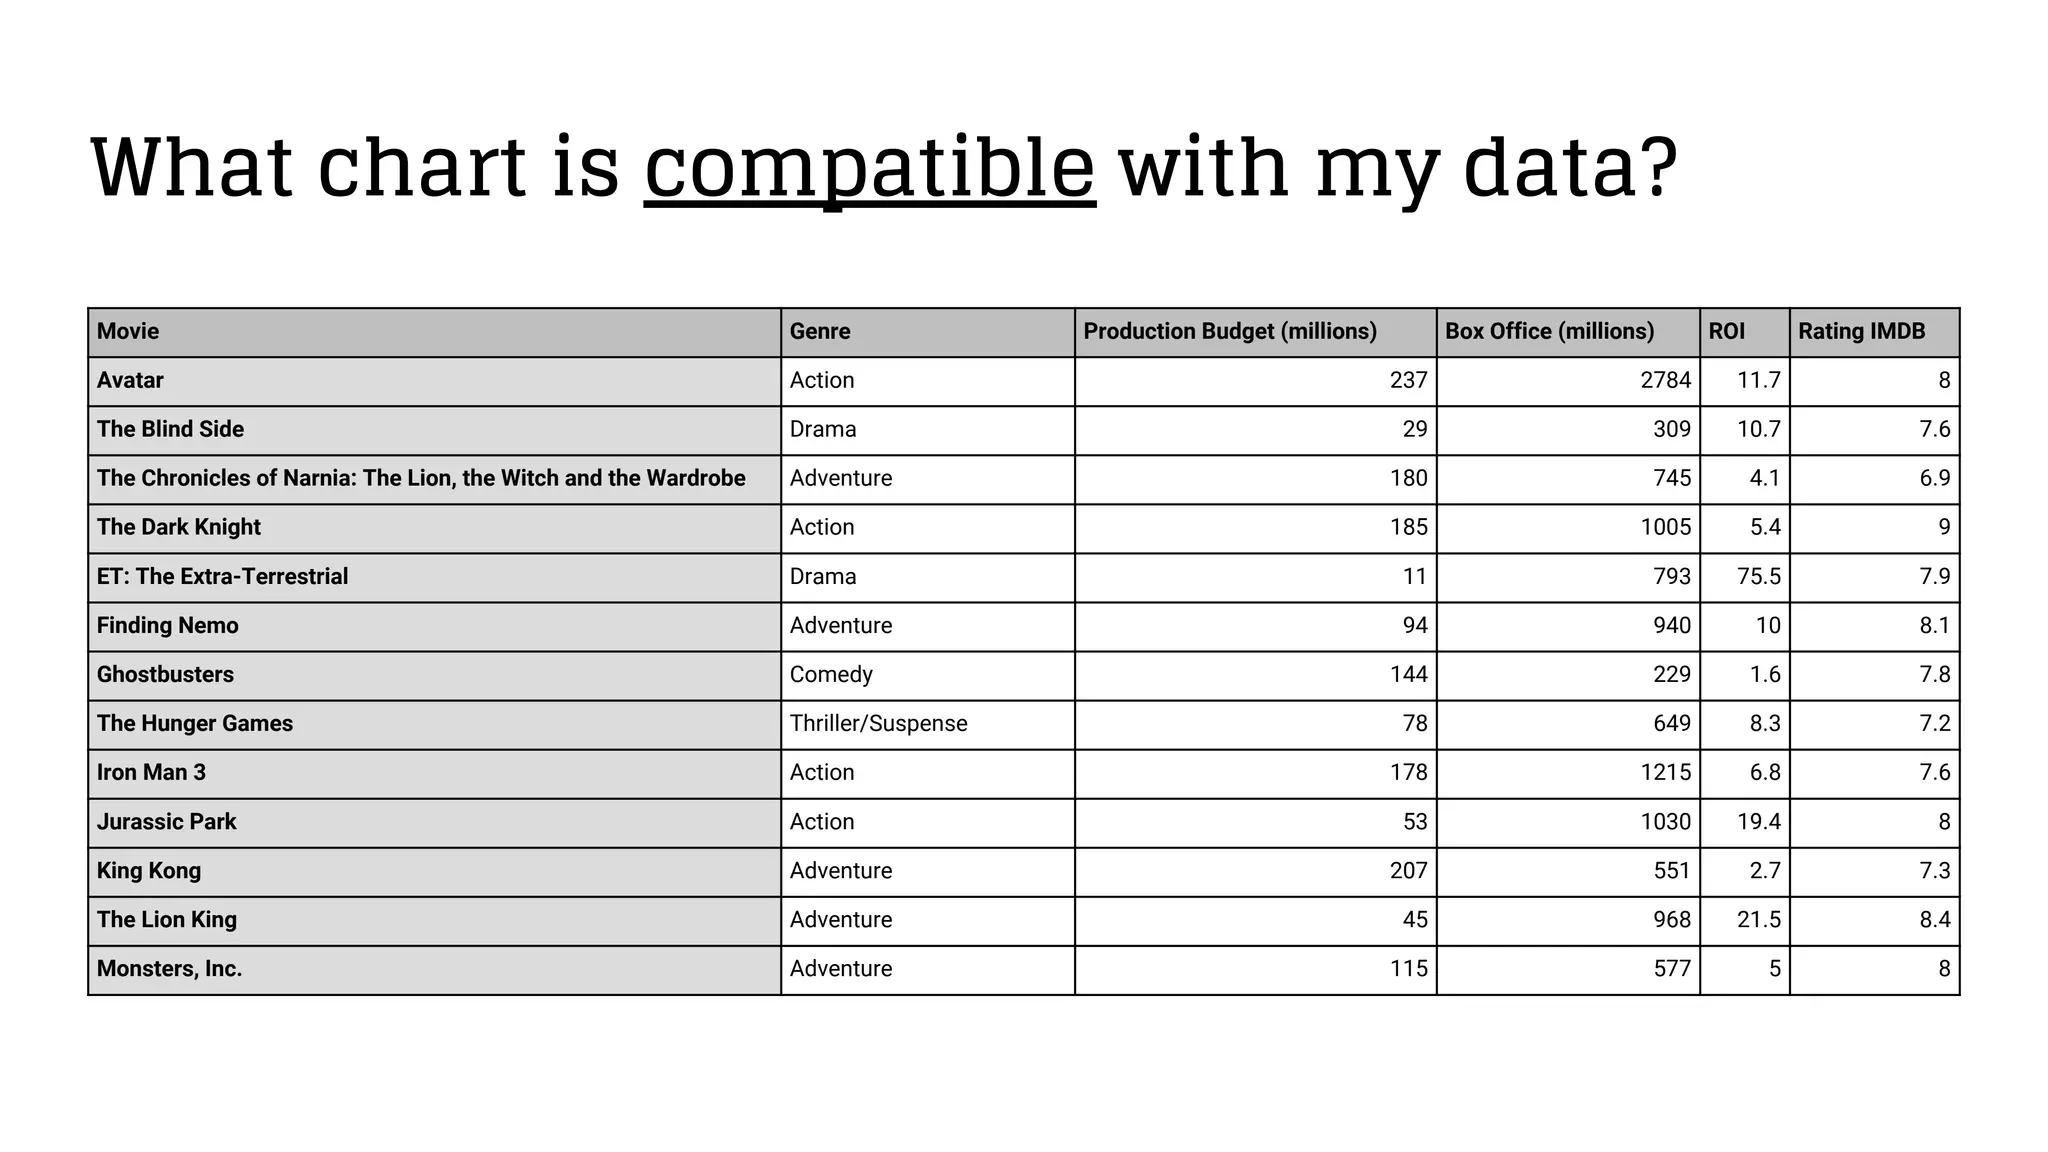
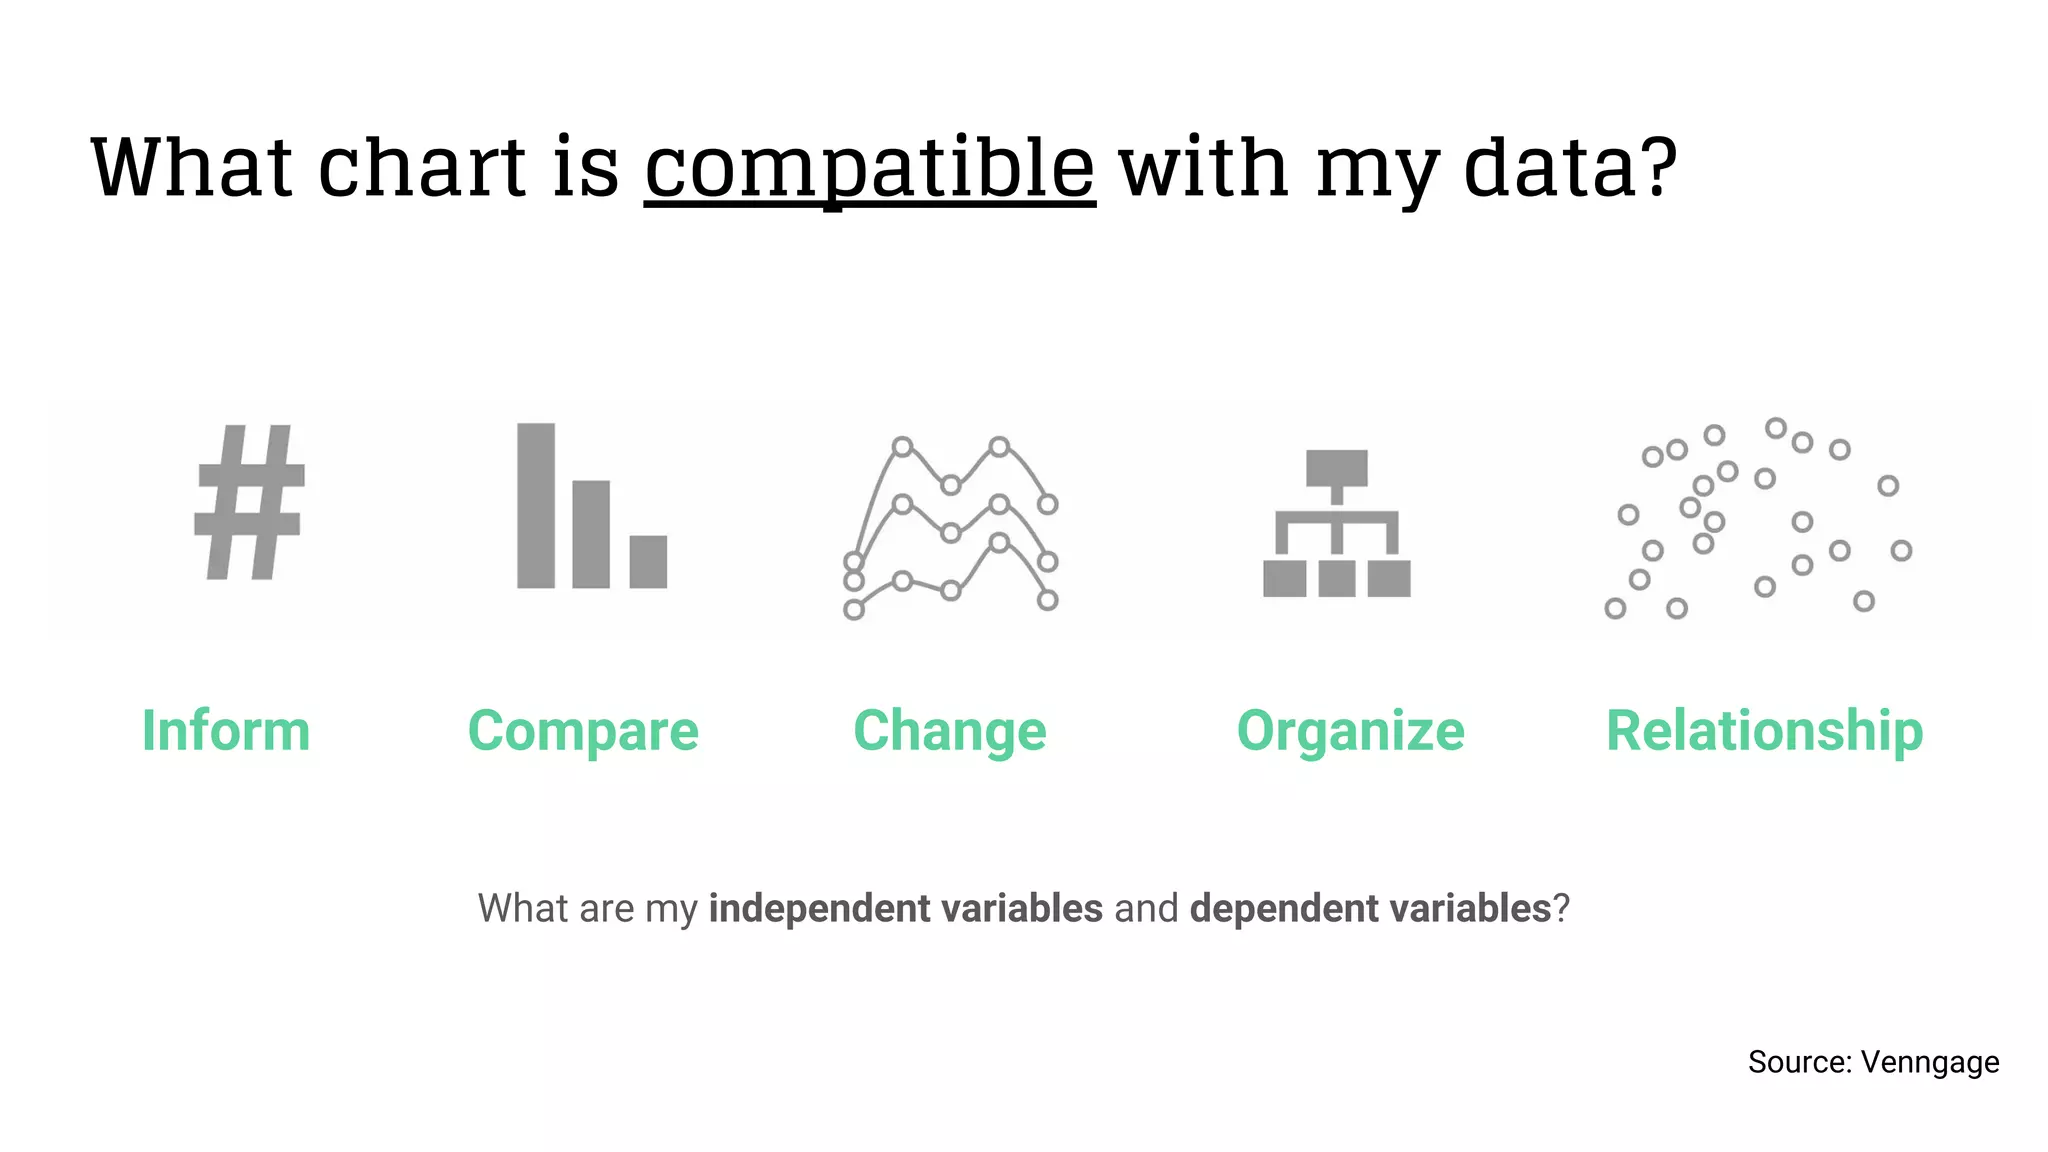
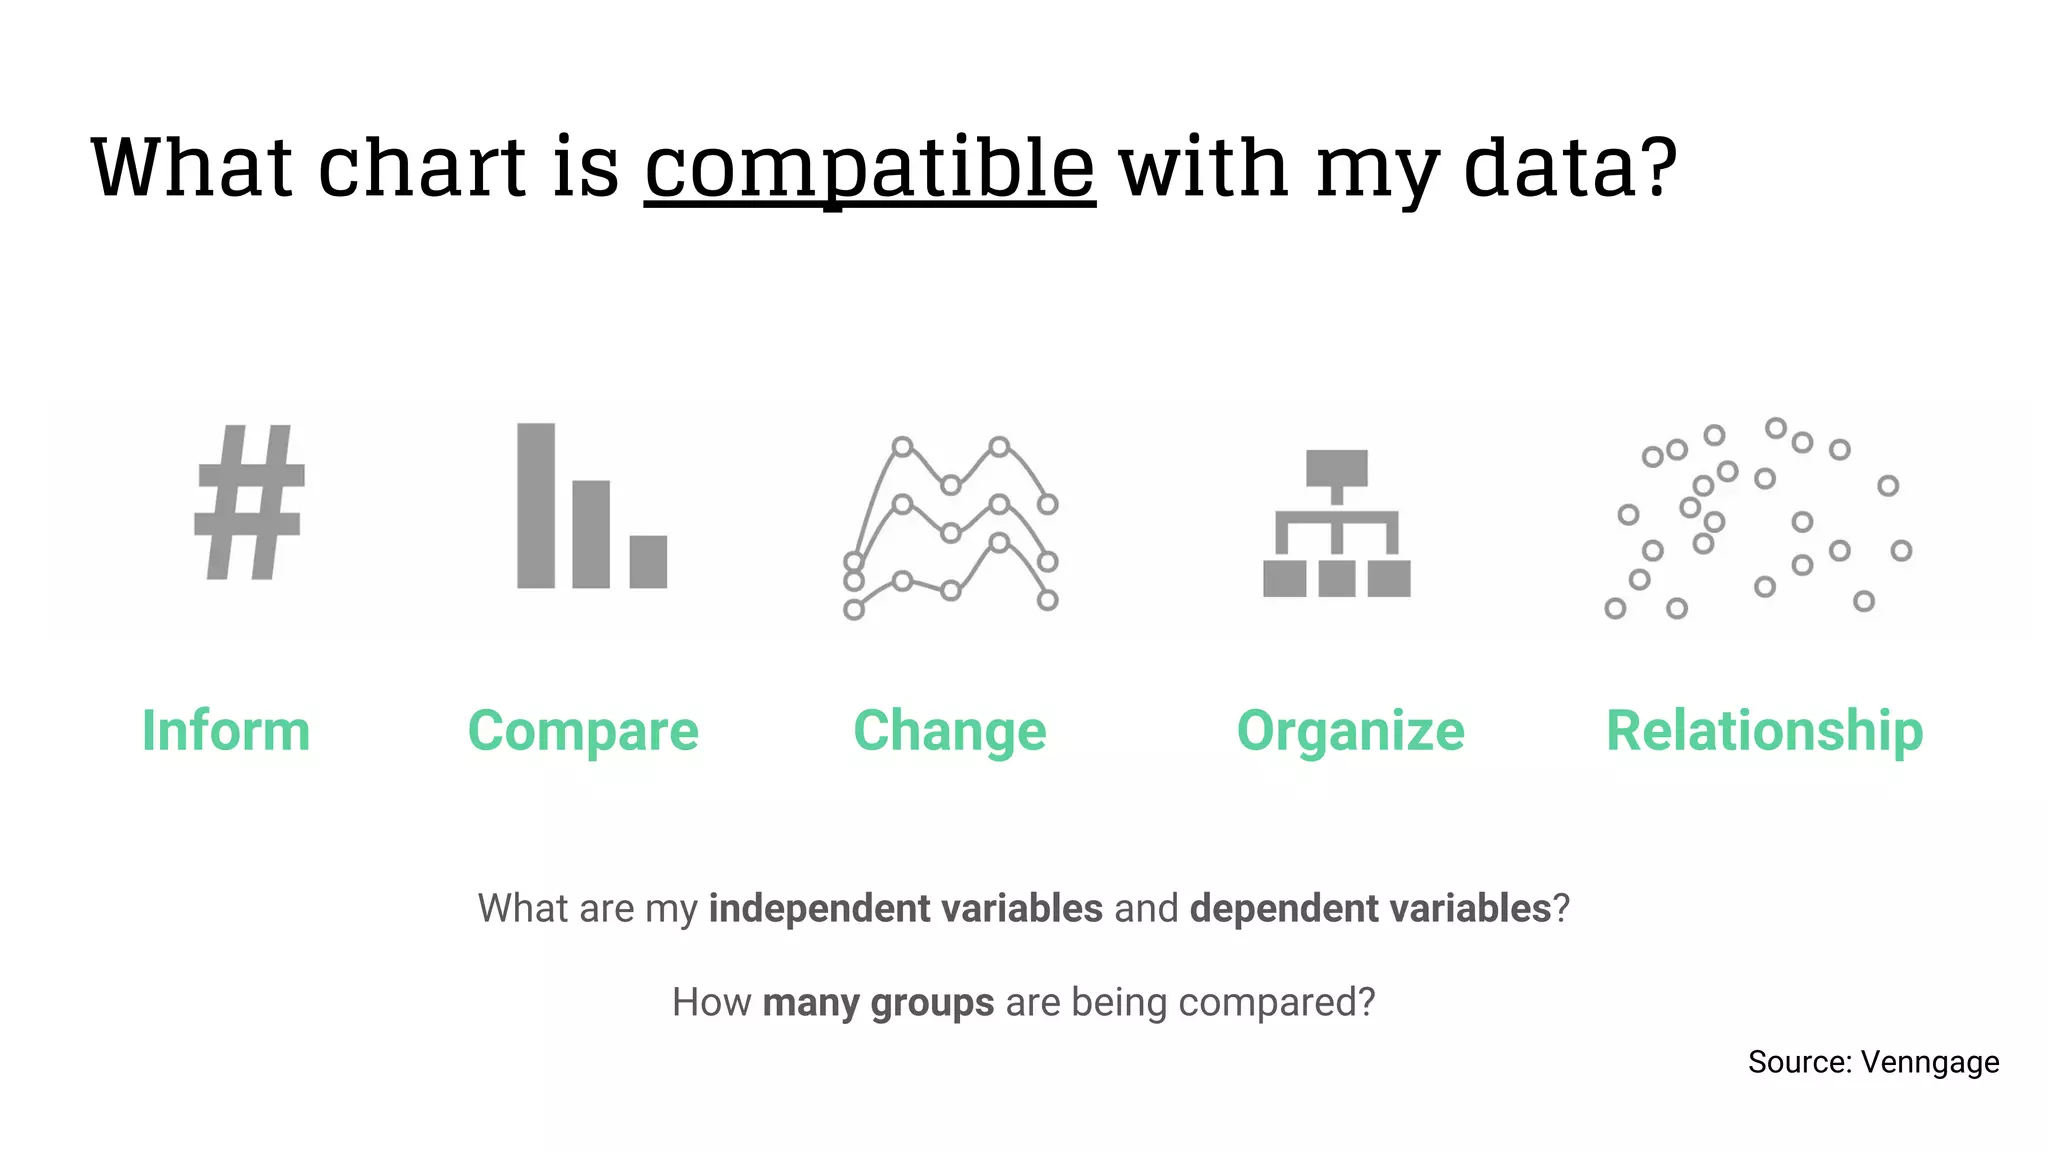
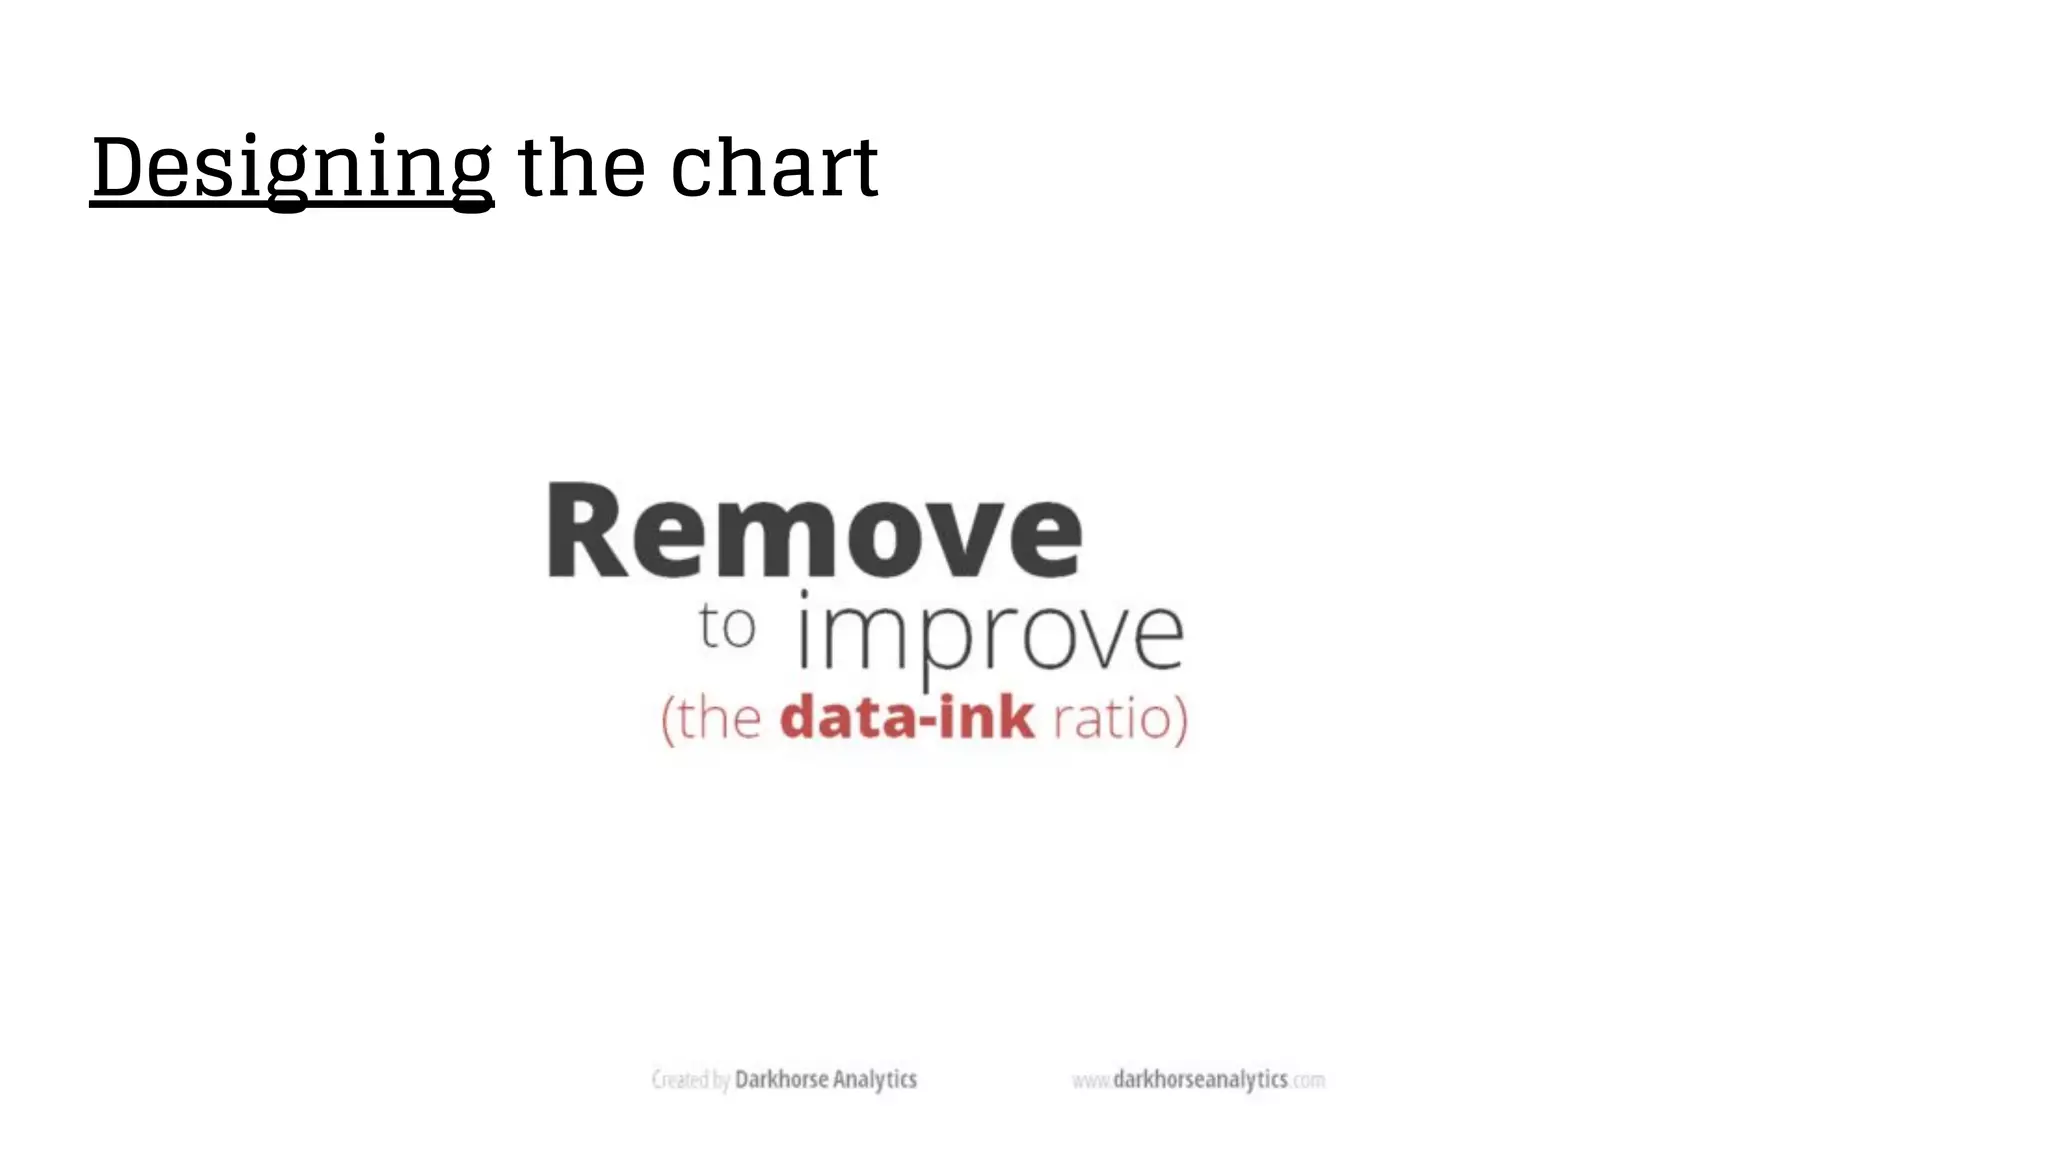
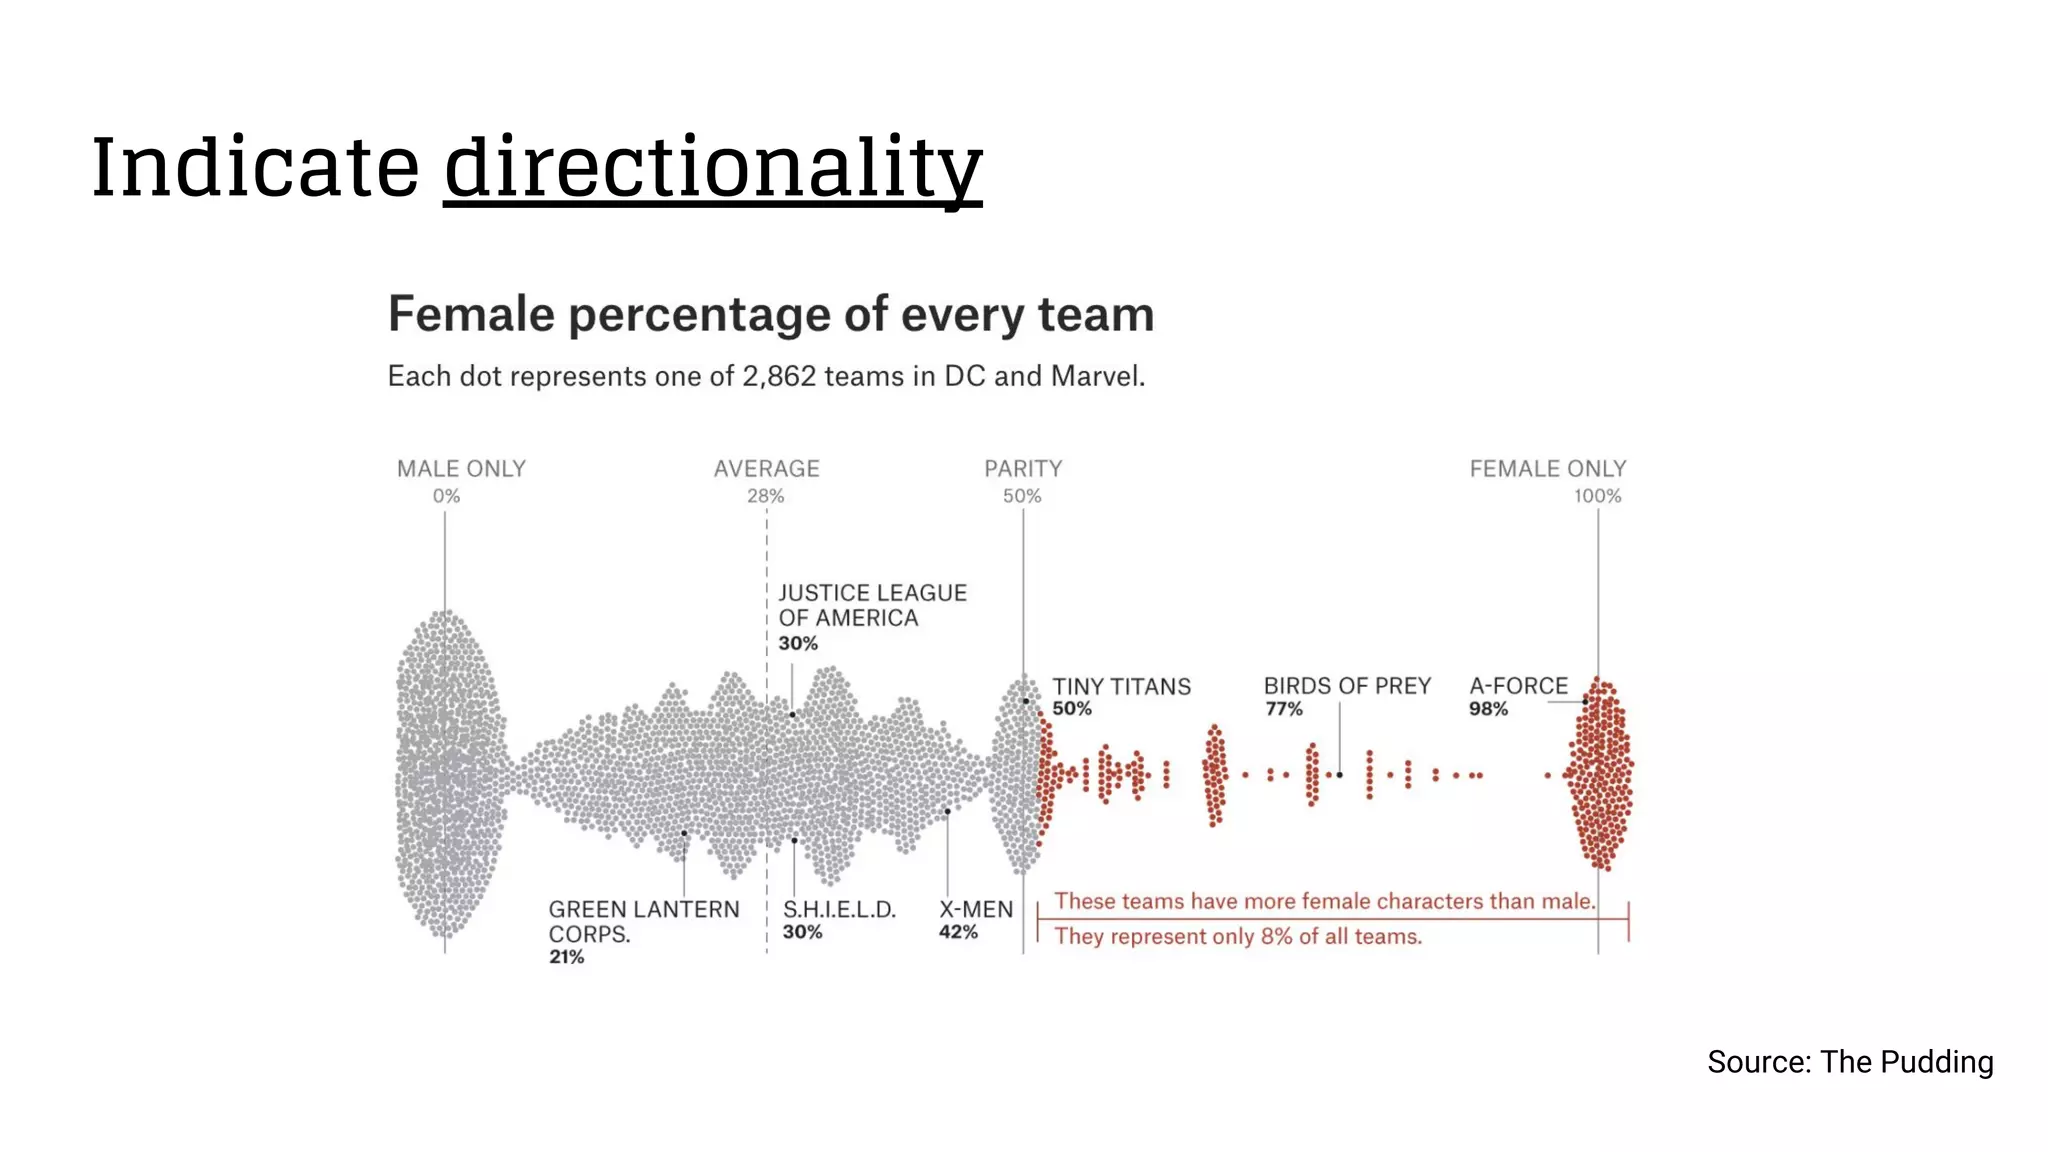
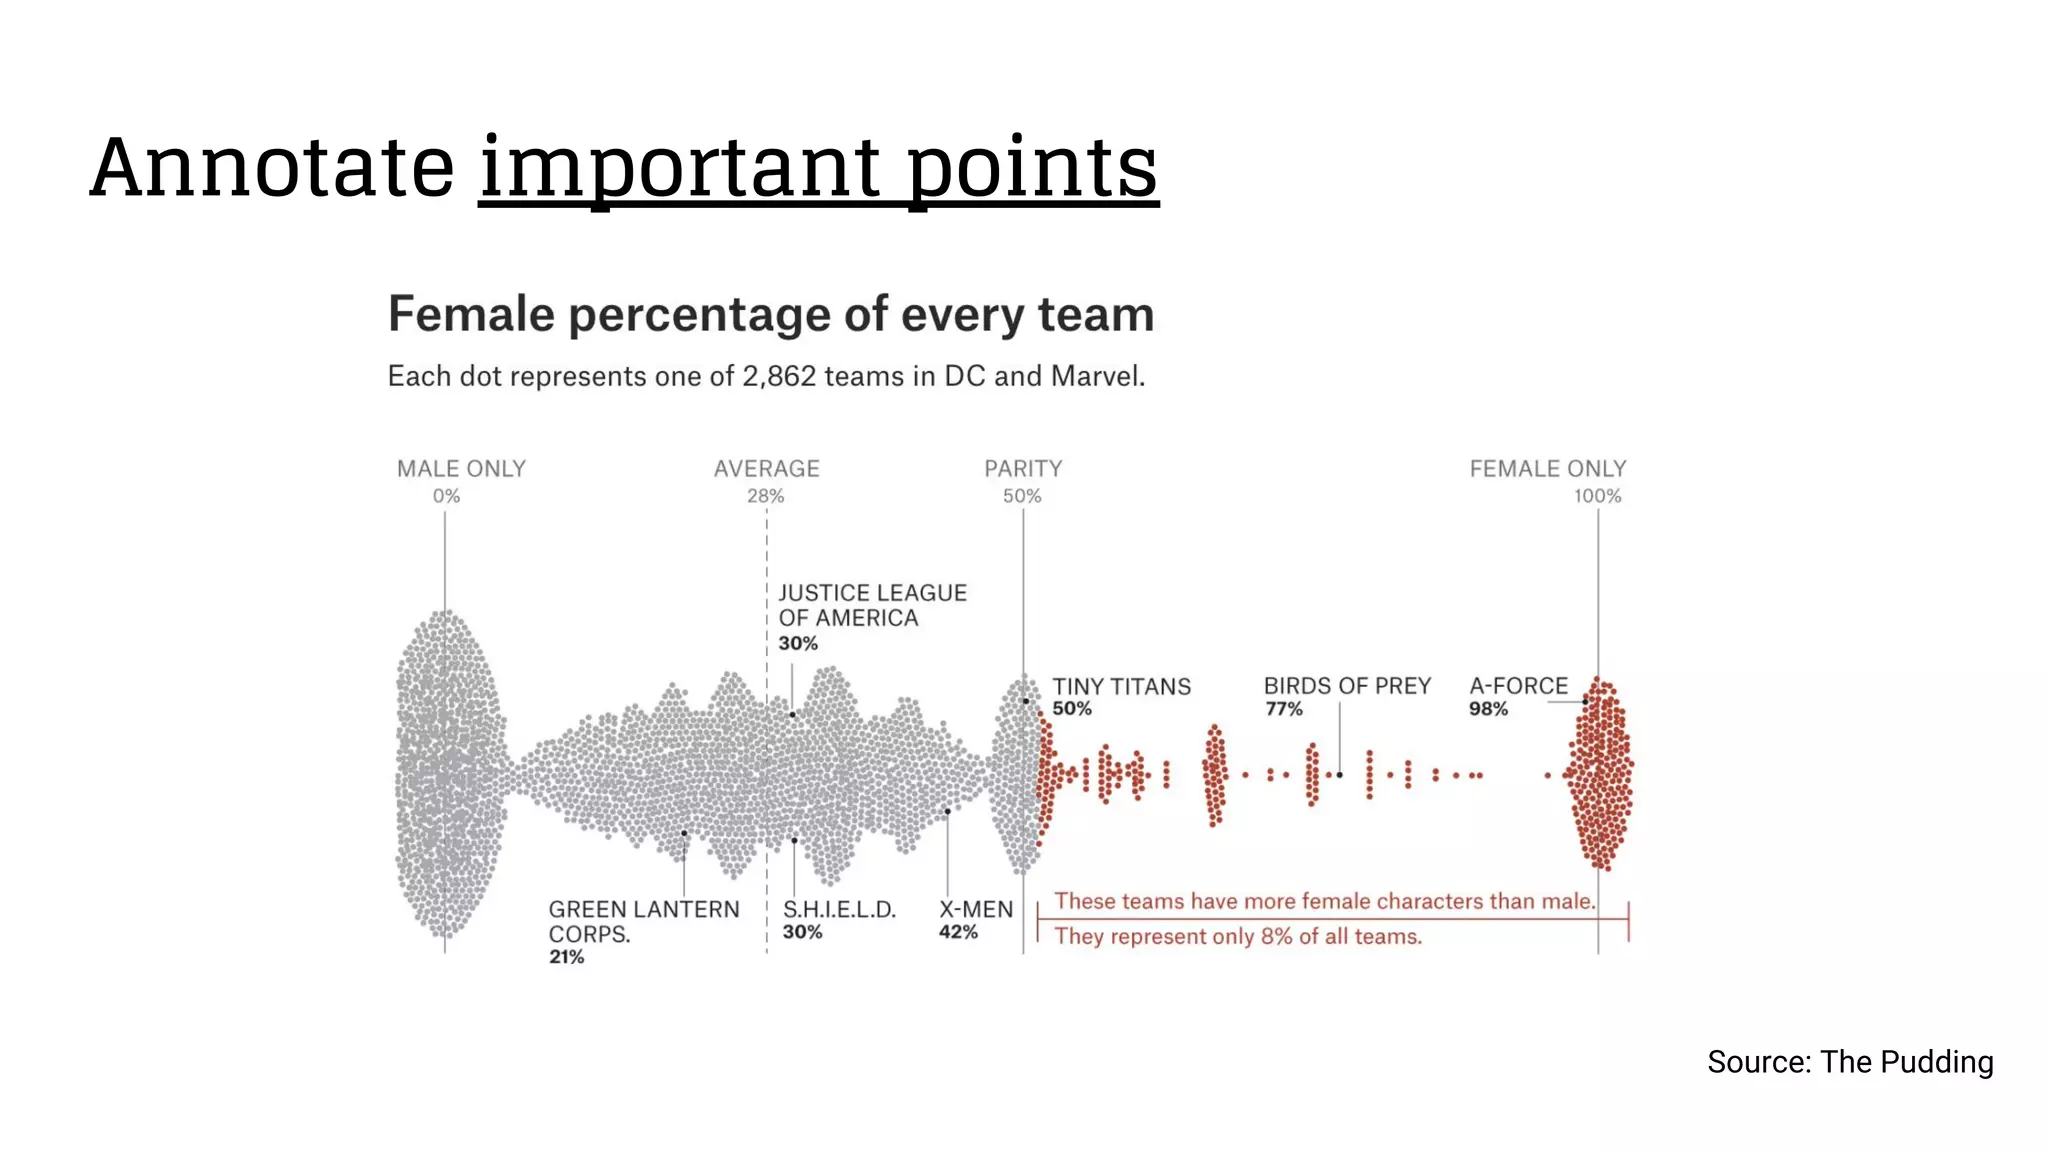
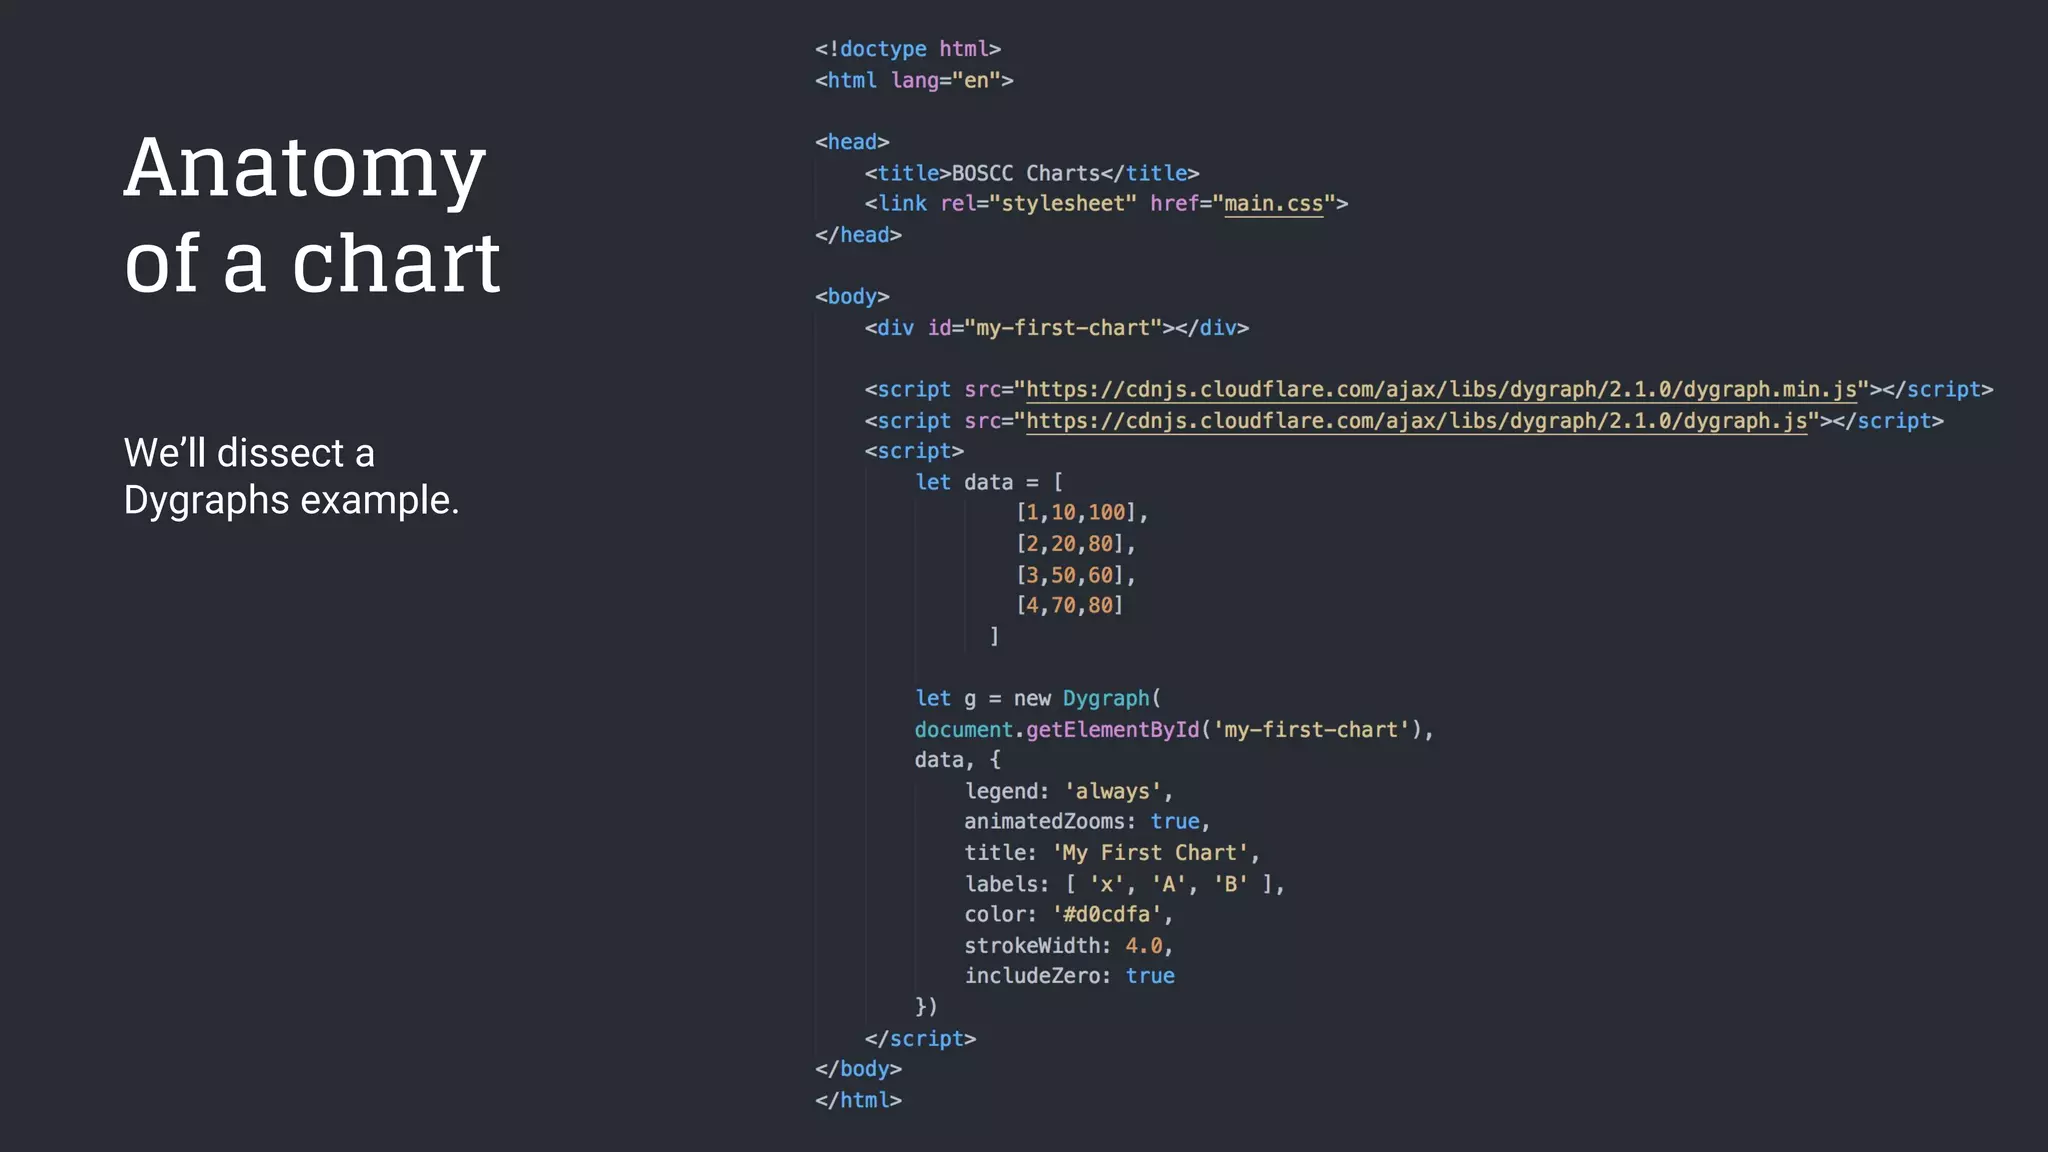
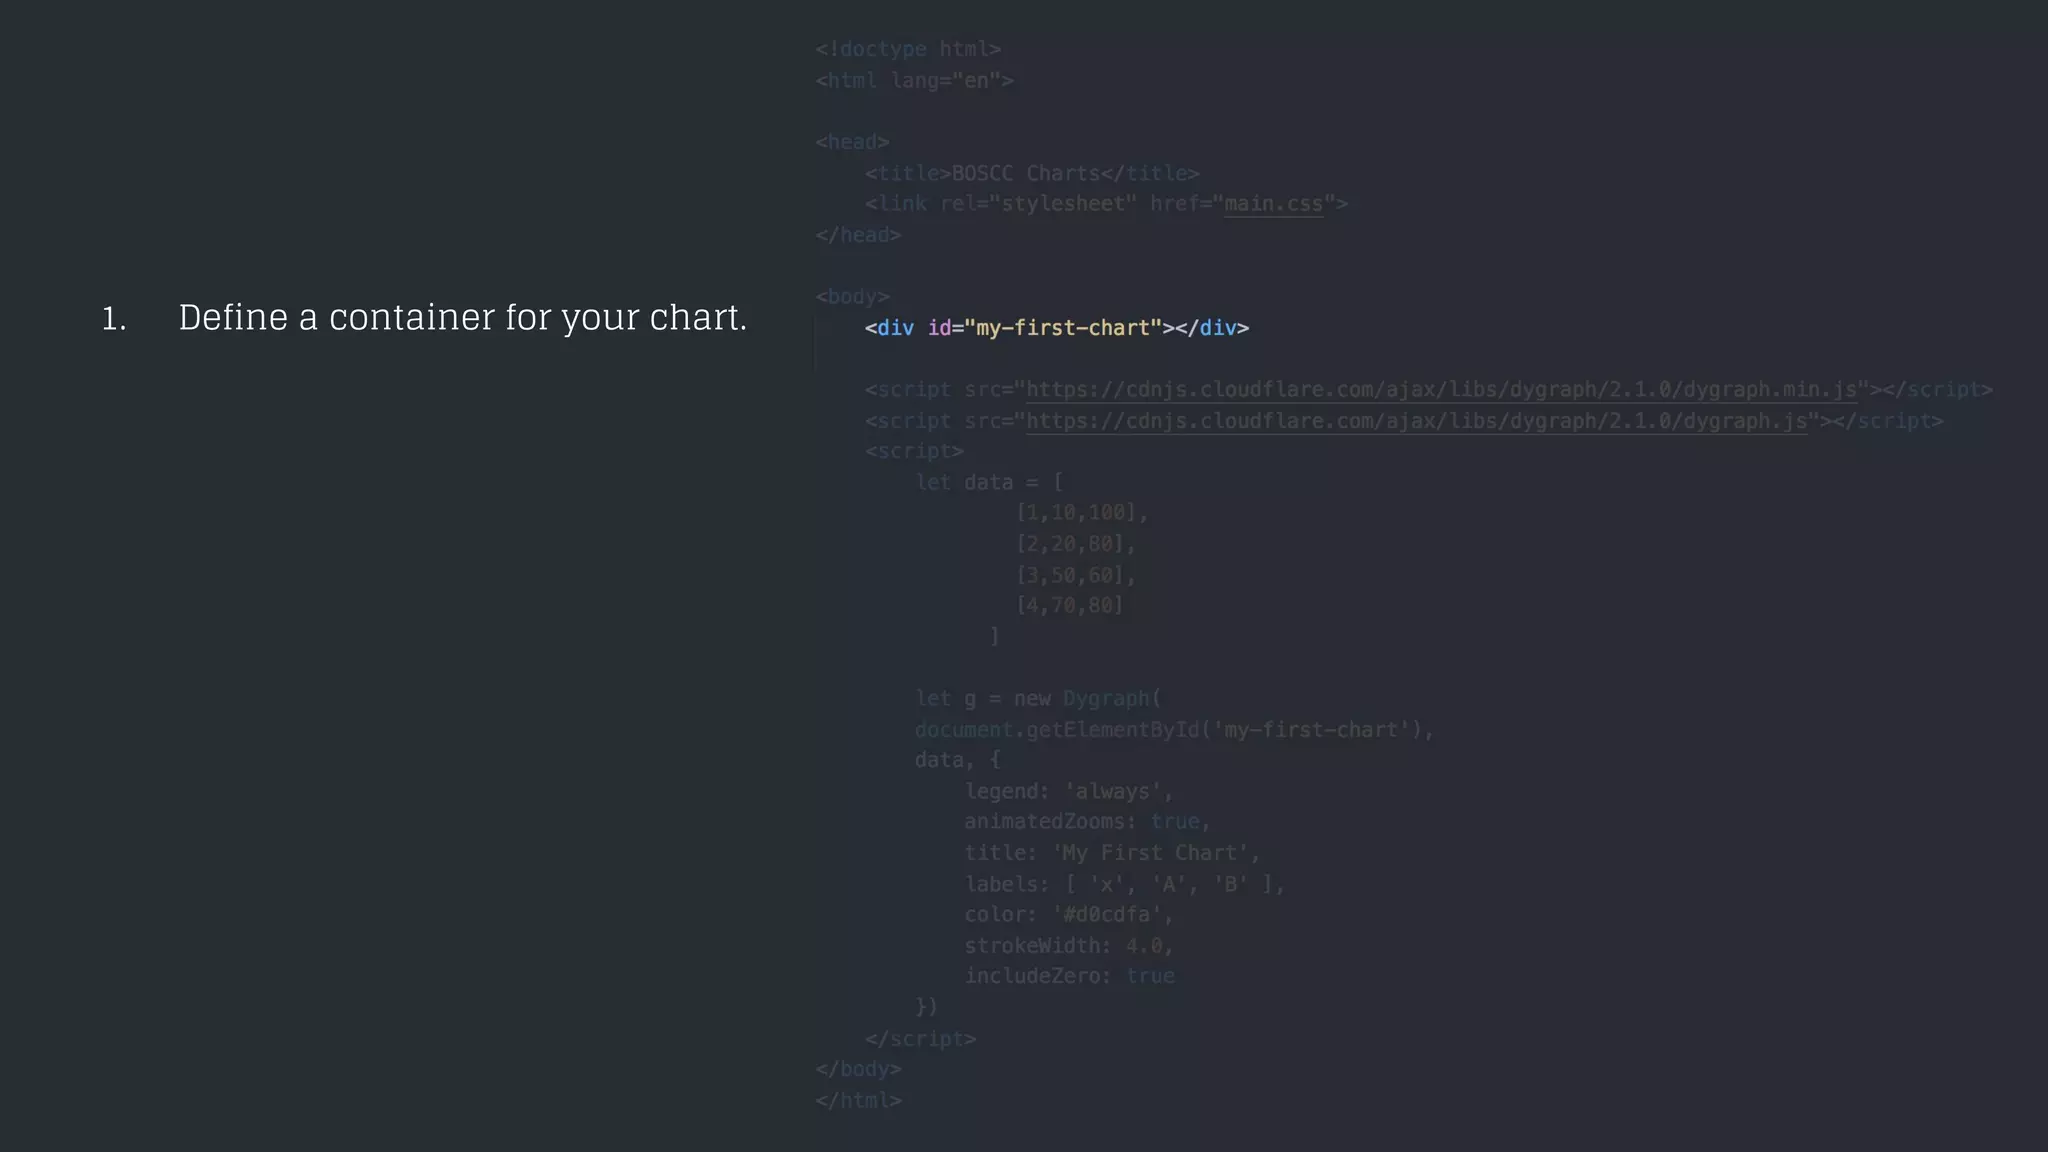
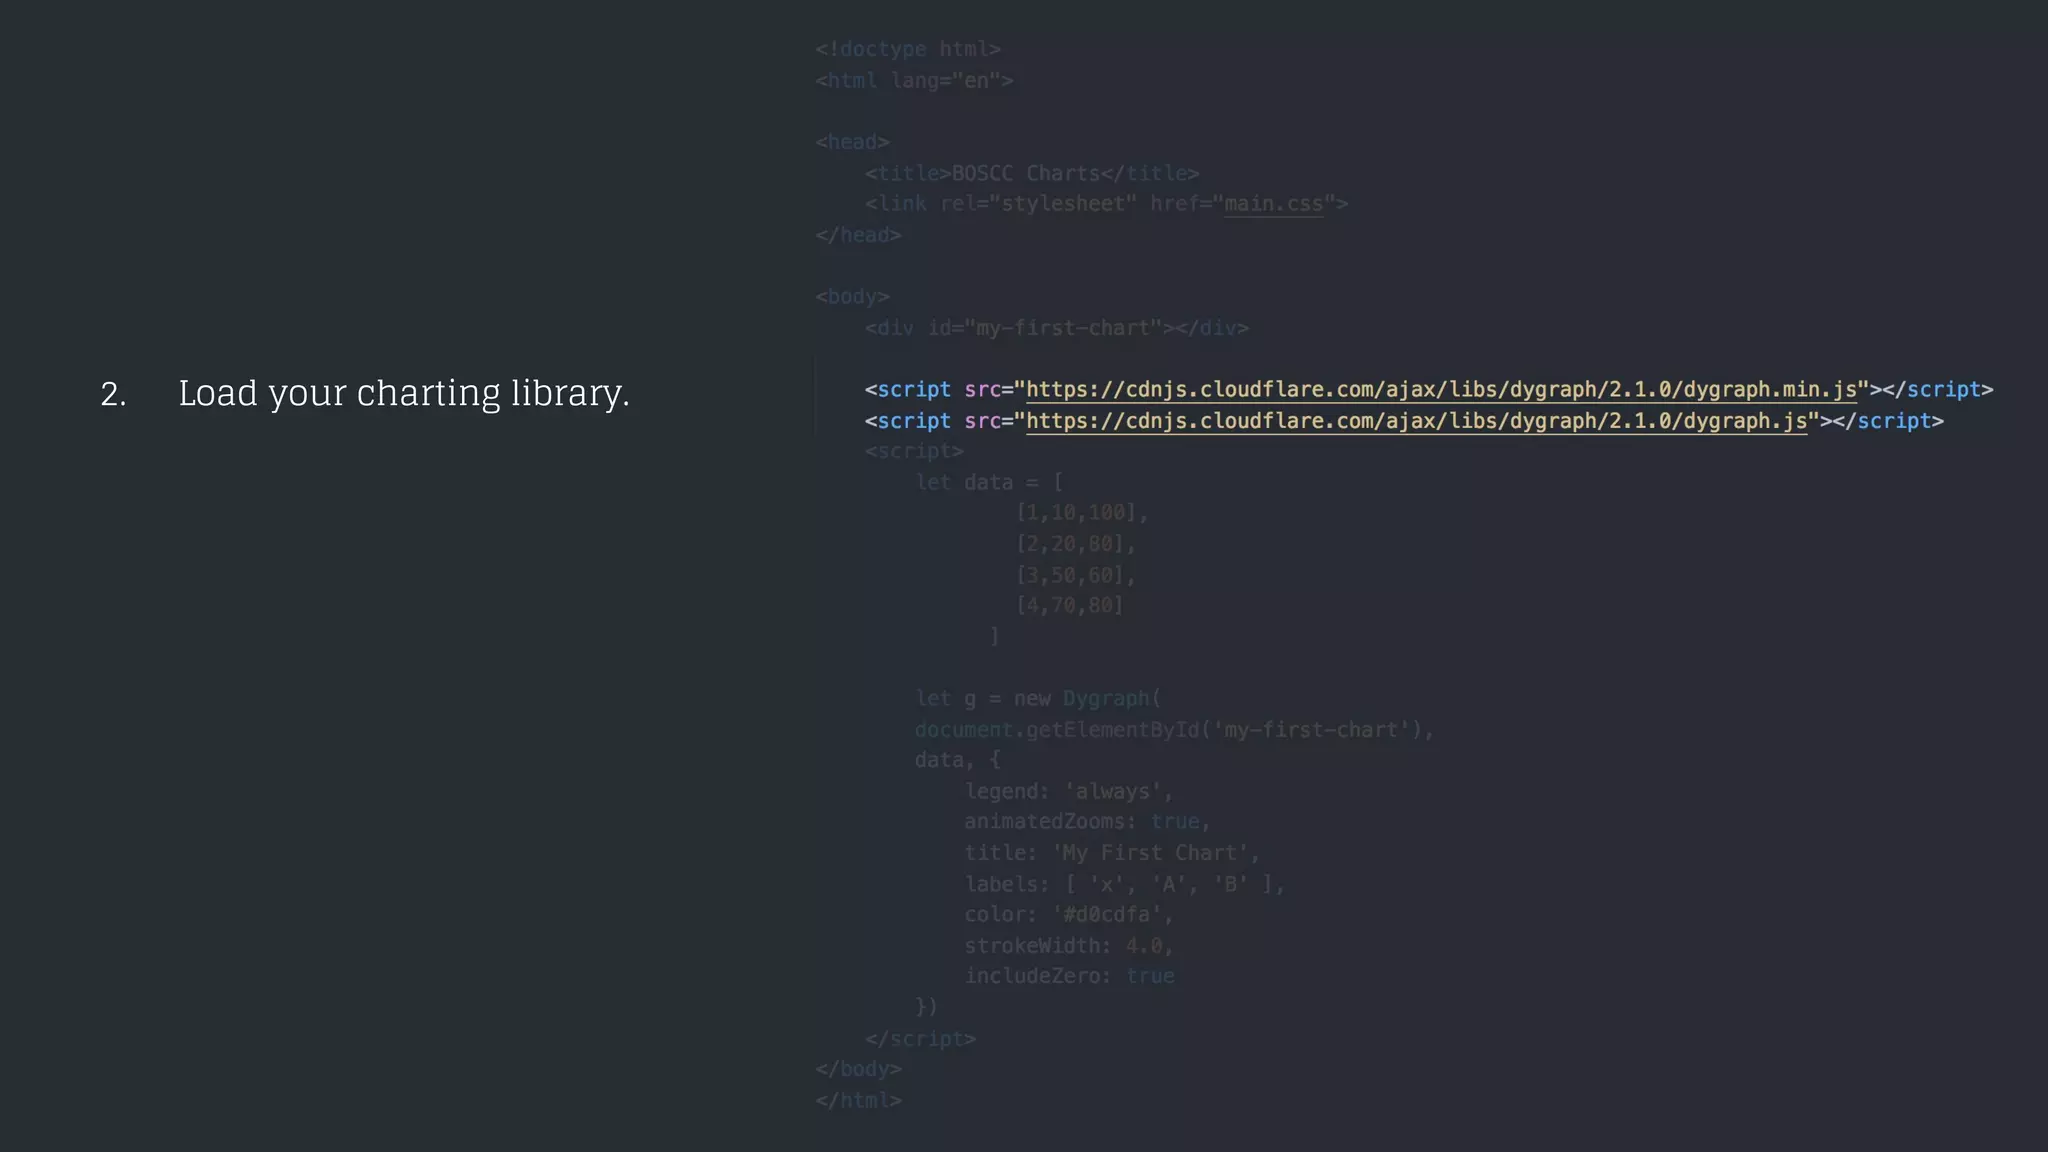
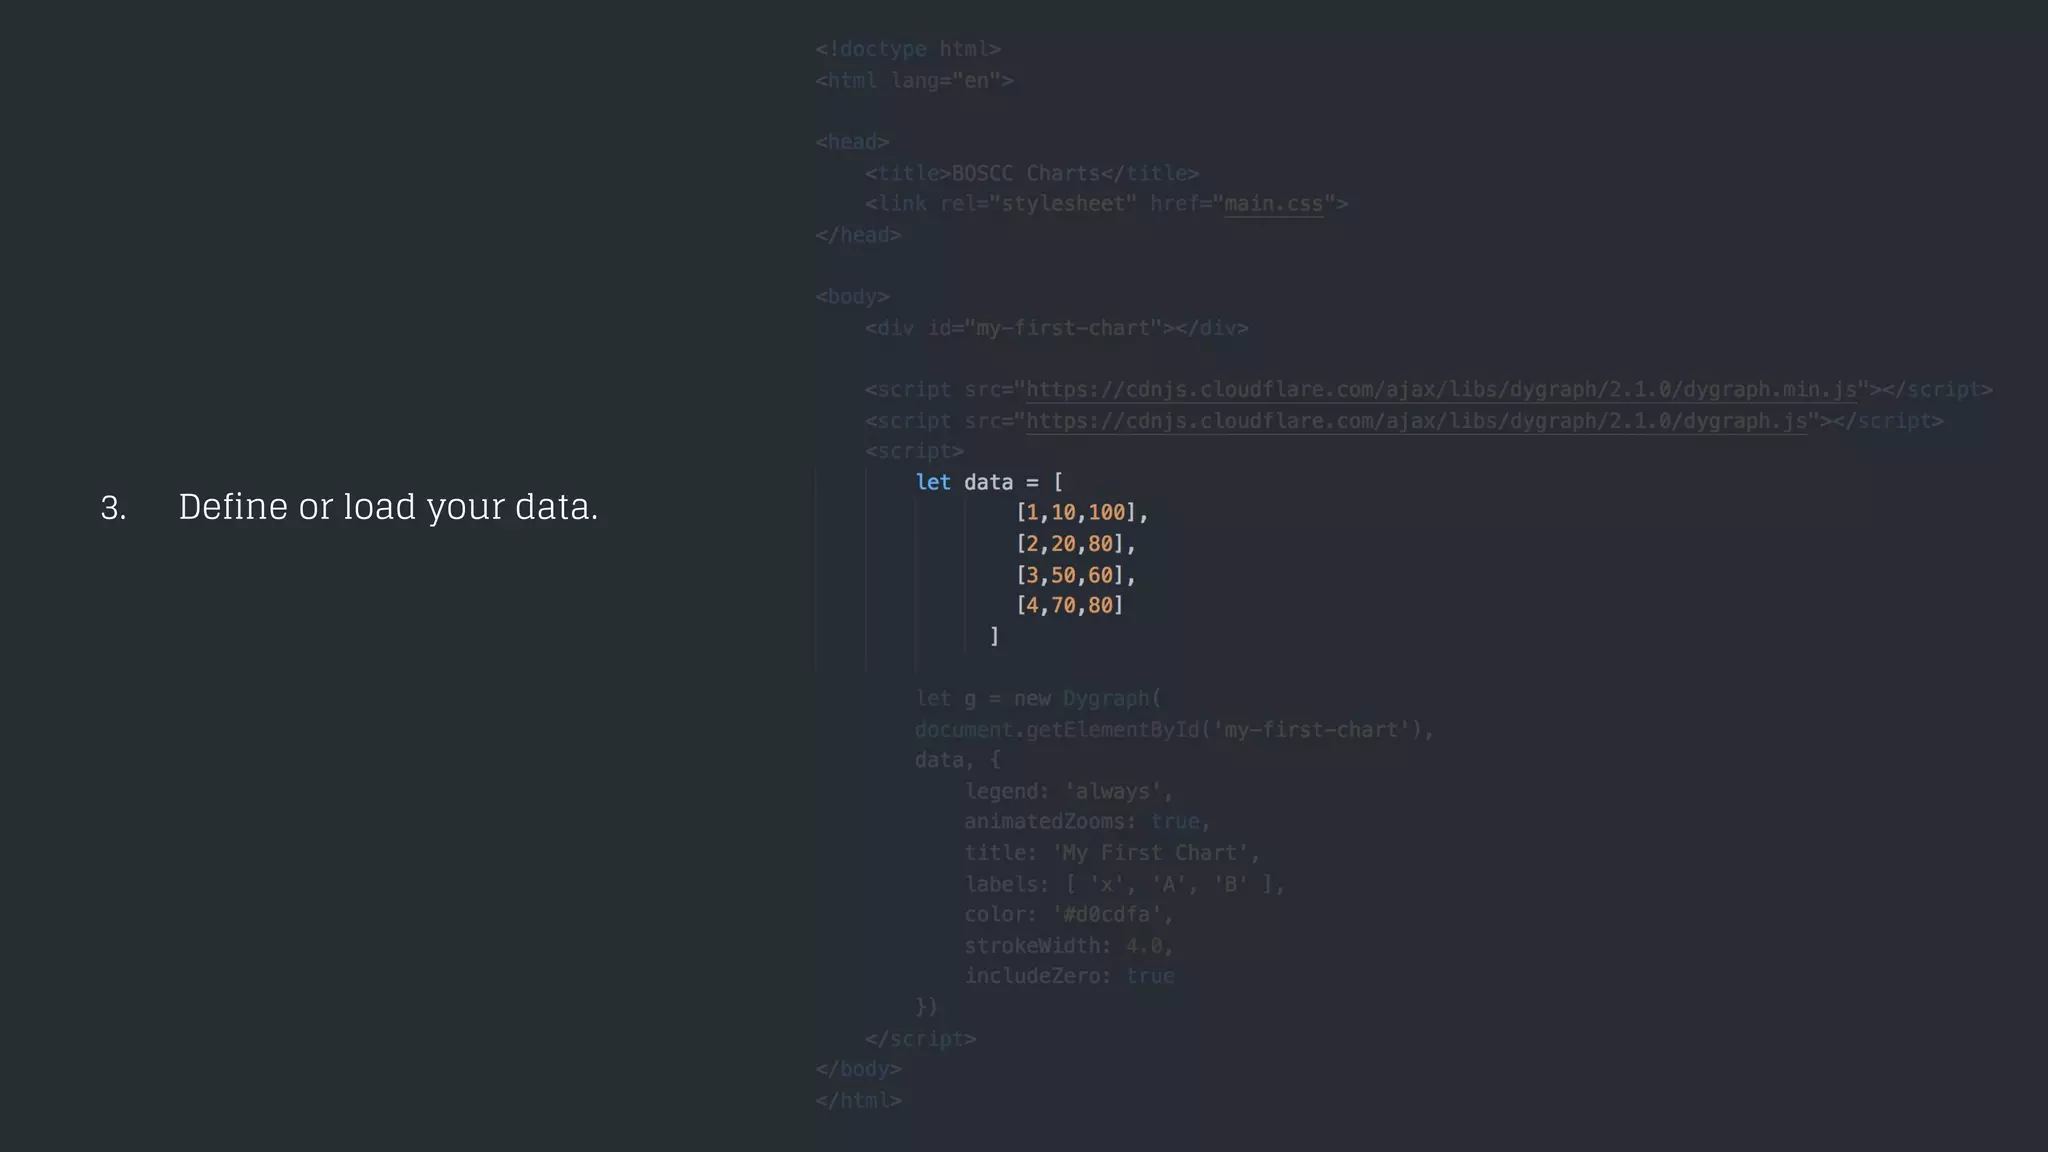
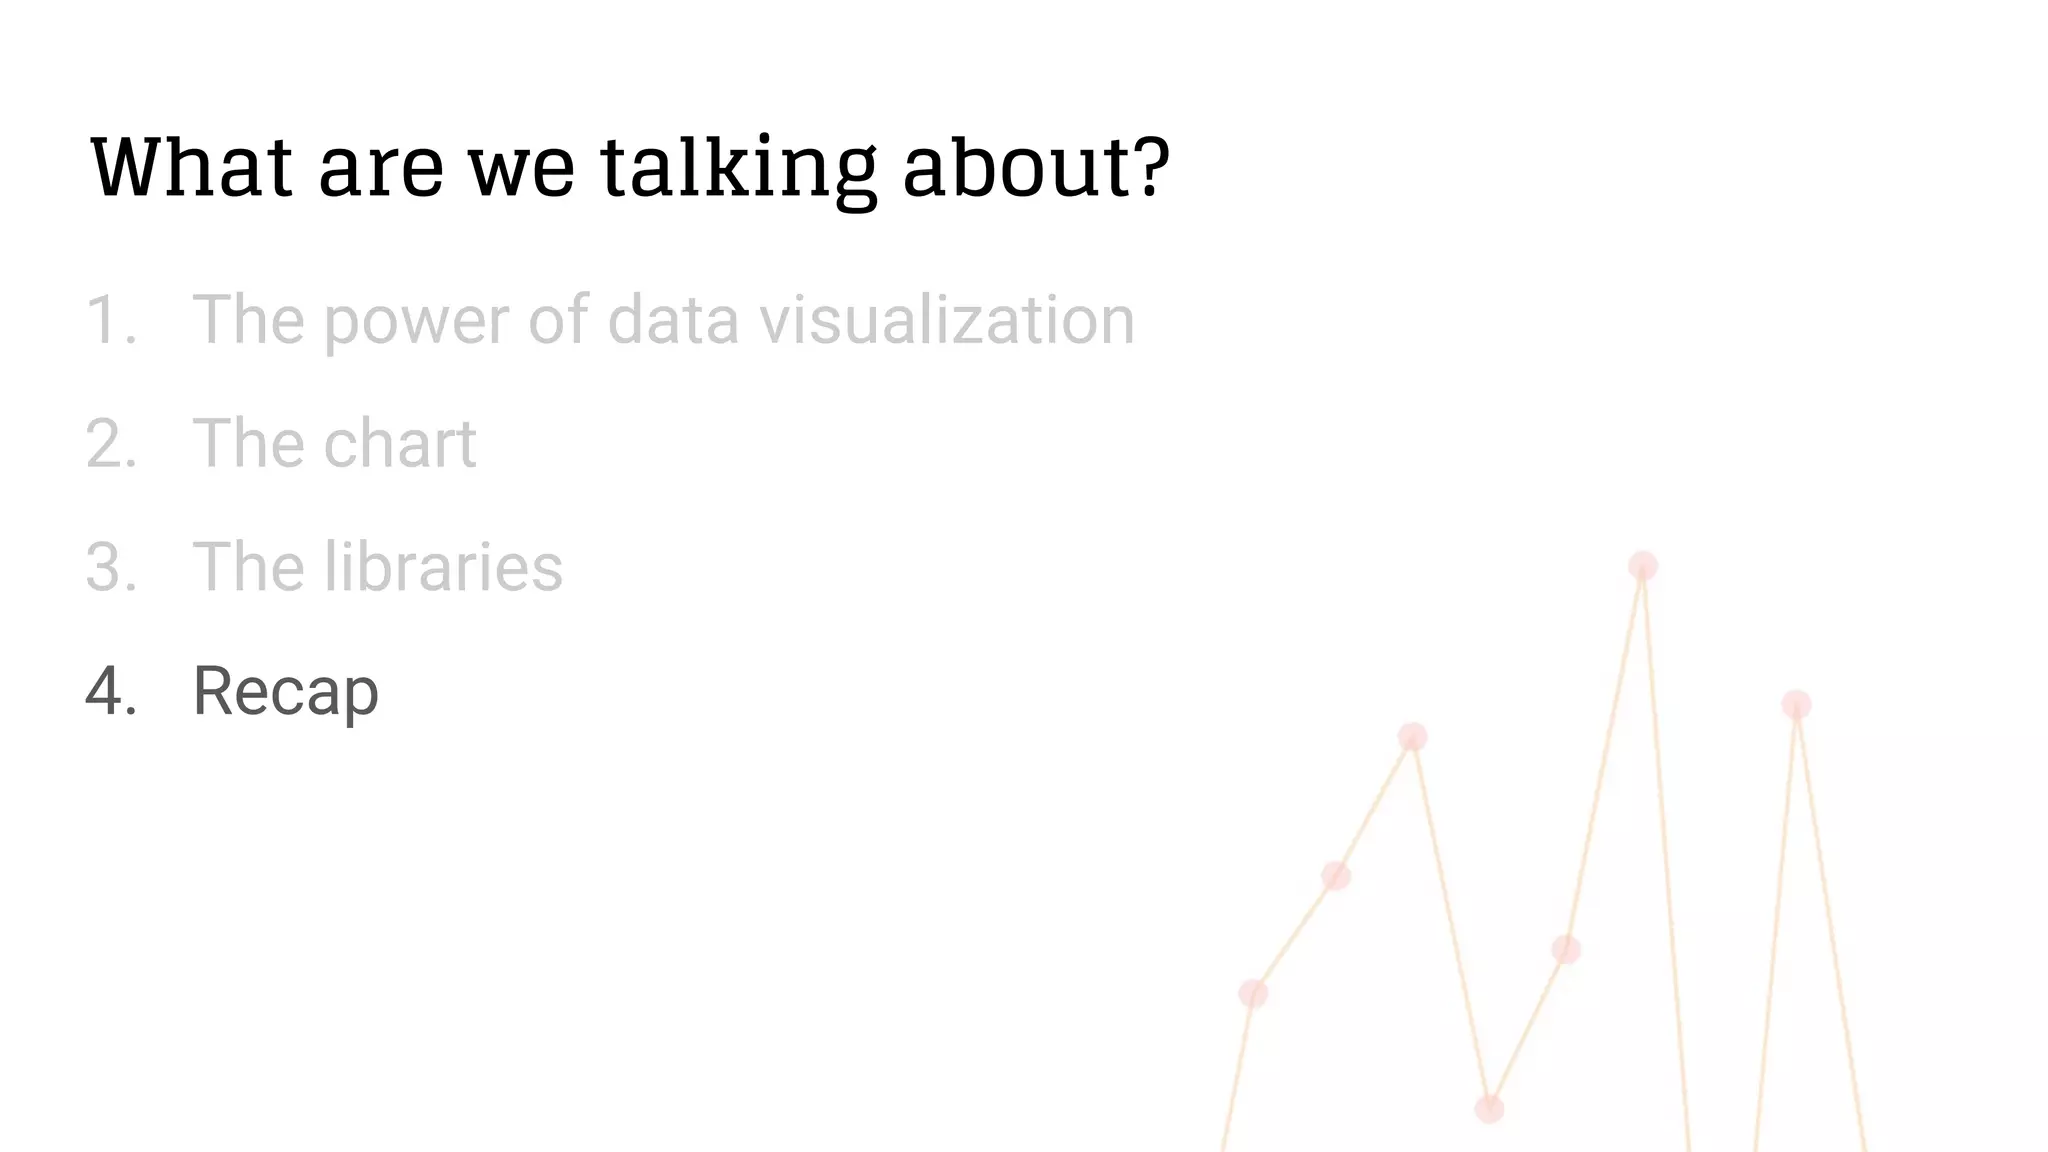
3. The recap emphasizes defining the chart purpose, choosing a chart type based on data, designing the chart, selecting a library, and iterating the process to effectively communicate with data visualization.


![UiPath Automation Suite Installation (Hands-On) [2/3]](https://cdn.slidesharecdn.com/ss_thumbnails/automationsuitecommunitysession2-251015095633-a6d862f1-thumbnail.jpg?width=600ounds&width=560&fit=bounds)


