How to measure frequency and duty cycle using arduino
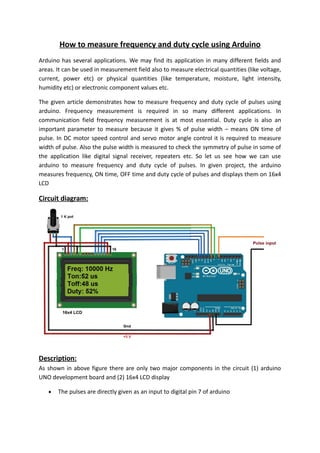
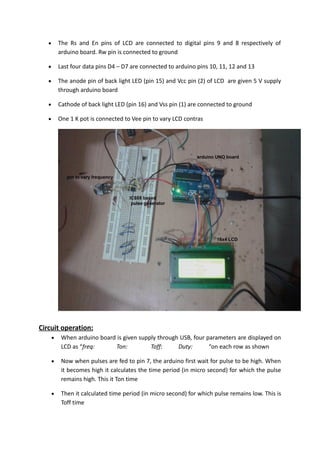
The document explains how to measure frequency and duty cycle using an Arduino, detailing its applications in various fields like communication and motor control. It describes a project that uses an Arduino UNO and a 16x4 LCD to display the frequency, on time, off time, and duty cycle of input pulses. The operation involves calculating these parameters based on pulse timings and updating the LCD every second.
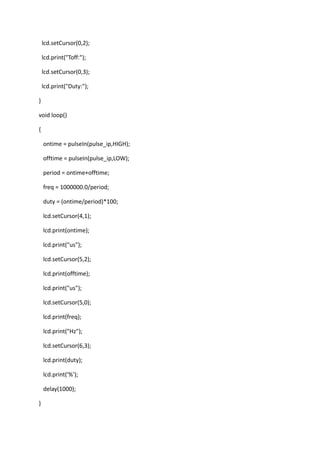
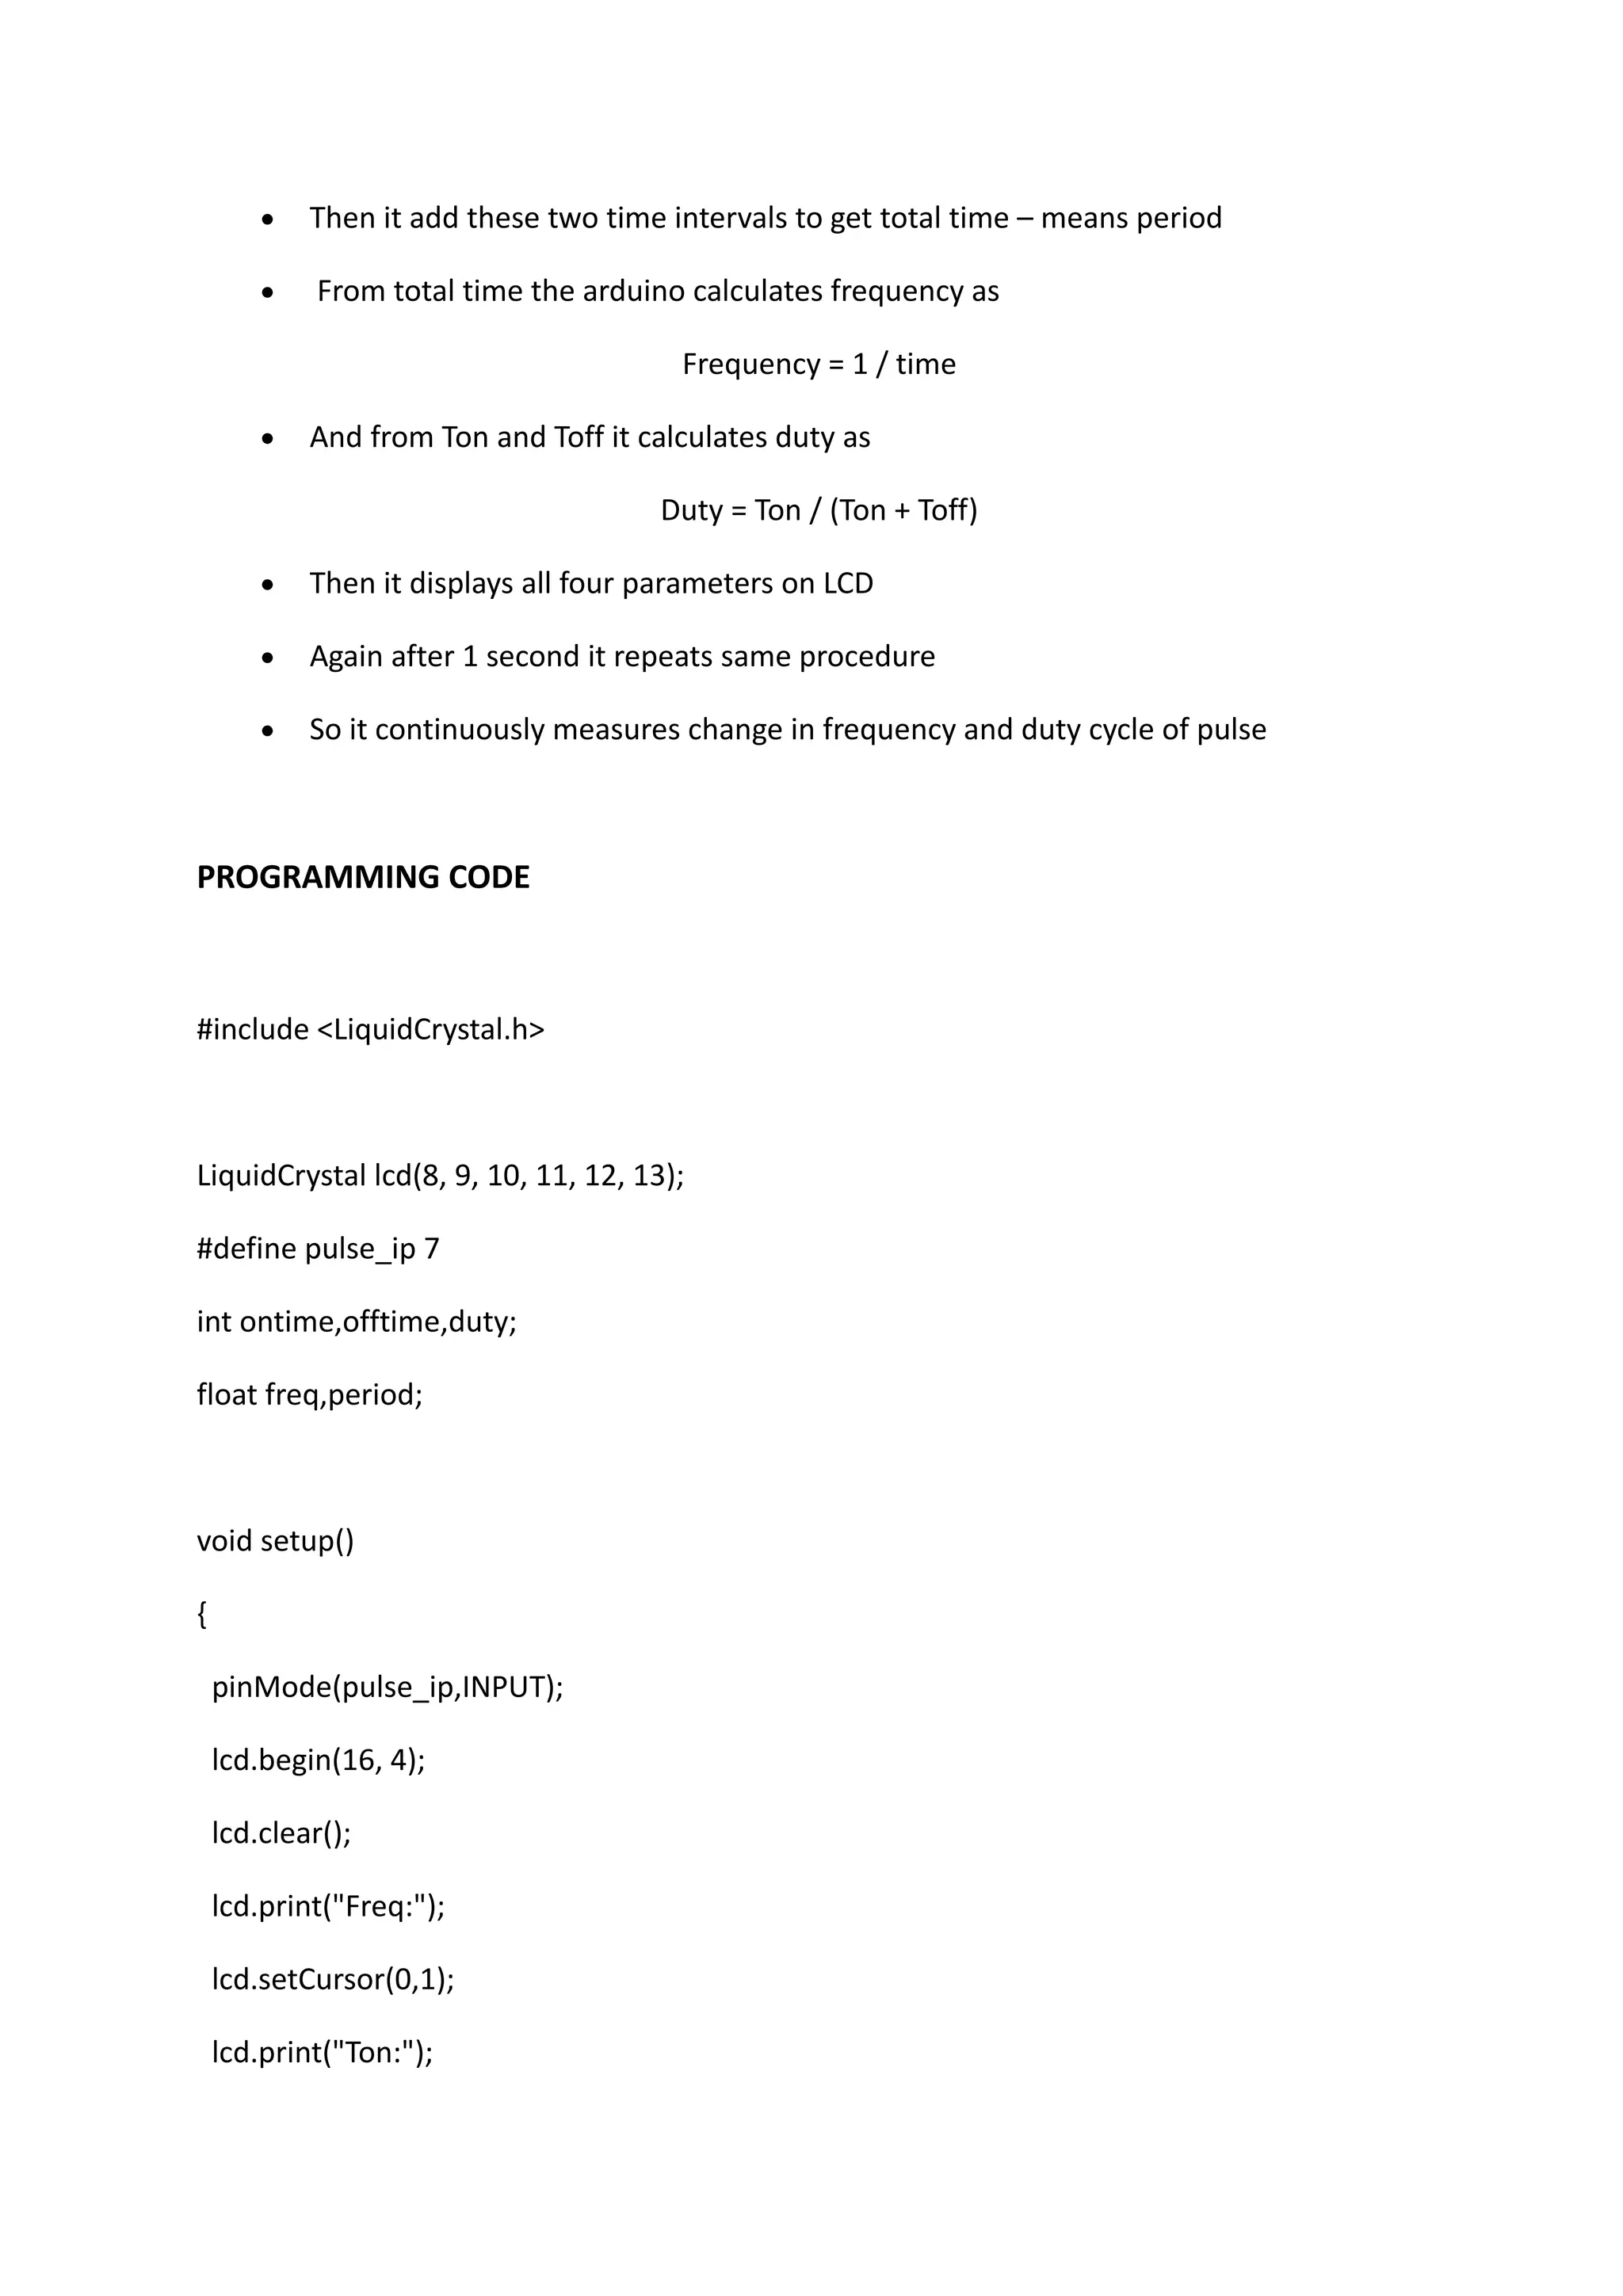
How to measure frequency and duty cycle using arduino
1.
How to measurefrequency and duty cycle using Arduino
Arduino has several applications. We may find its application in many different fields and
areas. It can be used in measurement field also to measure electrical quantities (like voltage,
current, power etc) or physical quantities (like temperature, moisture, light intensity,
humidity etc) or electronic component values etc.
The given article demonstrates how to measure frequency and duty cycle of pulses using
arduino. Frequency measurement is required in so many different applications. In
communication field frequency measurement is at most essential. Duty cycle is also an
important parameter to measure because it gives % of pulse width – means ON time of
pulse. In DC motor speed control and servo motor angle control it is required to measure
width of pulse. Also the pulse width is measured to check the symmetry of pulse in some of
the application like digital signal receiver, repeaters etc. So let us see how we can use
arduino to measure frequency and duty cycle of pulses. In given project, the arduino
measures frequency, ON time, OFF time and duty cycle of pulses and displays them on 16x4
LCD
Circuit diagram:
Description:
As shown in above figure there are only two major components in the circuit (1) arduino
UNO development board and (2) 16x4 LCD display
The pulses are directly given as an input to digital pin 7 of arduino
2.
The Rsand En pins of LCD are connected to digital pins 9 and 8 respectively of
arduino board. Rw pin is connected to ground
Last four data pins D4 – D7 are connected to arduino pins 10, 11, 12 and 13
The anode pin of back light LED (pin 15) and Vcc pin (2) of LCD are given 5 V supply
through arduino board
Cathode of back light LED (pin 16) and Vss pin (1) are connected to ground
One 1 K pot is connected to Vee pin to vary LCD contras
Circuit operation:
When arduino board is given supply through USB, four parameters are displayed on
LCD as “freq: Ton: Toff: Duty: “on each row as shown
Now when pulses are fed to pin 7, the arduino first wait for pulse to be high. When
it becomes high it calculates the time period (in micro second) for which the pulse
remains high. This it Ton time
Then it calculated time period (in micro second) for which pulse remains low. This is
Toff time
3.
Then itadd these two time intervals to get total time – means period
From total time the arduino calculates frequency as
Frequency = 1 / time
And from Ton and Toff it calculates duty as
Duty = Ton / (Ton + Toff)
Then it displays all four parameters on LCD
Again after 1 second it repeats same procedure
So it continuously measures change in frequency and duty cycle of pulse
PROGRAMMING CODE
#include <LiquidCrystal.h>
LiquidCrystal lcd(8, 9, 10, 11, 12, 13);
#define pulse_ip 7
int ontime,offtime,duty;
float freq,period;
void setup()
{
pinMode(pulse_ip,INPUT);
lcd.begin(16, 4);
lcd.clear();
lcd.print("Freq:");
lcd.setCursor(0,1);
lcd.print("Ton:");