Download to read offline


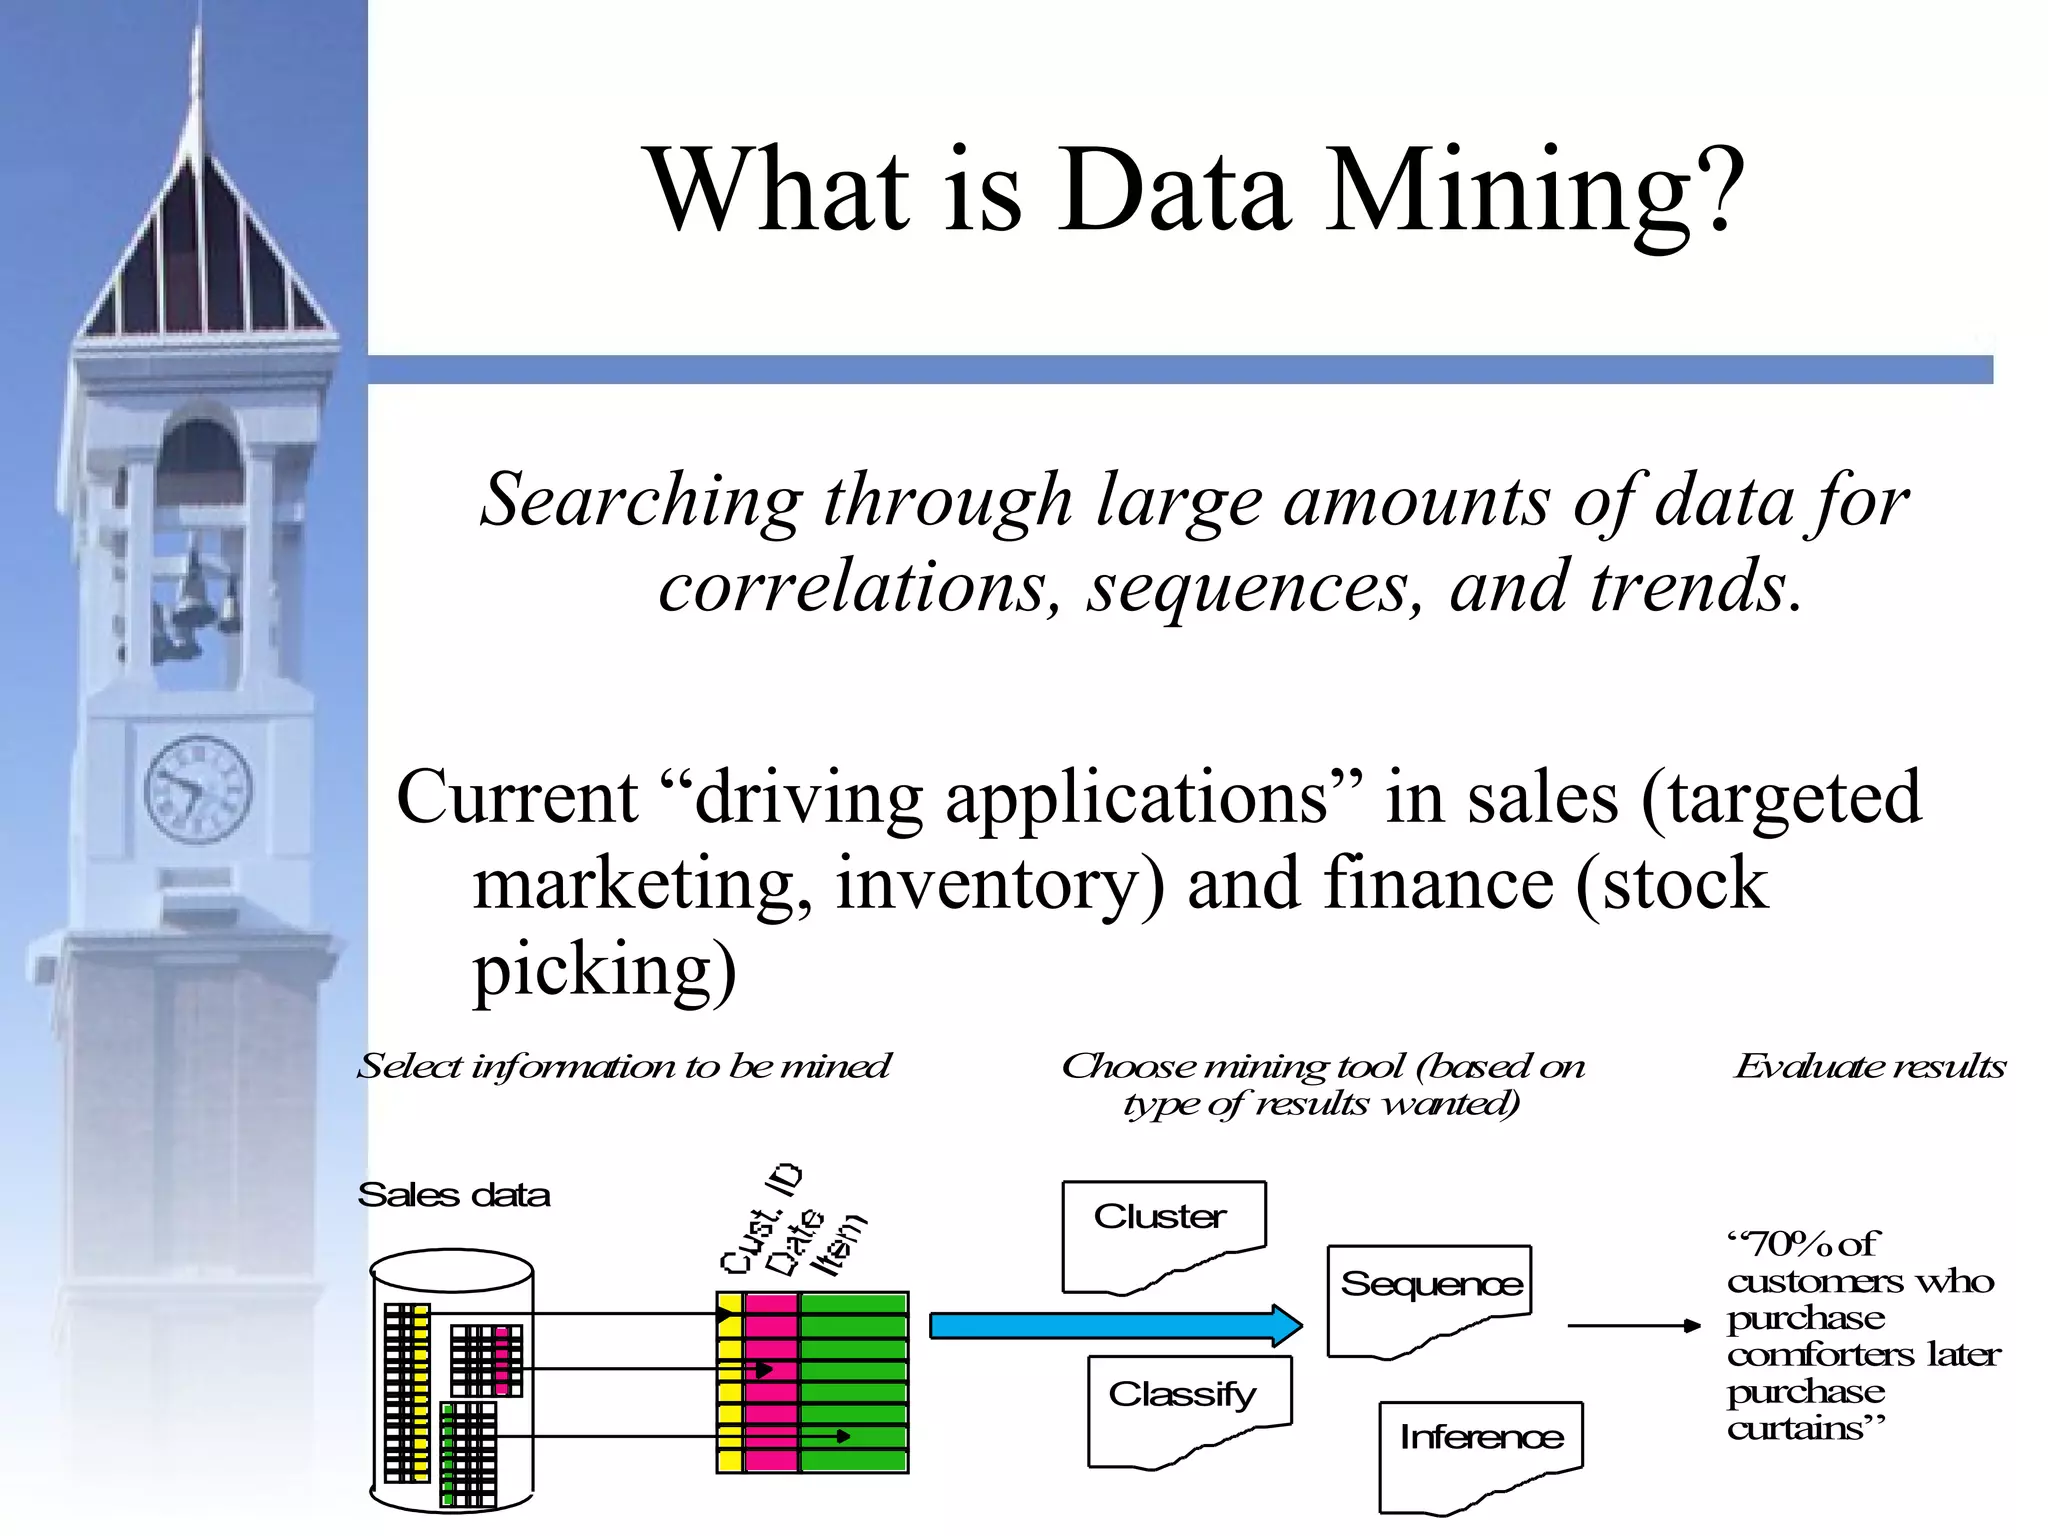
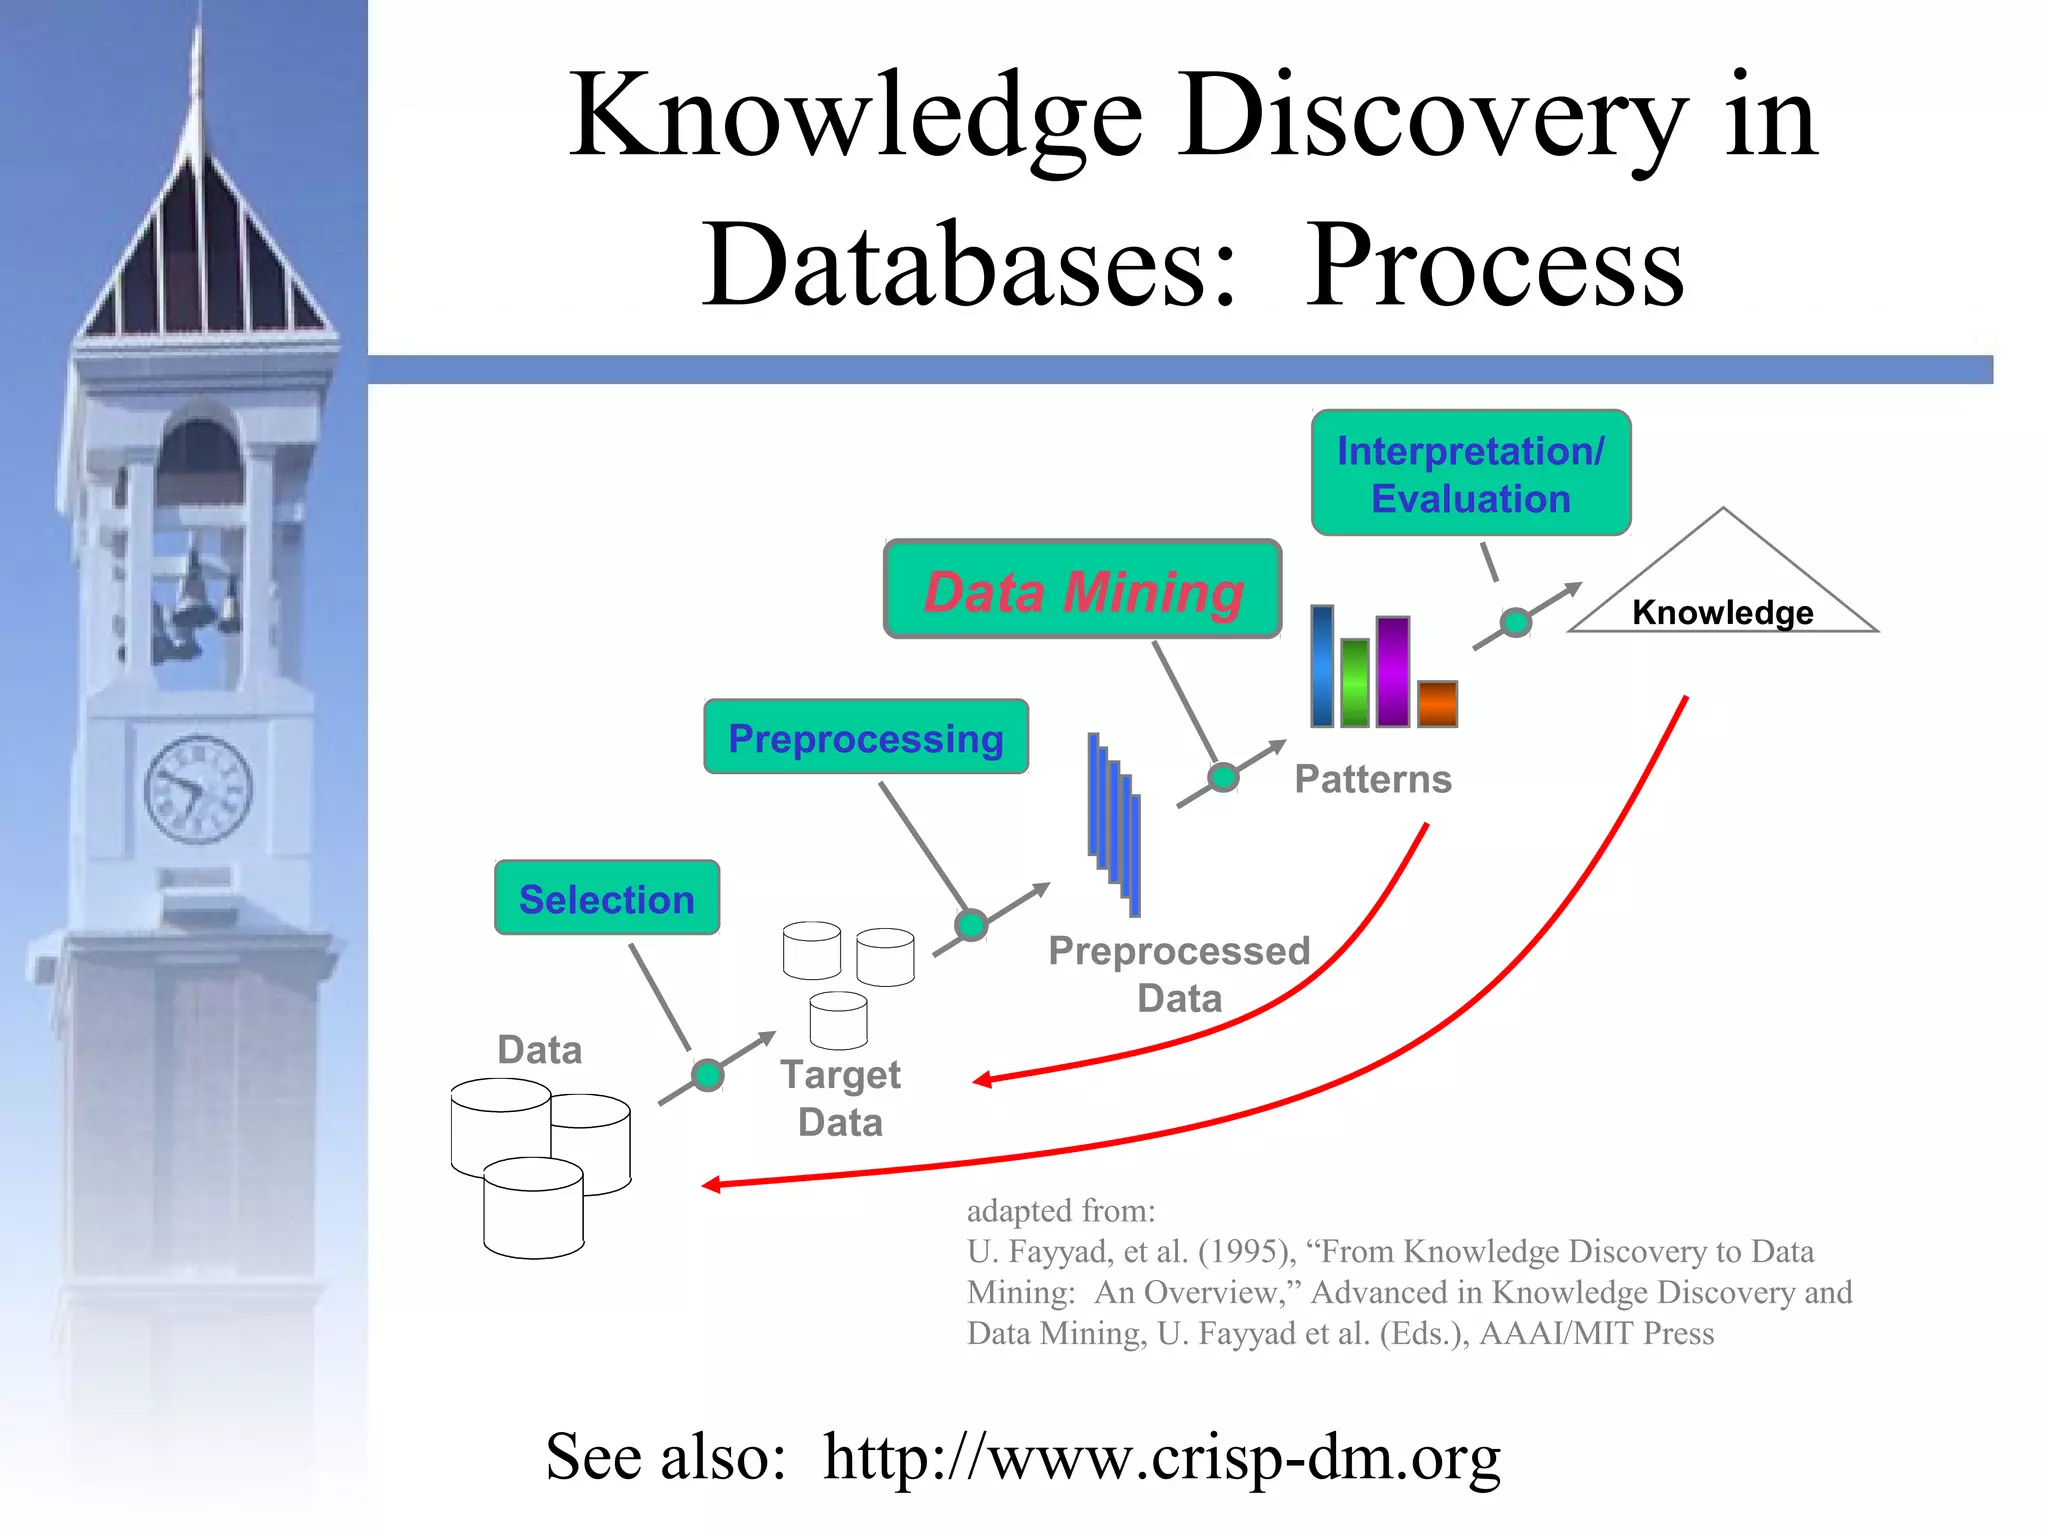


This document summarizes a course on security issues in data mining. The course will cover data mining techniques and how they can impact security. Students will learn about leading research at the intersection of data mining and security. They will give presentations on research papers and write reviews. Course topics include data mining techniques, how data mining can improve security, and security problems posed by data mining. The process will start with a data mining background phase followed by student presentations and reviews. Students will be evaluated based on their presentations, reviews, contributions to discussions, and a post-background quiz.


![Big Data [sorry] & Data Science: What Does a Data Scientist Do?](https://cdn.slidesharecdn.com/ss_thumbnails/dslatcloudmsevent20130125-130126065651-phpapp01-thumbnail.jpg?width=600ounds&width=560&fit=bounds)


