INTRODUCTION
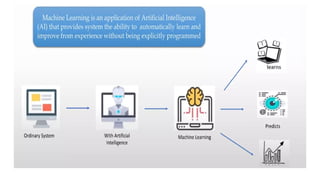
Machine learning (ML)is a branch of artificial intelligence (AI) that enables computers to “self-
learn” from training data and improve over time, without being explicitly programmed.
Machine learning is about extracting knowledge from data.
It is a research field at the intersection of statistics, artificial intelligence, and computer science
known as predictive analytics or statistical learning.
Application of Machine Learning
Automatic recommendations of which movies to watch
What food to order,
Which products to buy
Recognizing friends in photos, etc.
5.
Why Machine Learning?
Inthe early days of “intelligent” applications, many systems used handcoded rules of “if ” and “else”
decisions to process data or adjust to user input.
Manually crafting decision rules is feasible for some applications, particularly those in which humans
have a good understanding of the process to model.
Handcoded rules to make decisions has two major disadvantages:
The logic required to make a decision is specific to a single domain and task. Changing the task even
slightly might require a rewrite of the whole system.
Designing rules requires a deep understanding of how a decision should be made by a human expert.
Ex: Handcoded approach will fail is in detecting faces in images.
Today, every smartphone can detect a face in an image. Face detection was an unsolved problem until as
recently as 2001.
Problem: The way in which pixels are “perceived” by the computer is very different from how humans
perceive a face.
6.
Why Machine Learning?
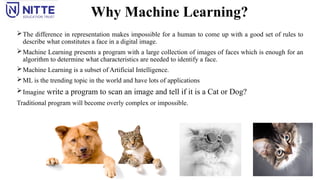
Thedifference in representation makes impossible for a human to come up with a good set of rules to
describe what constitutes a face in a digital image.
Machine Learning presents a program with a large collection of images of faces which is enough for an
algorithm to determine what characteristics are needed to identify a face.
Machine Learning is a subset of Artificial Intelligence.
ML is the trending topic in the world and have lots of applications
Imagine write a program to scan an image and tell if it is a Cat or Dog?
Traditional program will become overly complex or impossible.
7.
Why Machine Learning?
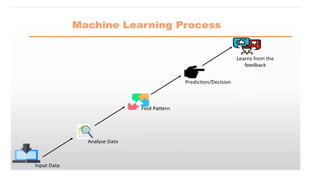
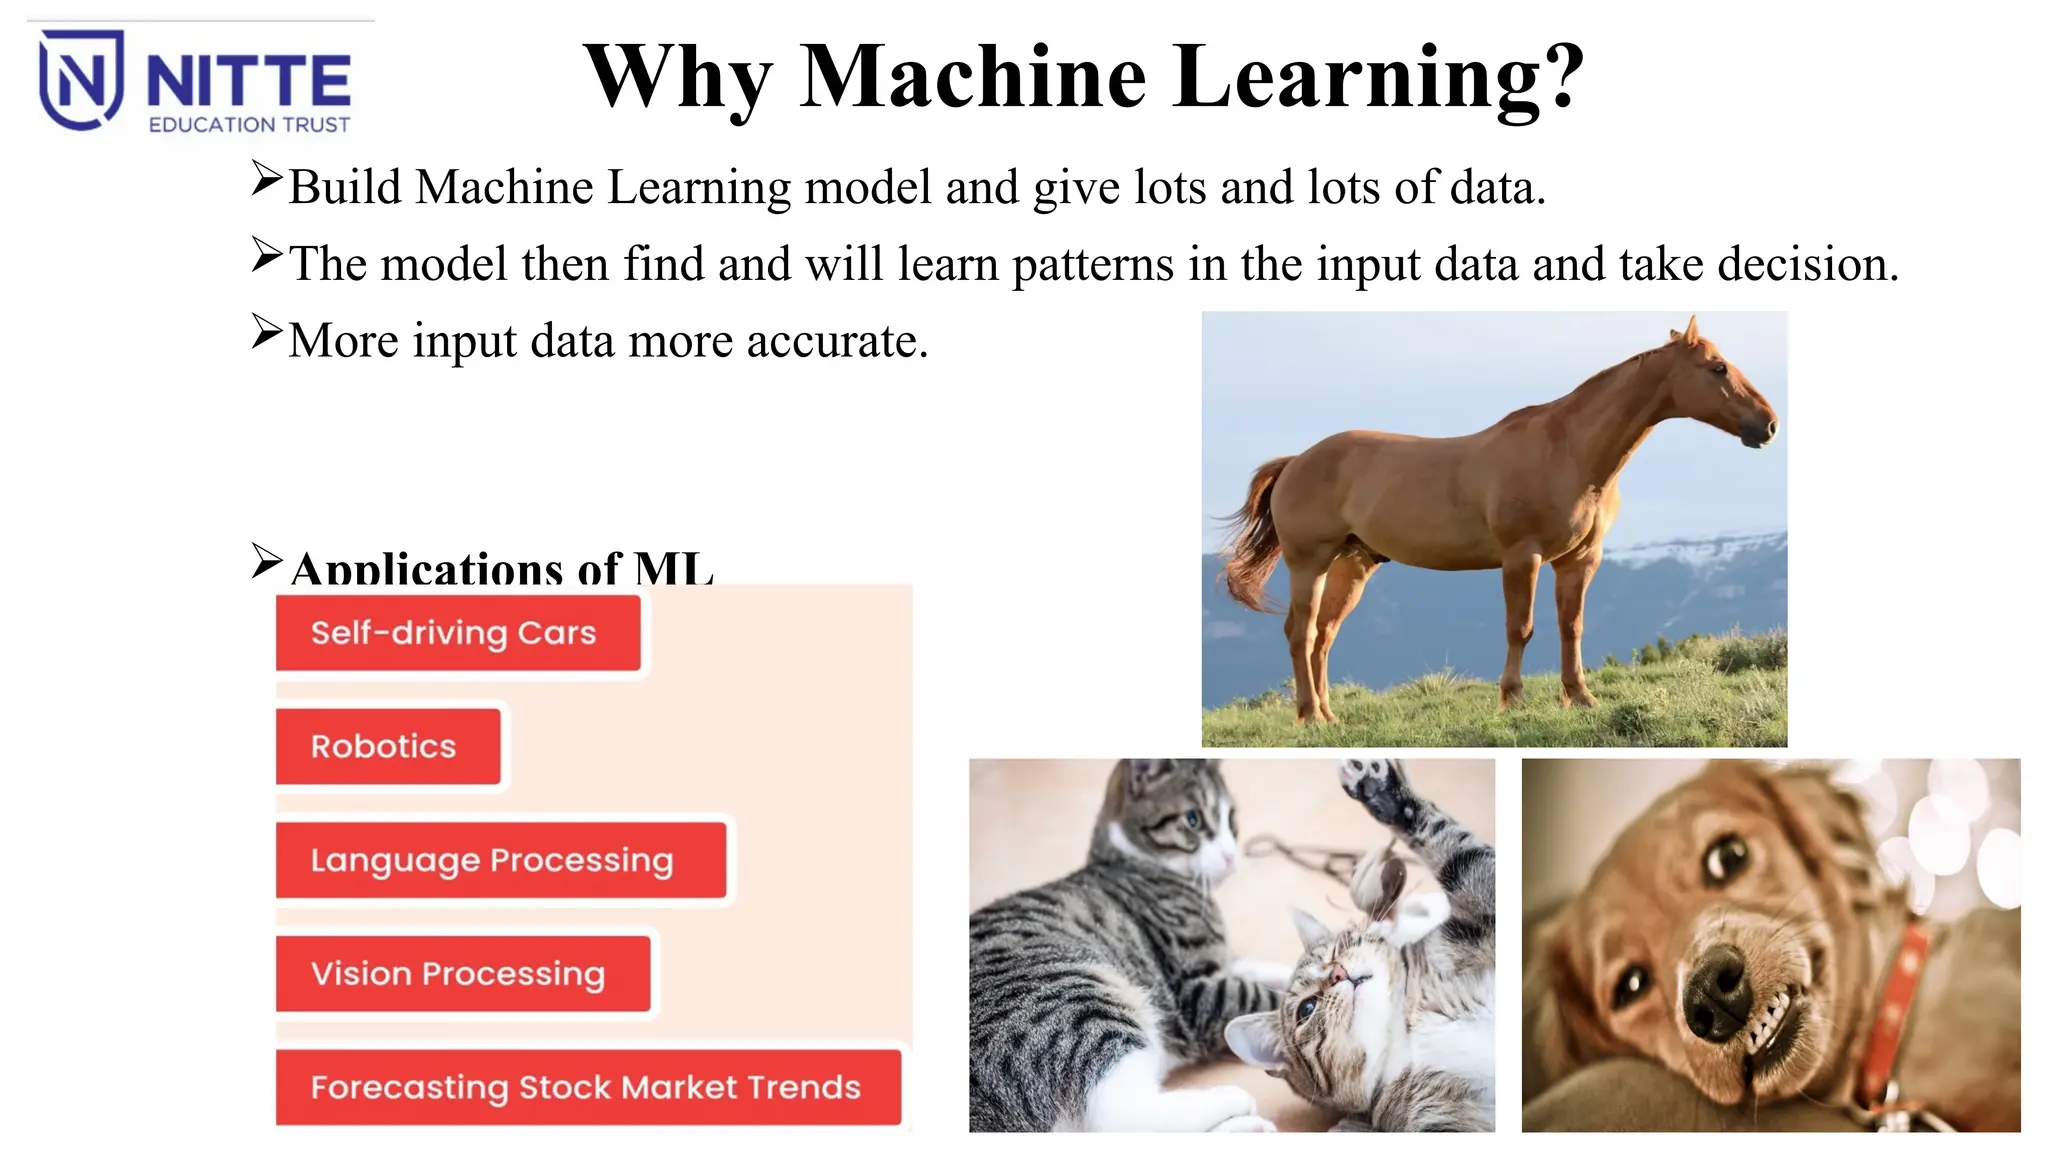
BuildMachine Learning model and give lots and lots of data.
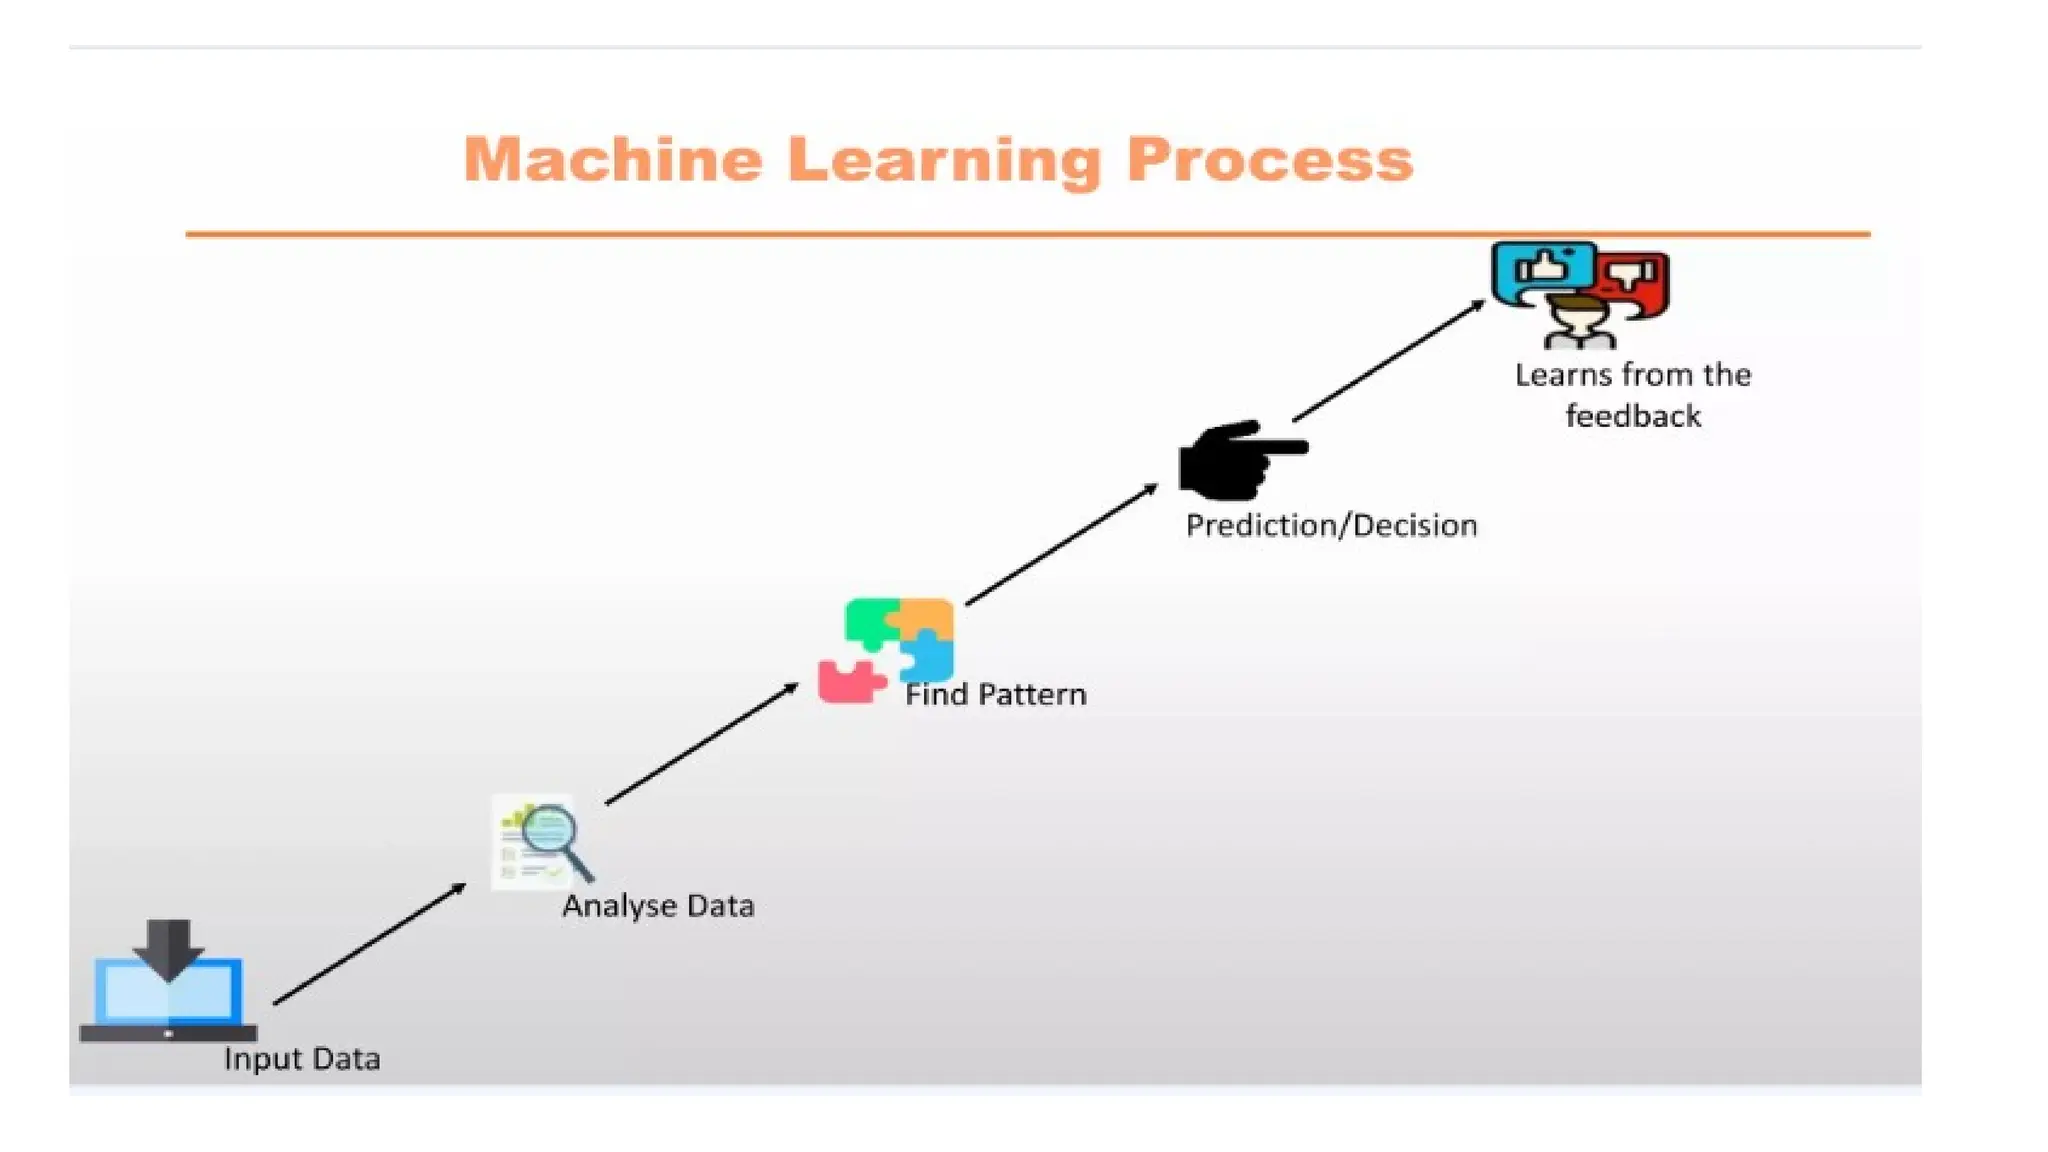
The model then find and will learn patterns in the input data and take decision.
More input data more accurate.
Applications of ML
10.
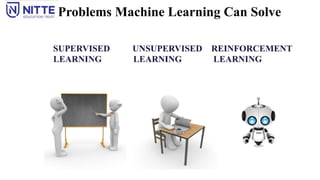
Problems Machine LearningCan Solve
The most successful ML algorithms are those that automate decision-making processes by
generalizing from known examples - Supervised Learning.
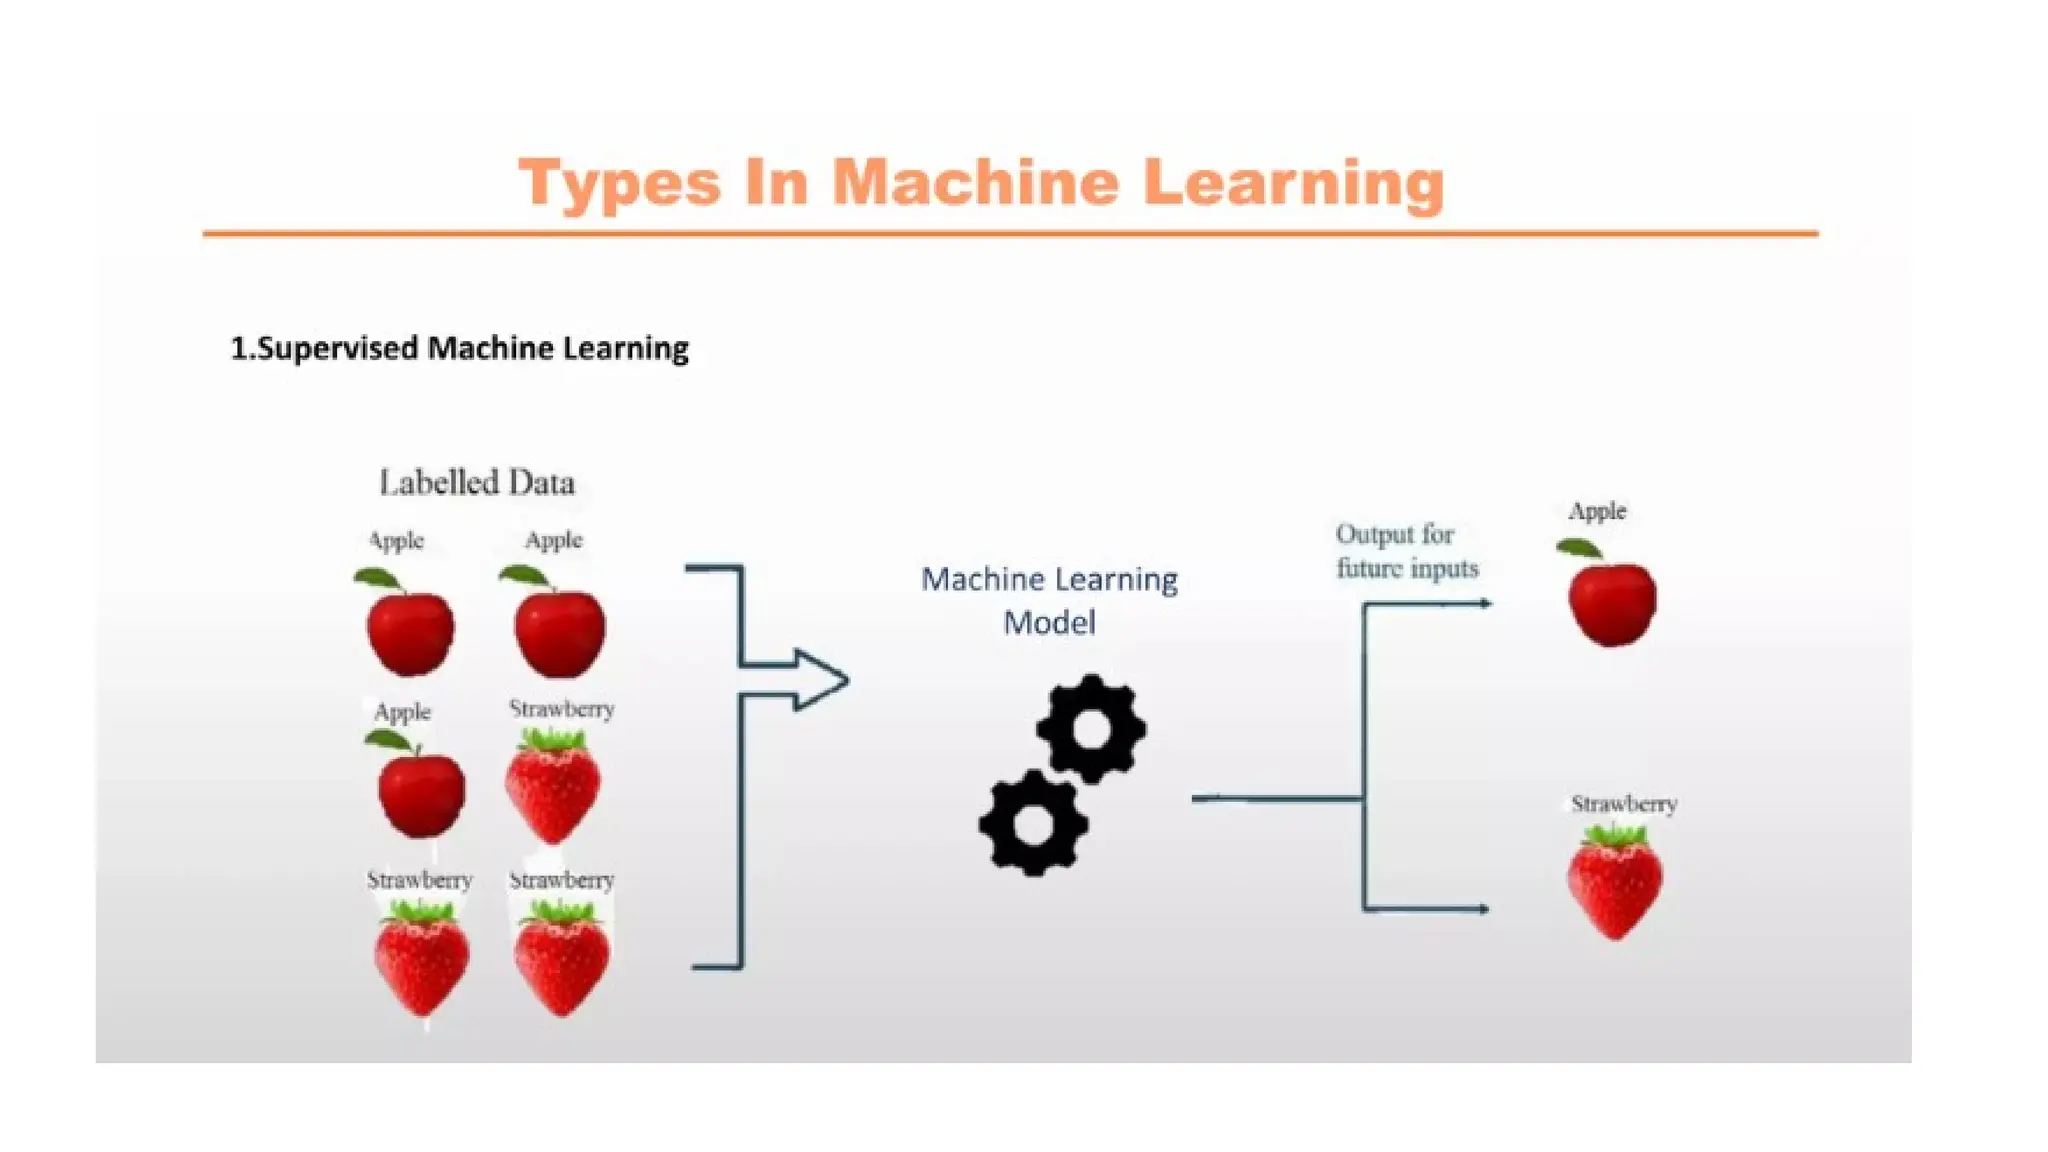
Supervised Learning : The user provides the algorithm with pairs of inputs and desired outputs,
and the algorithm is able to create an output for an input it has never seen before without any
help from a human.
Ex: Spam e-mail classification, using ML, the user provides the algorithm with a large number
of emails, together with information about whether any of these emails are spam. Given a new
email, the algorithm will then produce a prediction as to whether the new email is spam.
Machine learning algorithms that learn from input/output pairs are called supervised learning
algorithms.
Creating a dataset of inputs and outputs is a manual process. If created dataset that includes the
desired outcome, ML will likely be able to solve the problem.
12.
Problems Machine LearningCan Solve
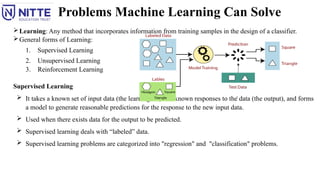
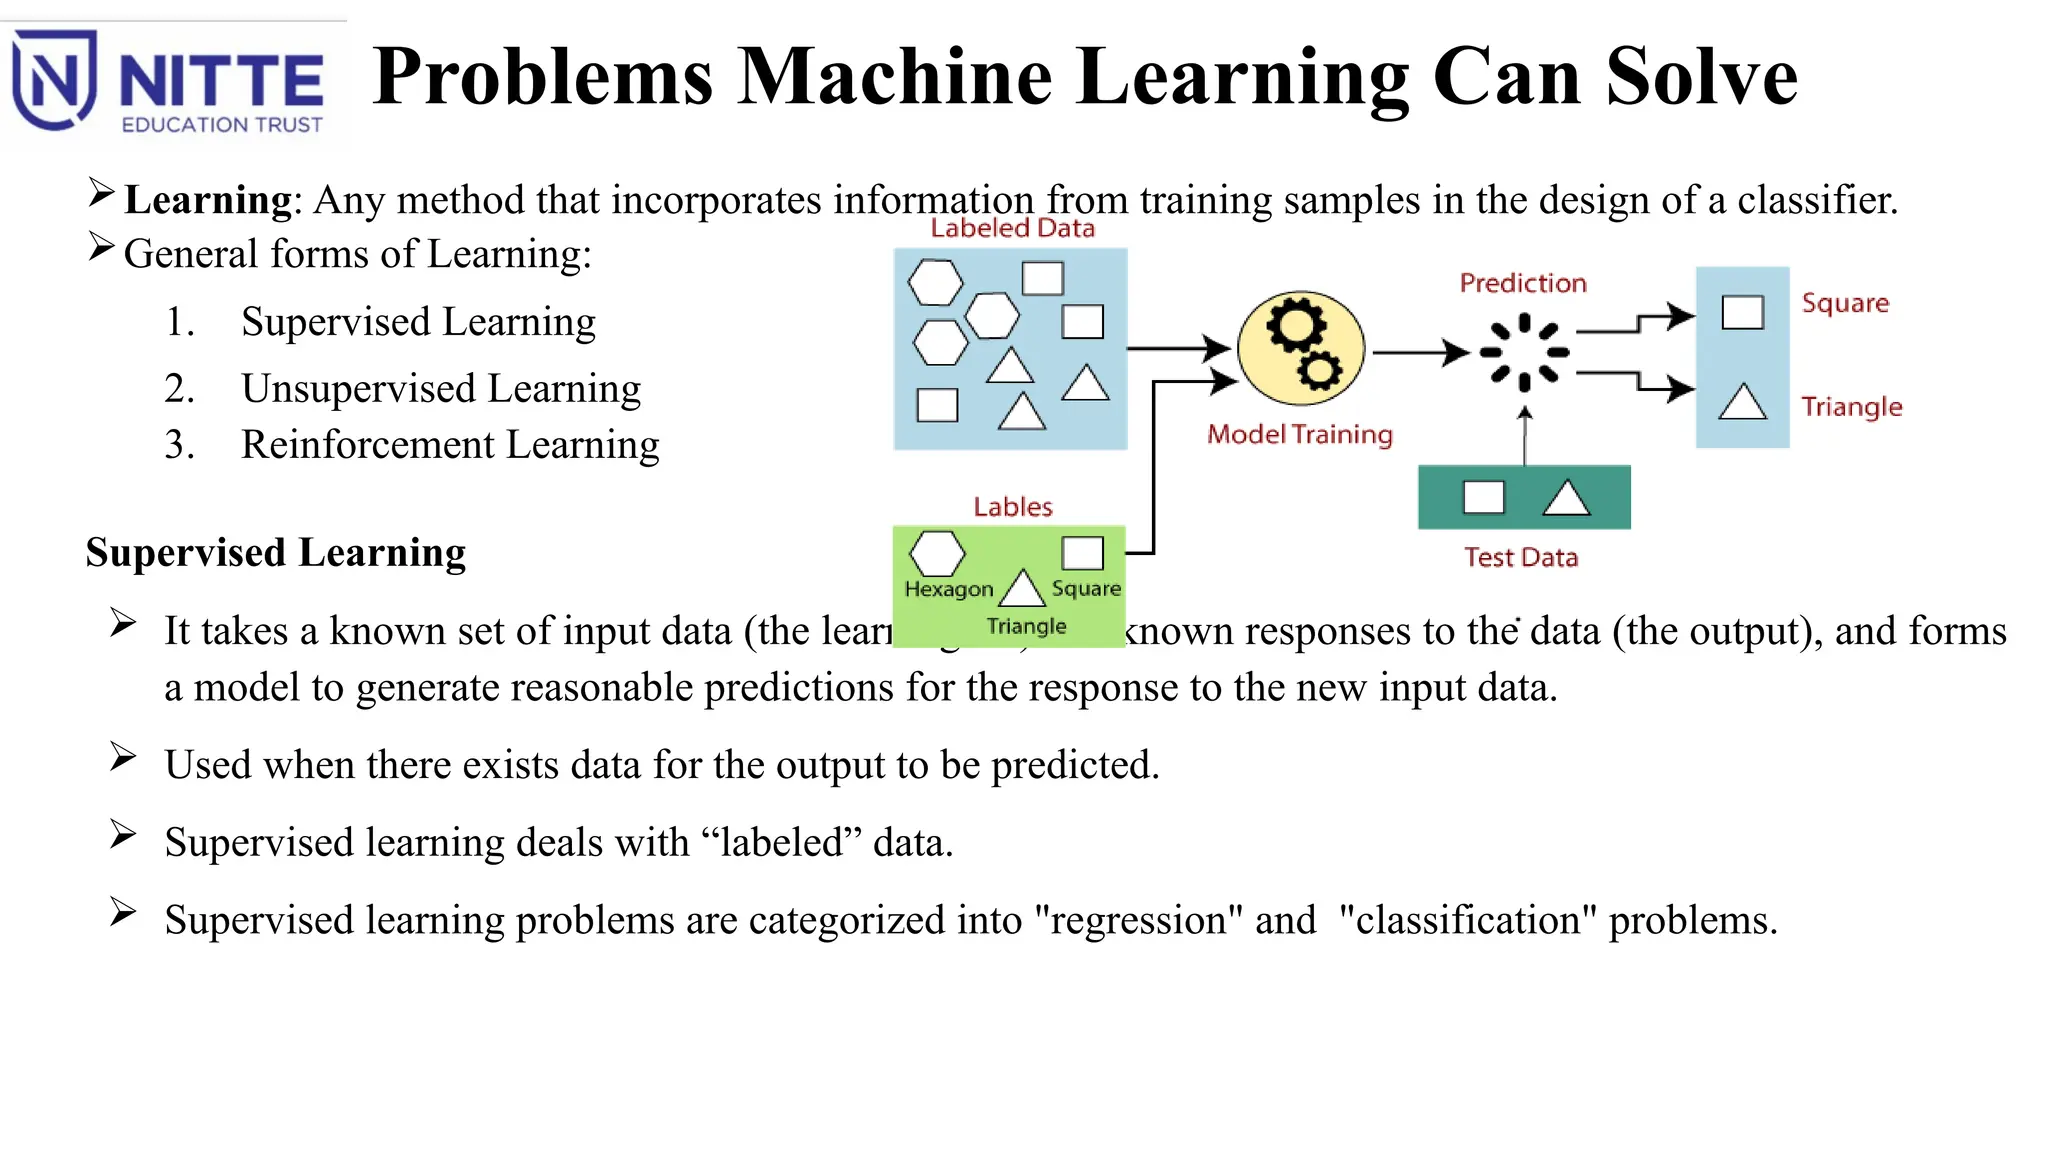
Learning: Any method that incorporates information from training samples in the design of a classifier.
General forms of Learning:
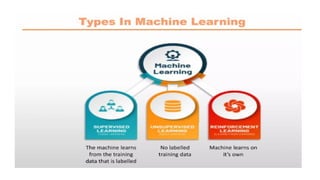
1. Supervised Learning
2. Unsupervised Learning
3. Reinforcement Learning
Supervised Learning
It takes a known set of input data (the learning set) and known responses to the data (the output), and forms
a model to generate reasonable predictions for the response to the new input data.
Used when there exists data for the output to be predicted.
Supervised learning deals with “labeled” data.
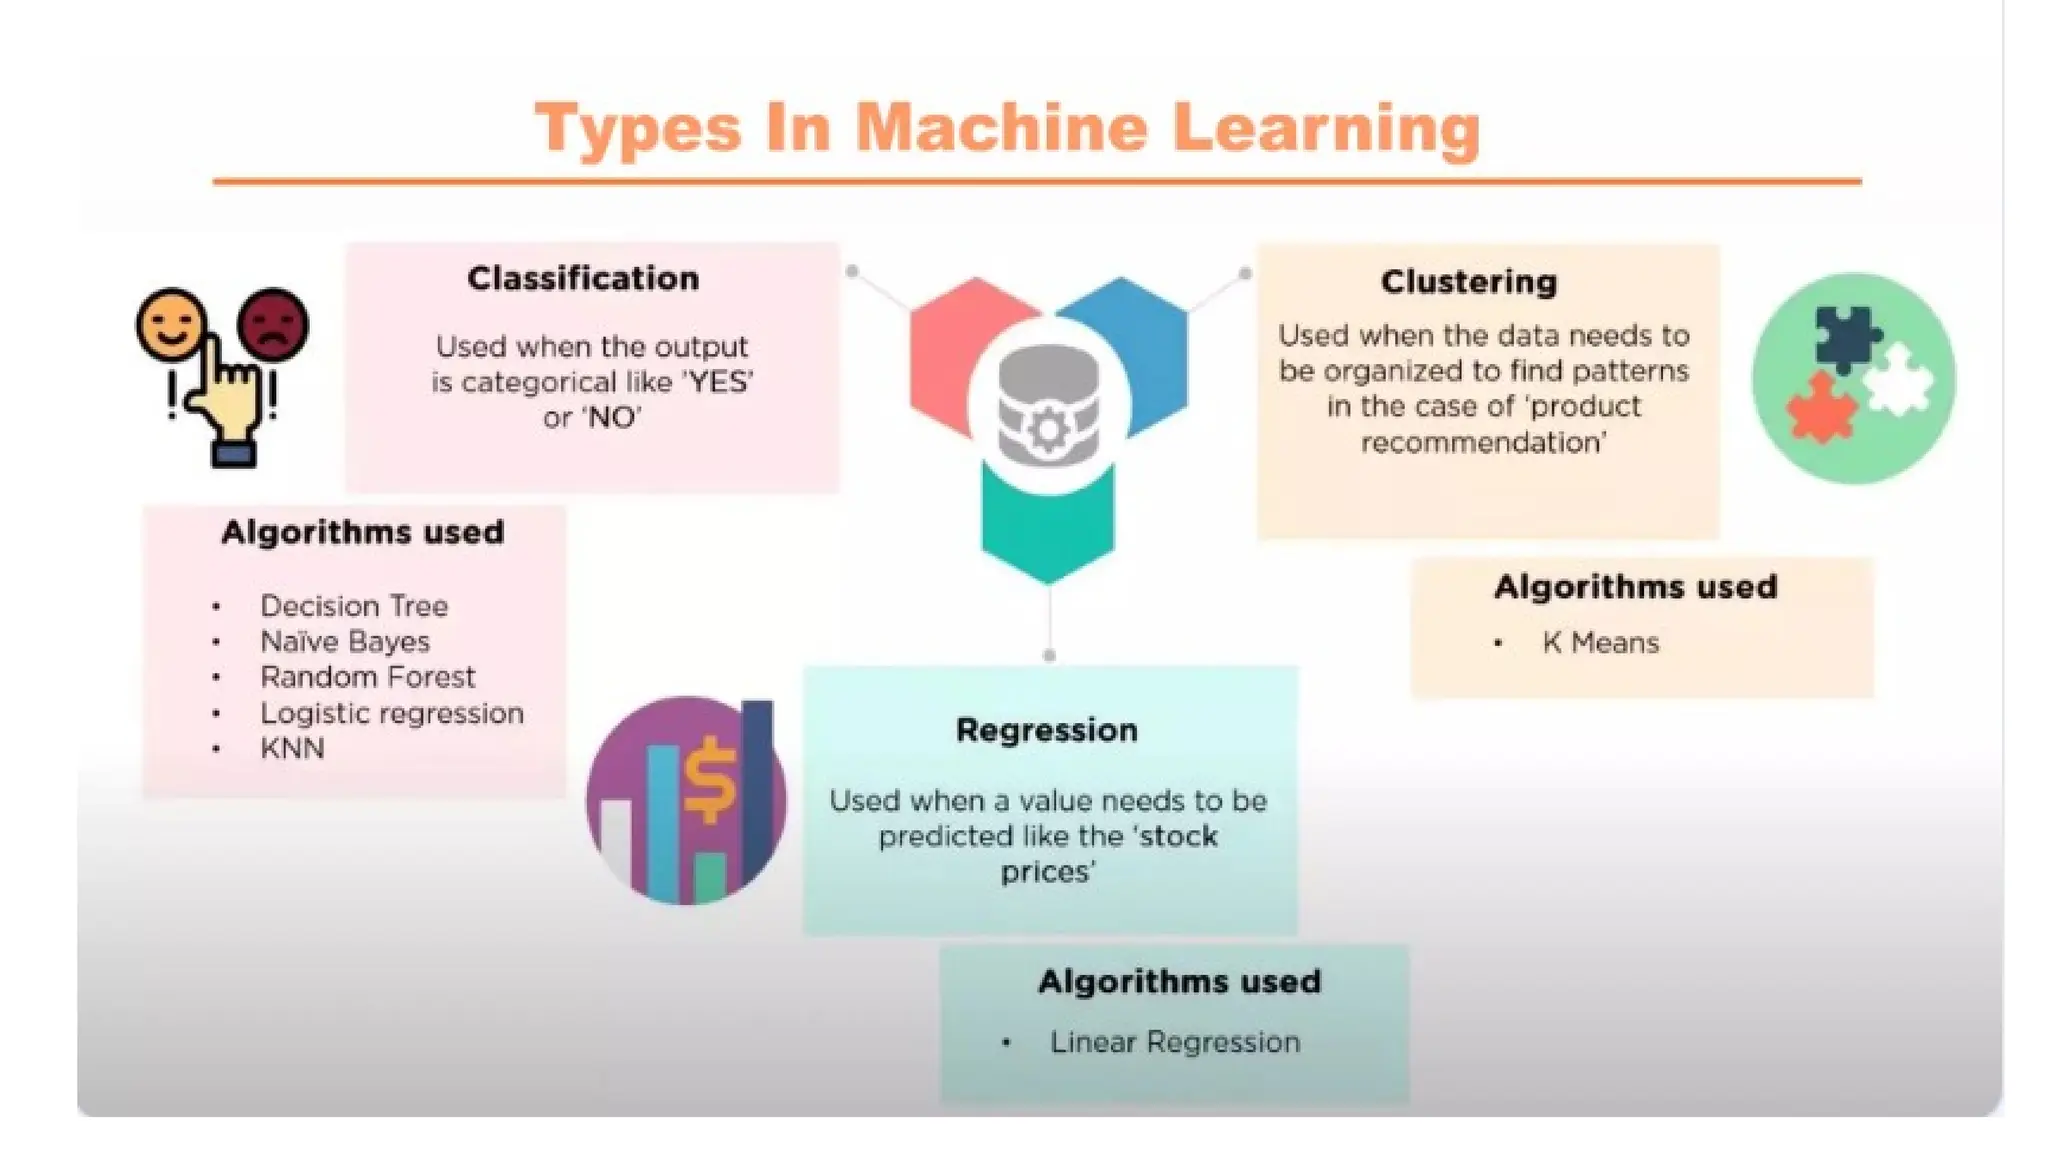
Supervised learning problems are categorized into "regression" and "classification" problems.
14.
Problems Machine LearningCan Solve
Examples of Supervised Machine Learning tasks:
1. Identifying the zip code from handwritten digits on an envelope.
Here the input is a scan of the handwriting, and the desired output is the actual digits in the zip code.
To create a dataset for building a ML model, collect many envelopes. Then read the zip codes and store
the digits as desired outcomes.
2. Determining whether a tumor is benign based on a medical image
Here the input is the image, and the output is whether the tumor is benign.
To create a dataset for building a model, a database of medical images is needed.
An expert opinion is needed, so a doctor needs to look at all of the images and decide which tumors are
benign and which are not.
It might even be necessary to do additional diagnosis beyond the content of the image to determine
whether the tumor in the image is cancerous or not.
15.
Problems Machine LearningCan Solve
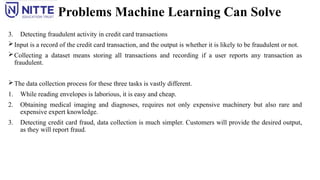
3. Detecting fraudulent activity in credit card transactions
Input is a record of the credit card transaction, and the output is whether it is likely to be fraudulent or not.
Collecting a dataset means storing all transactions and recording if a user reports any transaction as
fraudulent.
The data collection process for these three tasks is vastly different.
1. While reading envelopes is laborious, it is easy and cheap.
2. Obtaining medical imaging and diagnoses, requires not only expensive machinery but also rare and
expensive expert knowledge.
3. Detecting credit card fraud, data collection is much simpler. Customers will provide the desired output,
as they will report fraud.
16.
Problems Machine LearningCan Solve
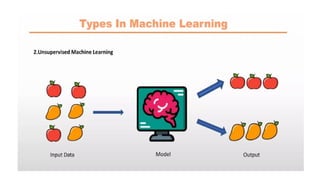
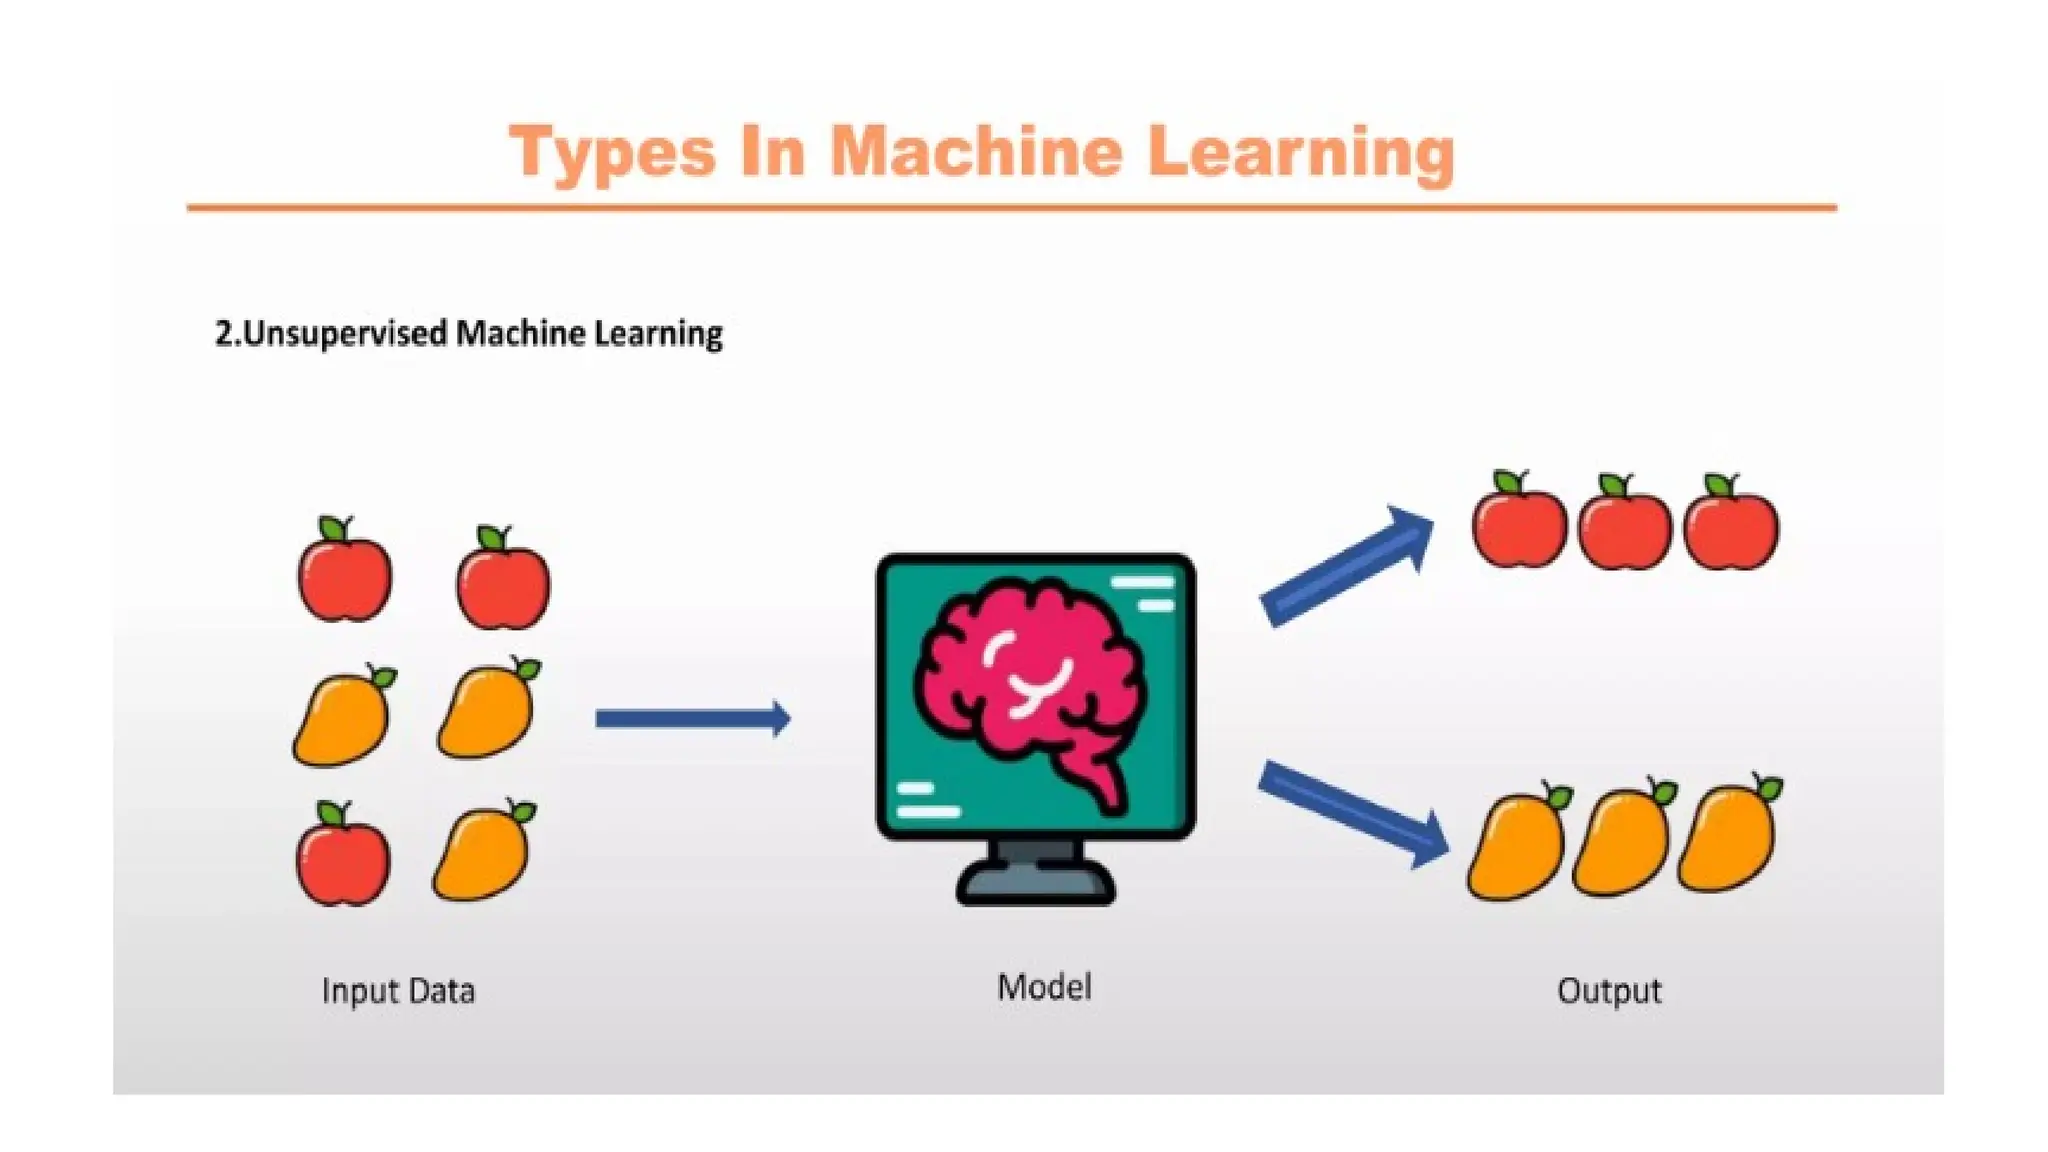
Unsupervised Learning
It is a type of machine learning in which models are trained using unlabeled dataset and are allowed to act on
that data without any supervision.
Models itself find the hidden patterns and insights from the given data.
It is a type of machine learning algorithm used to draw inferences from datasets consisting of input data
without labeled responses.
The most common unsupervised learning method is cluster analysis, which is used for exploratory data
analysis to find hidden patterns or grouping in data.
Input data is known, and no known output data is given to the algorithm.
17.
Problems Machine LearningCan Solve
Representation of input data that a computer can understand
The data should be considered as a table.
Each data point infers a row, and each property that describes that data point is a column.
Each entity or row here is known as a Sample (or data point) in machine learning, while the columns the
properties that describe these entities are called Features.
Building a good representation of the data is called Feature Extraction or Feature Engineering.
No machine learning algorithm will be able to make a prediction on data for which it has no information.
Ex: If the only feature that have for a patient is their last name, no algorithm will be able to predict their
gender.
Adding another feature that contains the patient’s first name, will have much better luck, as it is often
possible to tell the gender by a person’s first name.
19.
Problems Machine LearningCan Solve
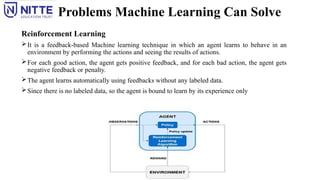
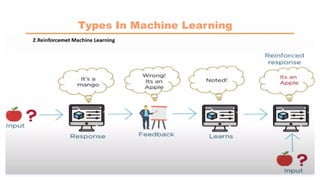
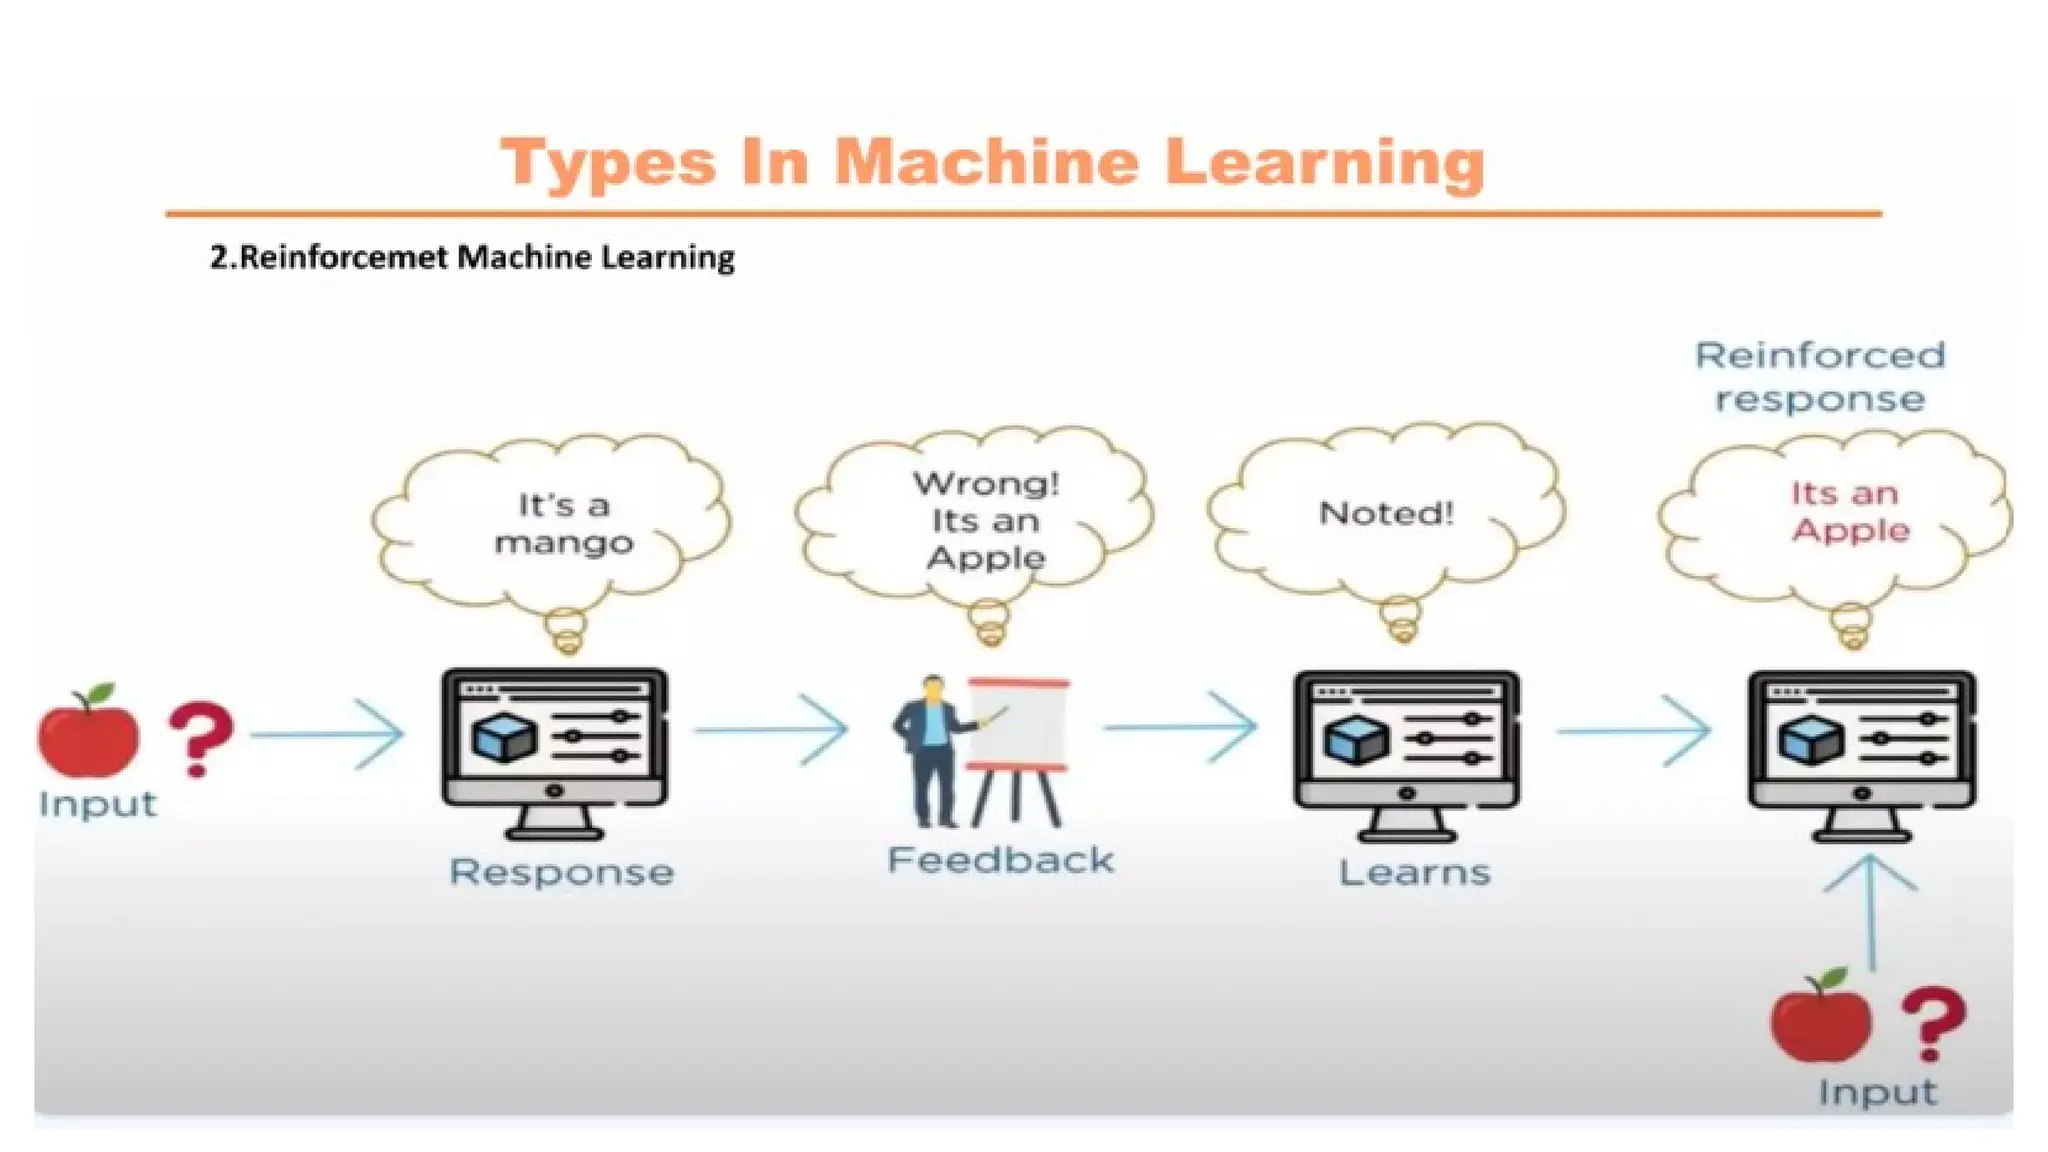
Reinforcement Learning
It is a feedback-based Machine learning technique in which an agent learns to behave in an
environment by performing the actions and seeing the results of actions.
For each good action, the agent gets positive feedback, and for each bad action, the agent gets
negative feedback or penalty.
The agent learns automatically using feedbacks without any labeled data.
Since there is no labeled data, so the agent is bound to learn by its experience only
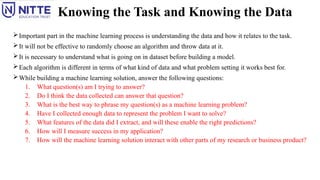
Knowing the Taskand Knowing the Data
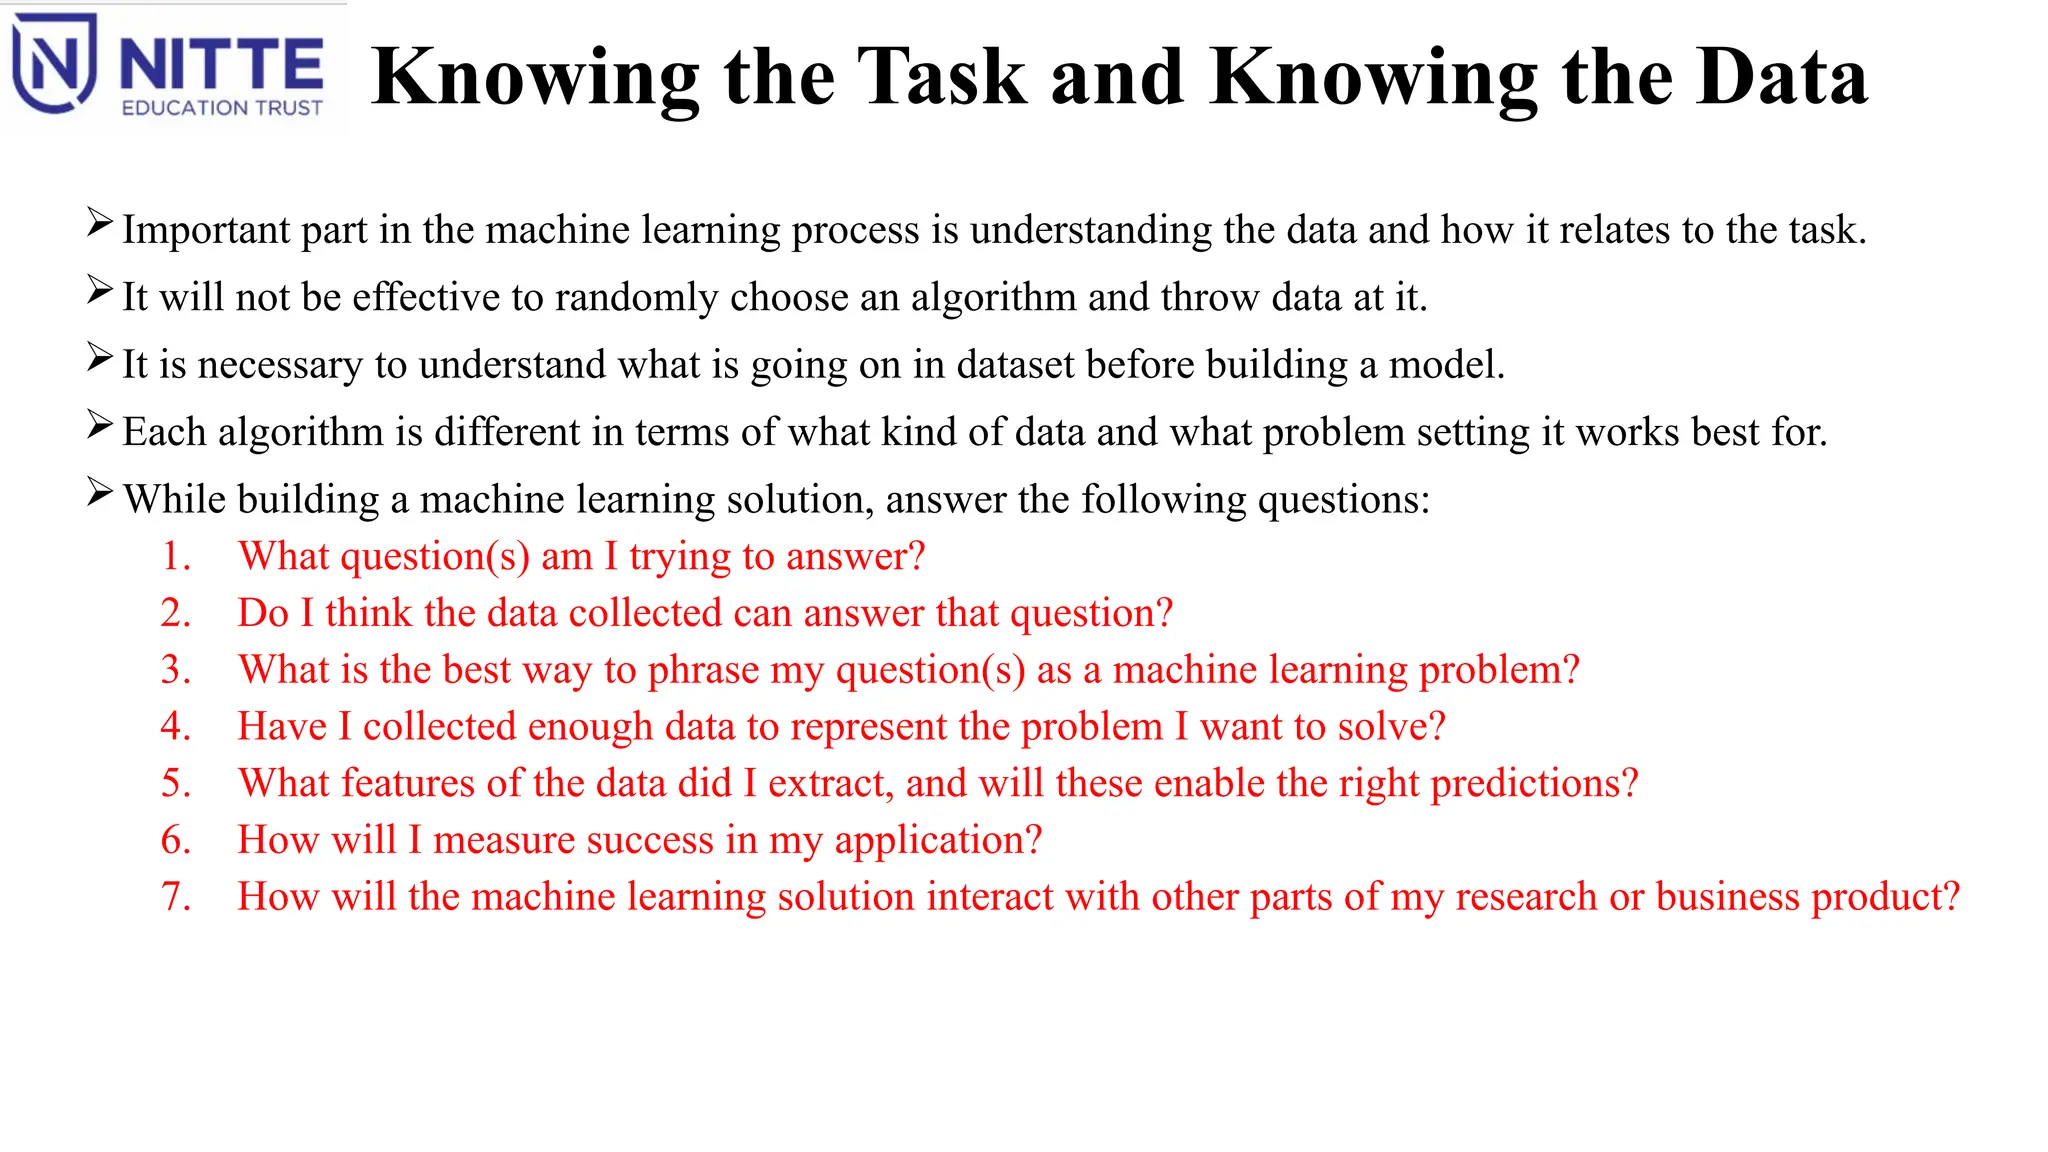
Important part in the machine learning process is understanding the data and how it relates to the task.
It will not be effective to randomly choose an algorithm and throw data at it.
It is necessary to understand what is going on in dataset before building a model.
Each algorithm is different in terms of what kind of data and what problem setting it works best for.
While building a machine learning solution, answer the following questions:
1. What question(s) am I trying to answer?
2. Do I think the data collected can answer that question?
3. What is the best way to phrase my question(s) as a machine learning problem?
4. Have I collected enough data to represent the problem I want to solve?
5. What features of the data did I extract, and will these enable the right predictions?
6. How will I measure success in my application?
7. How will the machine learning solution interact with other parts of my research or business product?
24.
Why Python?
Python combinesthe power of general-purpose programming languages with the ease of use of domain-
specific scripting languages like MATLAB or R.
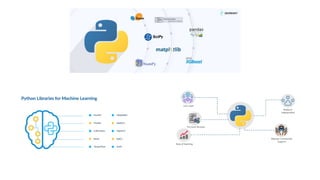
Python has libraries for data loading, visualization, statistics, natural language processing, image processing,
and more.
It provides data scientists with a large array of general-and special-purpose functionality.
Advantages of using Python is the ability to interact directly with the code, using a terminal or other tools like
the Jupyter Notebook.
Machine learning and data analysis are iterative processes, in which the data drives the analysis. It is essential
to have tools that allow quick iteration and easy interaction.
As a general-purpose programming language, Python also allows for the creation of complex graphical user
interfaces (GUIs) and web services, and for integration into existing systems.
25.
Scikit - learn
scikit-learnis an open source project, it is free to use and distribute, and source code is easily available. The
scikit-learn project is constantly being developed and improved.
It has a very active user community.
It contains a number of state-of-the-art machine learning algorithms, as well as comprehensive
documentation about each algorithm.
It is a very popular tool, and the most prominent Python library for machine learning.
It is widely used in industry and academia, tutorials and code snippets are available online.
It works well with a number of other scientific Python tools.
26.
Installing scikit-learn
scikit-learn dependson two other Python packages, NumPy and SciPy.
For plotting and interactive development, install matplotlib, IPython, and the Jupyter Notebook.
It is recommended to use one of the following prepackaged Python distributions, which will provide the
necessary packages:
1. Anaconda
2. Enthought Canopy
3. Python(x,y)
If you already have a Python installation set up, you can use pip to install all of these packages:
$ pip install numpy scipy matplotlib ipython scikit-learn pandas
27.
Installing scikit-learn
1. Anaconda
APython distribution made for large-scale data processing, predictive analytics, and scientific computing.
Anaconda comes with NumPy, SciPy, matplotlib, pandas, IPython, Jupyter Notebook, and scikit-learn.
Available on Mac OS, Windows, and Linux.
It is a very convenient solution and without an existing installation of the scientific Python packages.
Anaconda includes the commercial Intel MKL library for free.
MKL can give significant speed improvements for many algorithms in scikit-learn.
28.
Installing scikit-learn
2. EnthoughtCanopy
Python distribution for scientific computing.
This comes with NumPy, SciPy, matplotlib, pandas, and IPython, but the free version does not come with scikit-
learn.
Academic, degree-granting institution, can request an academic license and get free access to the paid
subscription version of Enthought Canopy.
Enthought Canopy is available for Python 2.7.x, and works on Mac OS, Windows, and Linux.
3. Python(x,y)
A free Python distribution for scientific computing, specifically for Windows.
Python(x,y) comes with NumPy, SciPy, matplotlib, pandas, IPython, and scikit-learn.
29.
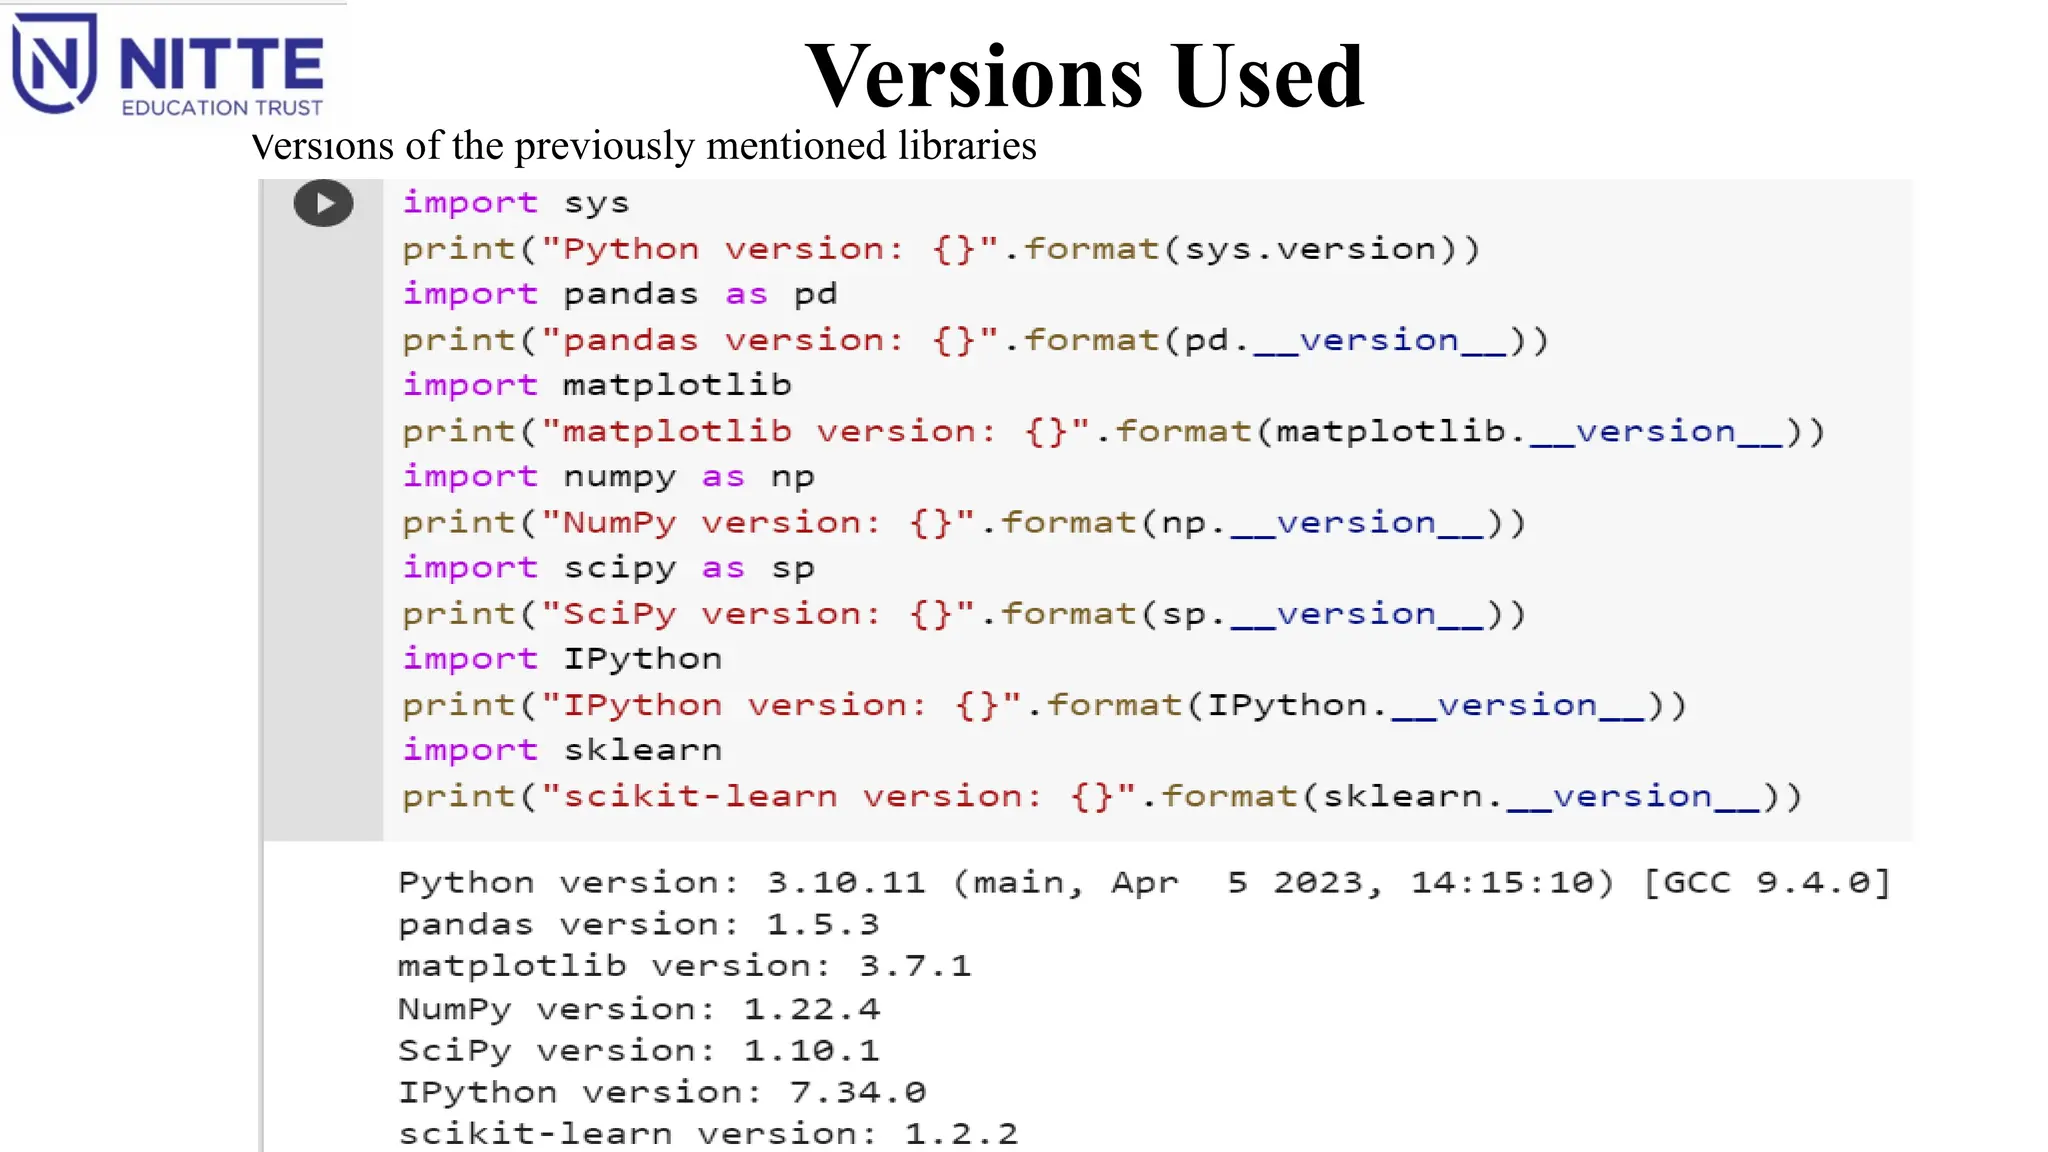
Essential Libraries andTools
scikit-learn is built on top of the NumPy and SciPy scientific Python libraries.
In addition to NumPy and SciPy, pandas and matplotlib can be used.
Jupyter Notebook, is a browser-based interactive programming environment.
Jupyter Notebook
It is an interactive environment for running code in the browser.
It is a great tool for exploratory data analysis and is widely used by data scientists.
It supports many programming languages, only need the Python support.
The Jupyter Notebook makes it easy to incorporate code, text, and images.
30.
Essential Libraries andTools
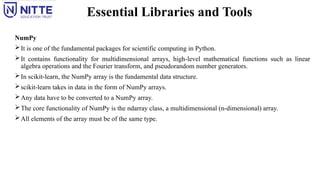
NumPy
It is one of the fundamental packages for scientific computing in Python.
It contains functionality for multidimensional arrays, high-level mathematical functions such as linear
algebra operations and the Fourier transform, and pseudorandom number generators.
In scikit-learn, the NumPy array is the fundamental data structure.
scikit-learn takes in data in the form of NumPy arrays.
Any data have to be converted to a NumPy array.
The core functionality of NumPy is the ndarray class, a multidimensional (n-dimensional) array.
All elements of the array must be of the same type.
31.
Essential Libraries andTools
NumPy
A NumPy array looks like this:
Objects of the NumPy ndarray class are referred as “NumPy arrays” or just
“Arrays”.
32.
Essential Libraries andTools
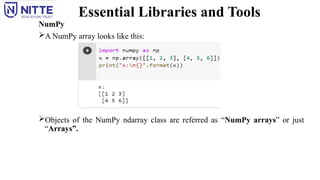
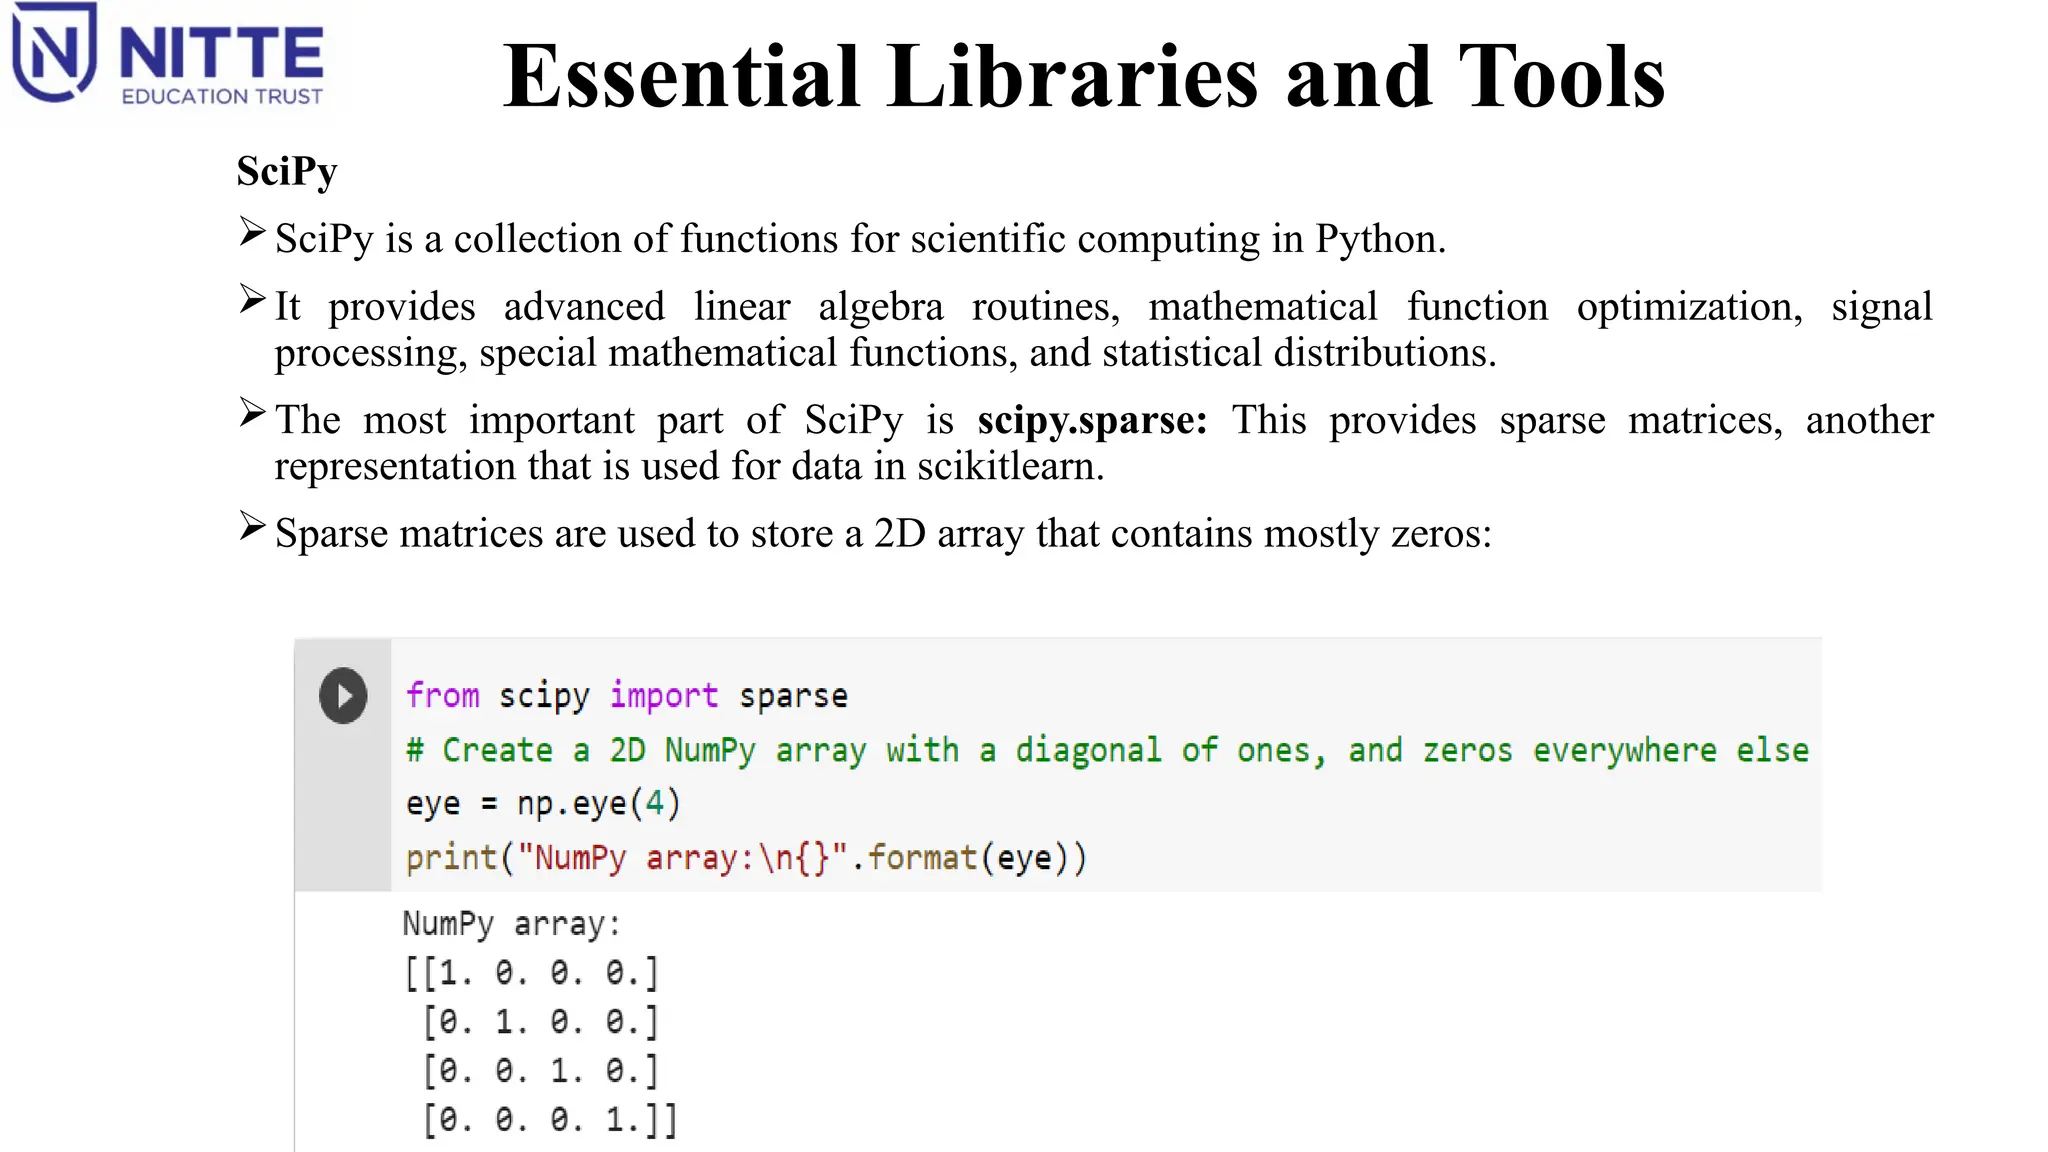
SciPy
SciPy is a collection of functions for scientific computing in Python.
It provides advanced linear algebra routines, mathematical function optimization, signal
processing, special mathematical functions, and statistical distributions.
The most important part of SciPy is scipy.sparse: This provides sparse matrices, another
representation that is used for data in scikitlearn.
Sparse matrices are used to store a 2D array that contains mostly zeros:
33.
Essential Libraries andTools
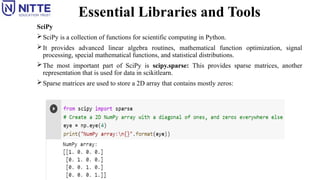
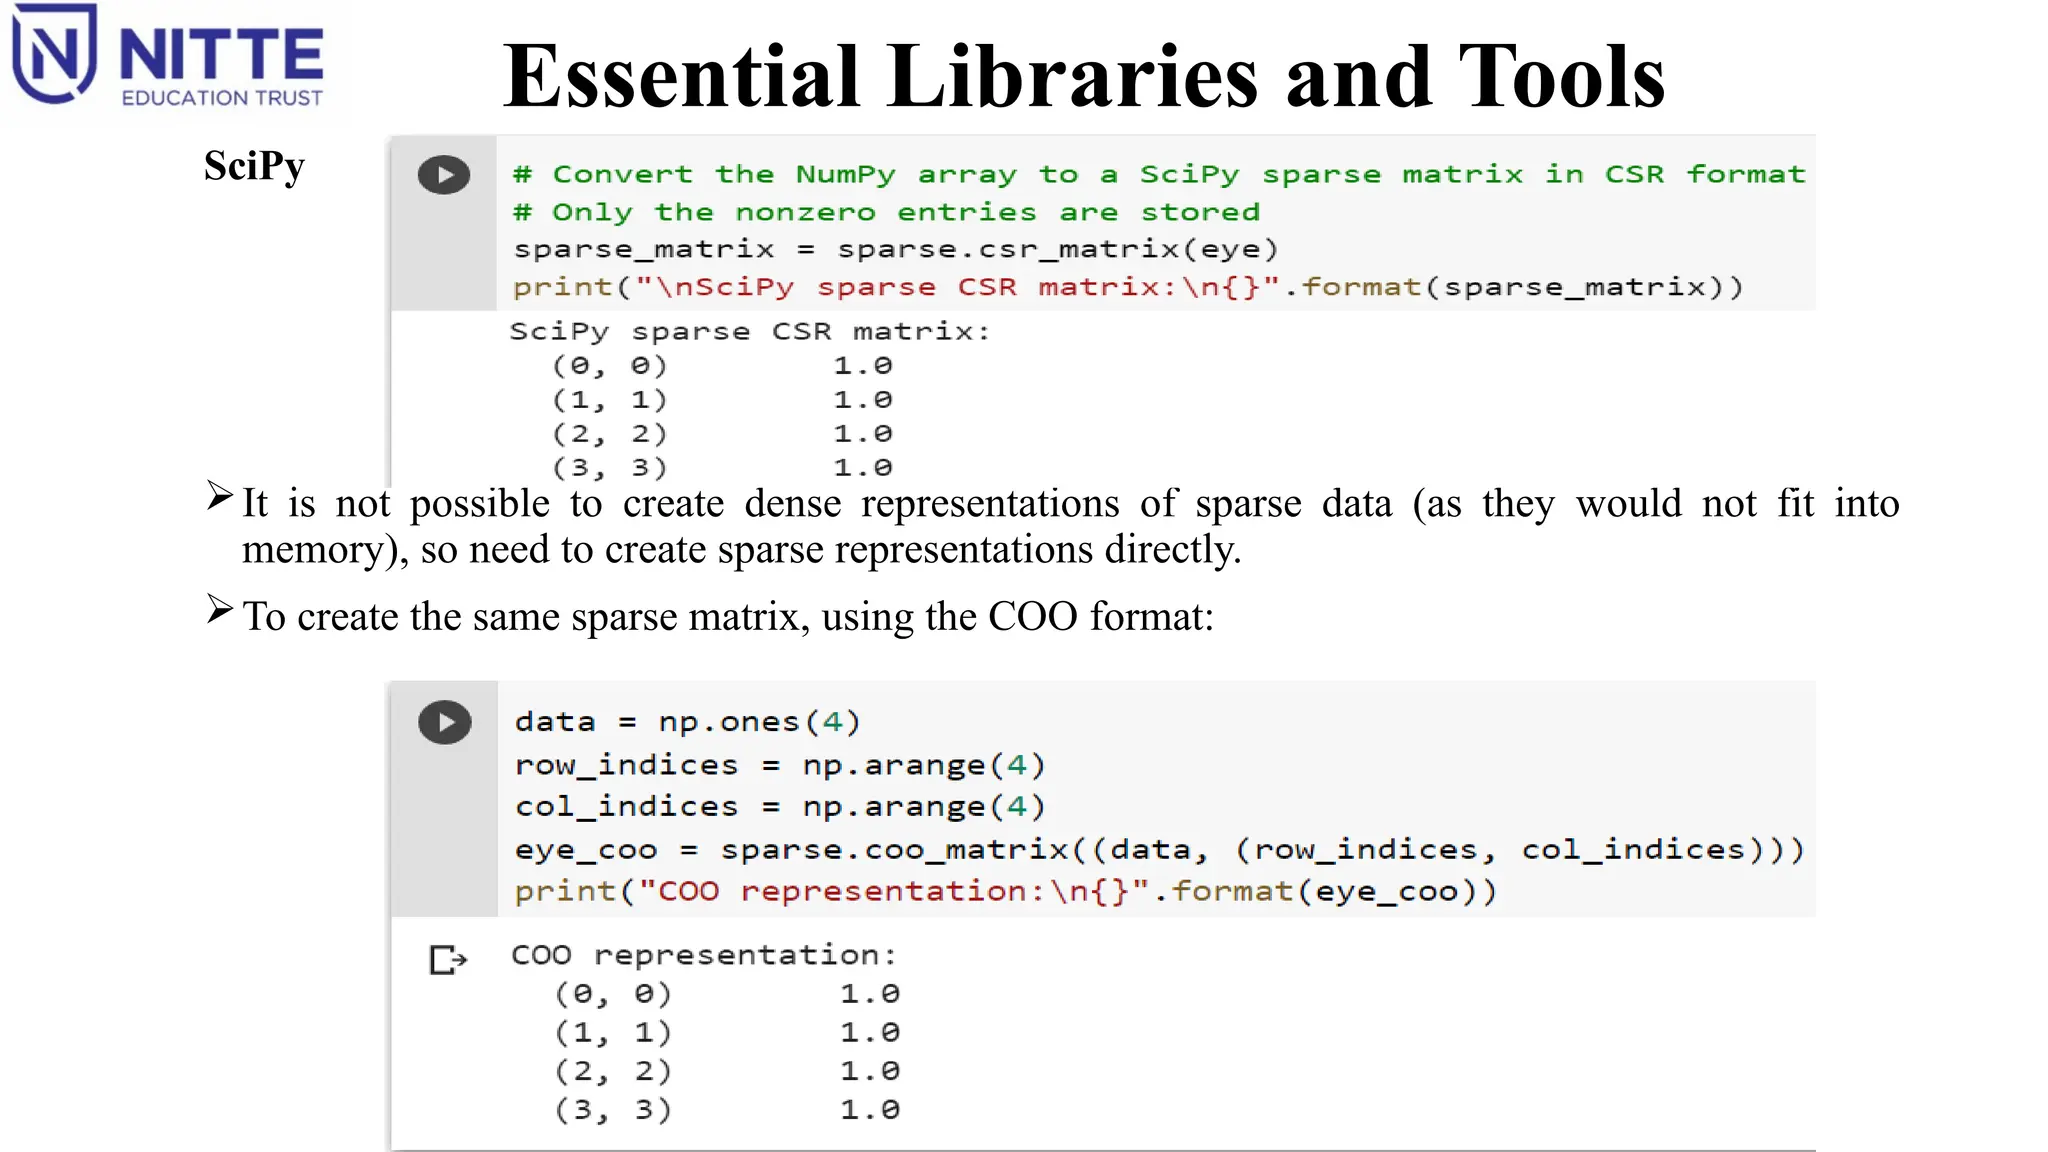
SciPy
It is not possible to create dense representations of sparse data (as they would not fit into
memory), so need to create sparse representations directly.
To create the same sparse matrix, using the COO format:
34.
Essential Libraries andTools
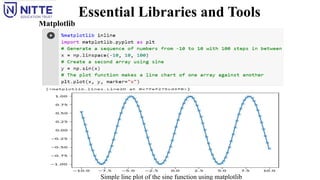
matplotlib
It is the primary scientific plotting library in Python.
It provides functions for making publication-quality visualizations such as line charts, histograms, scatter
plots, and so on.
Visualizing data and different aspects of analysis can give important insights.
When working inside the Jupyter Notebook, figures can be showed directly in the browser by using the
%matplotlib notebook and %matplotlib inline commands.
Using %matplotlib notebook, provides an interactive environment.
35.
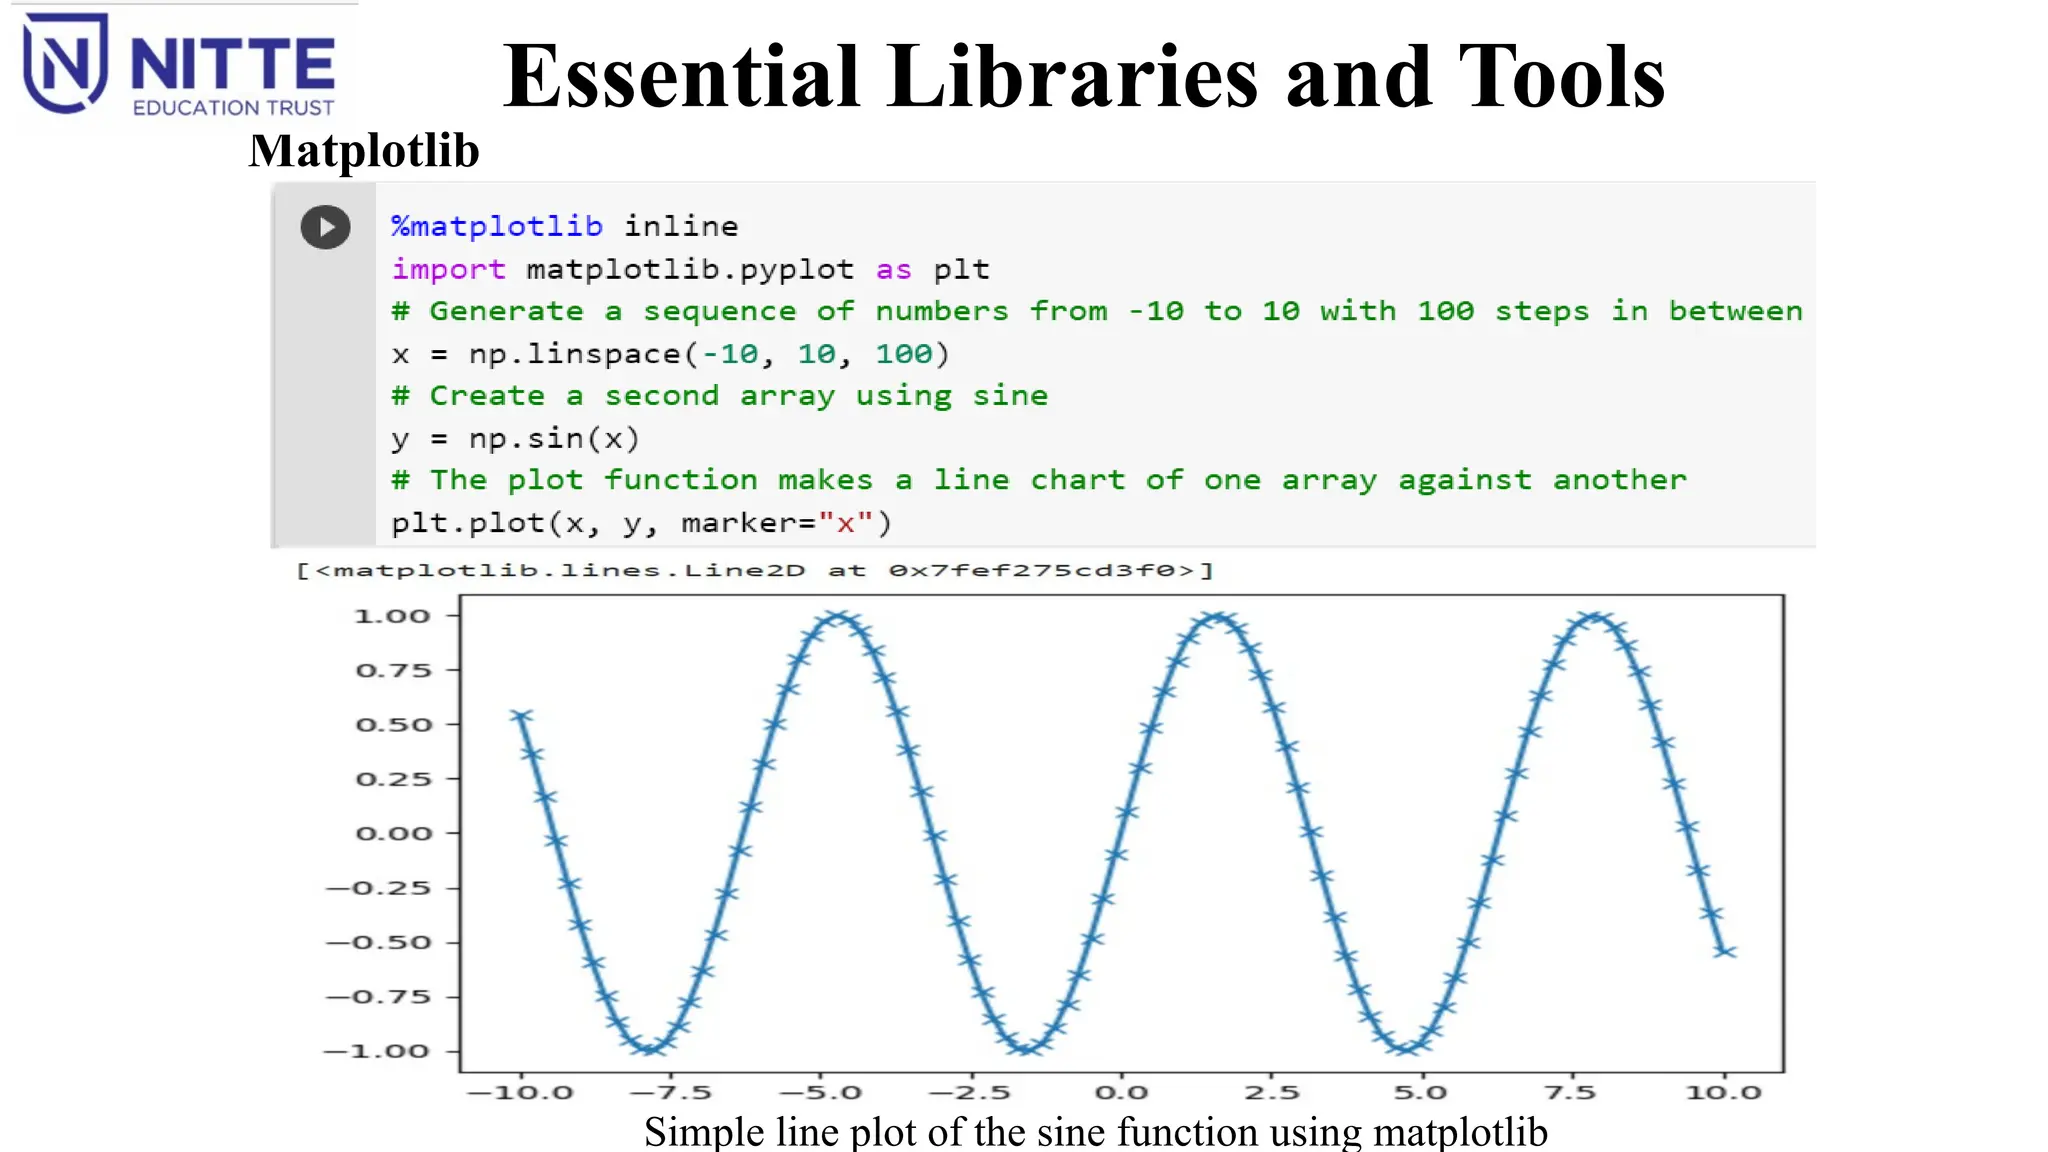
Essential Libraries andTools
Matplotlib
Simple line plot of the sine function using matplotlib
36.
Essential Libraries andTools
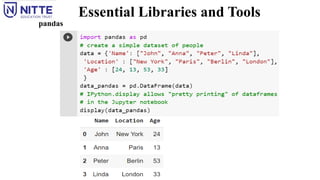
pandas
pandas is a Python library for data wrangling and analysis.
It is built around a data structure called the DataFrame that is modeled after the R DataFrame.
pandas DataFrame is a table, similar to an Excel spreadsheet.
pandas provides a great range of methods to modify and operate on this table; it allows SQL-like queries
and joins of tables.
In contrast to NumPy, which requires that all entries in an array be of the same type, pandas allows each
column to have a separate type (for example, integers, dates, floating-point numbers, and strings).
Ability to ingest from a great variety of file formats and data bases, like SQL, Excel files, and comma-
‐
separated values (CSV) files.
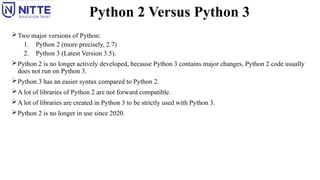
Python 2 VersusPython 3
Two major versions of Python:
1. Python 2 (more precisely, 2.7)
2. Python 3 (Latest Version 3.5).
Python 2 is no longer actively developed, because Python 3 contains major changes, Python 2 code usually
does not run on Python 3.
Python 3 has an easier syntax compared to Python 2.
A lot of libraries of Python 2 are not forward compatible.
A lot of libraries are created in Python 3 to be strictly used with Python 3.
Python 2 is no longer in use since 2020.
Application: Classifying IrisSpecies
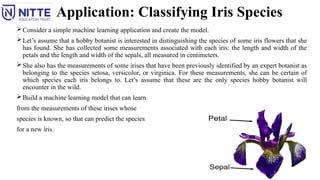
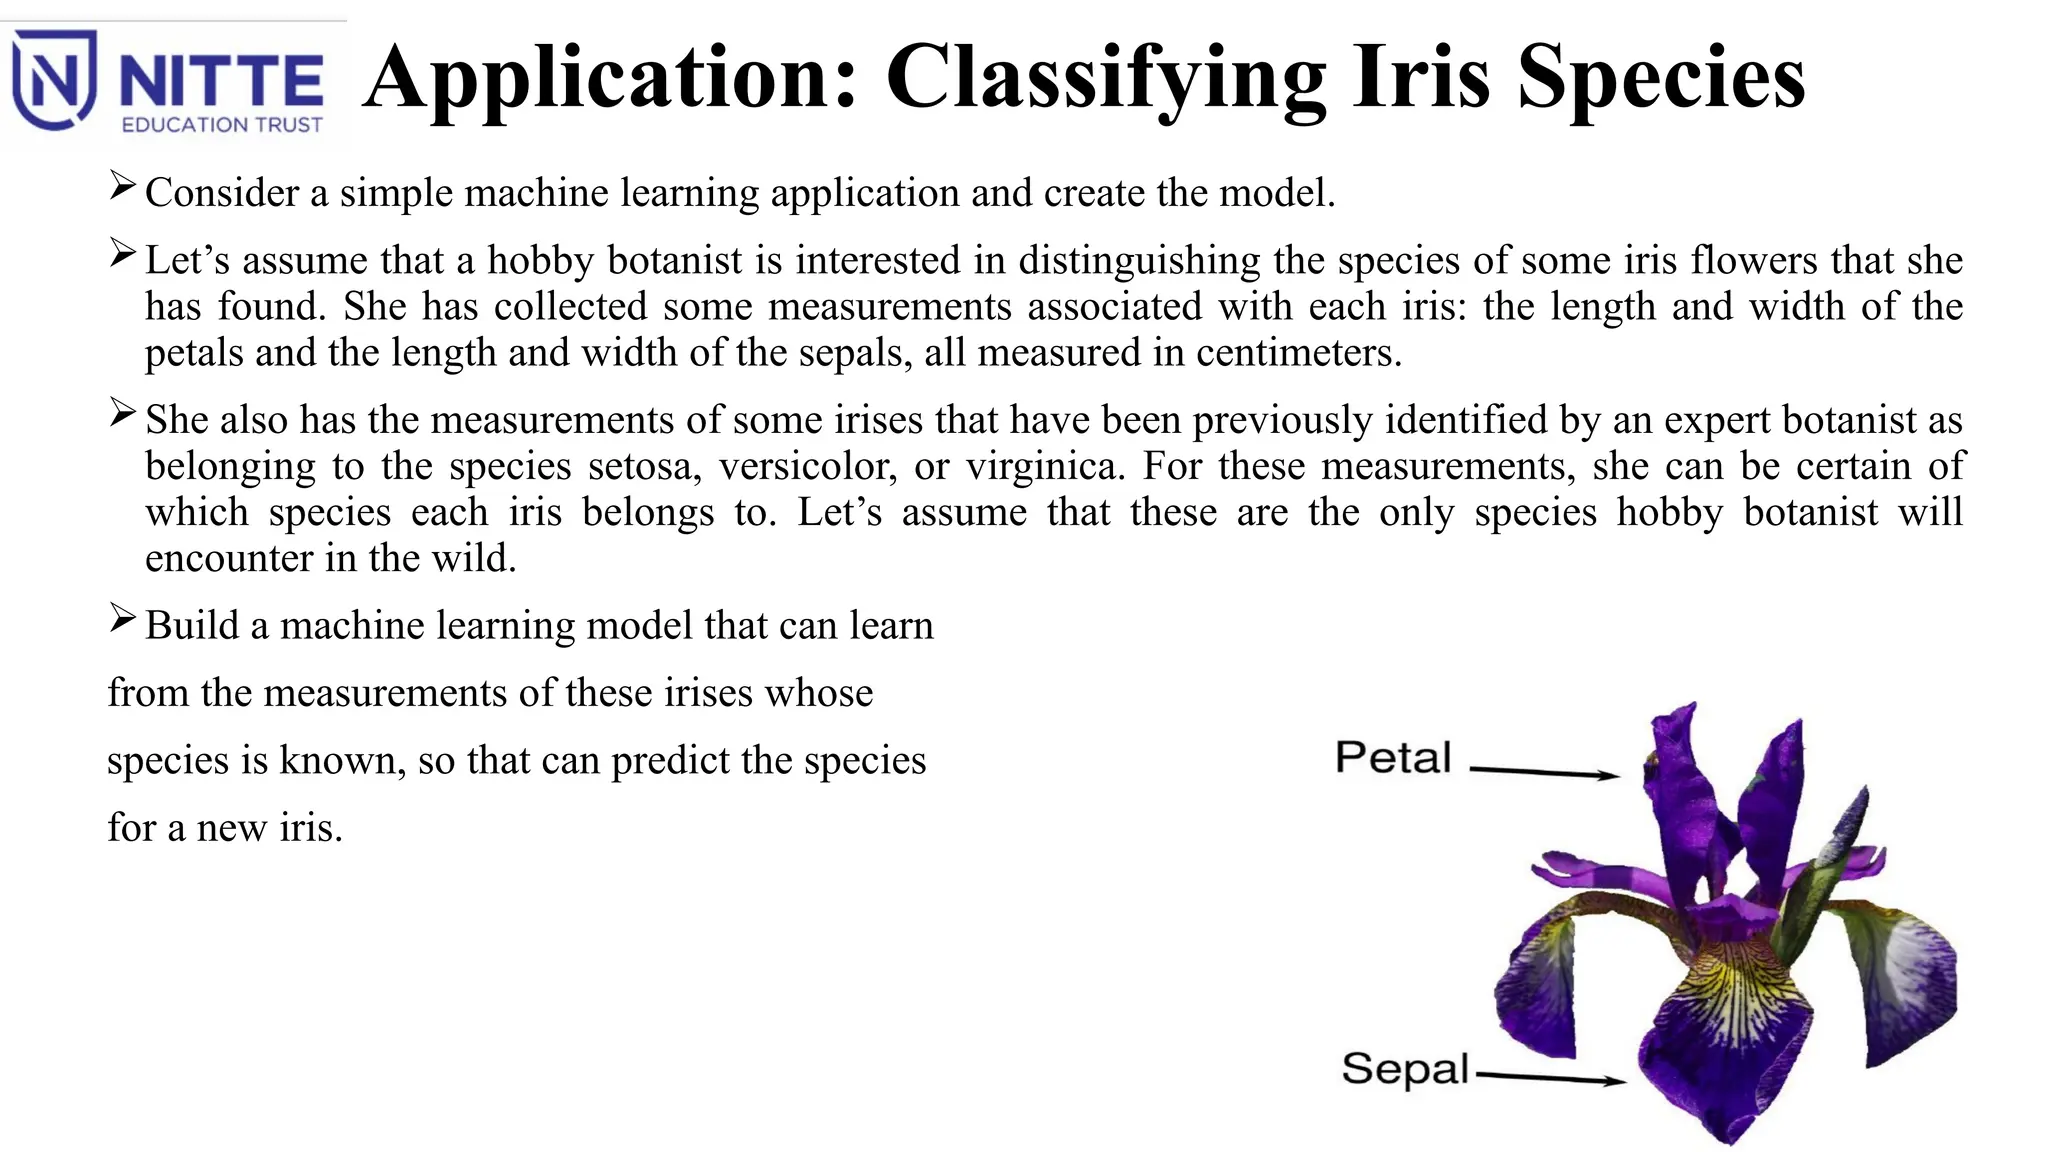
Consider a simple machine learning application and create the model.
Let’s assume that a hobby botanist is interested in distinguishing the species of some iris flowers that she
has found. She has collected some measurements associated with each iris: the length and width of the
petals and the length and width of the sepals, all measured in centimeters.
She also has the measurements of some irises that have been previously identified by an expert botanist as
belonging to the species setosa, versicolor, or virginica. For these measurements, she can be certain of
which species each iris belongs to. Let’s assume that these are the only species hobby botanist will
encounter in the wild.
Build a machine learning model that can learn
from the measurements of these irises whose
species is known, so that can predict the species
for a new iris.
43.
Application: Classifying IrisSpecies
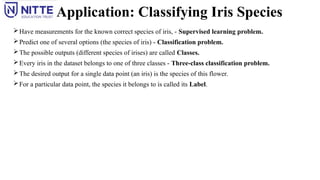
Have measurements for the known correct species of iris, - Supervised learning problem.
Predict one of several options (the species of iris) - Classification problem.
The possible outputs (different species of irises) are called Classes.
Every iris in the dataset belongs to one of three classes - Three-class classification problem.
The desired output for a single data point (an iris) is the species of this flower.
For a particular data point, the species it belongs to is called its Label.
44.
Application: Classifying IrisSpecies
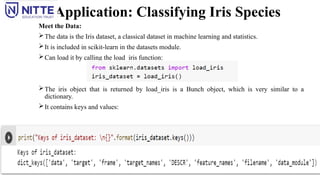
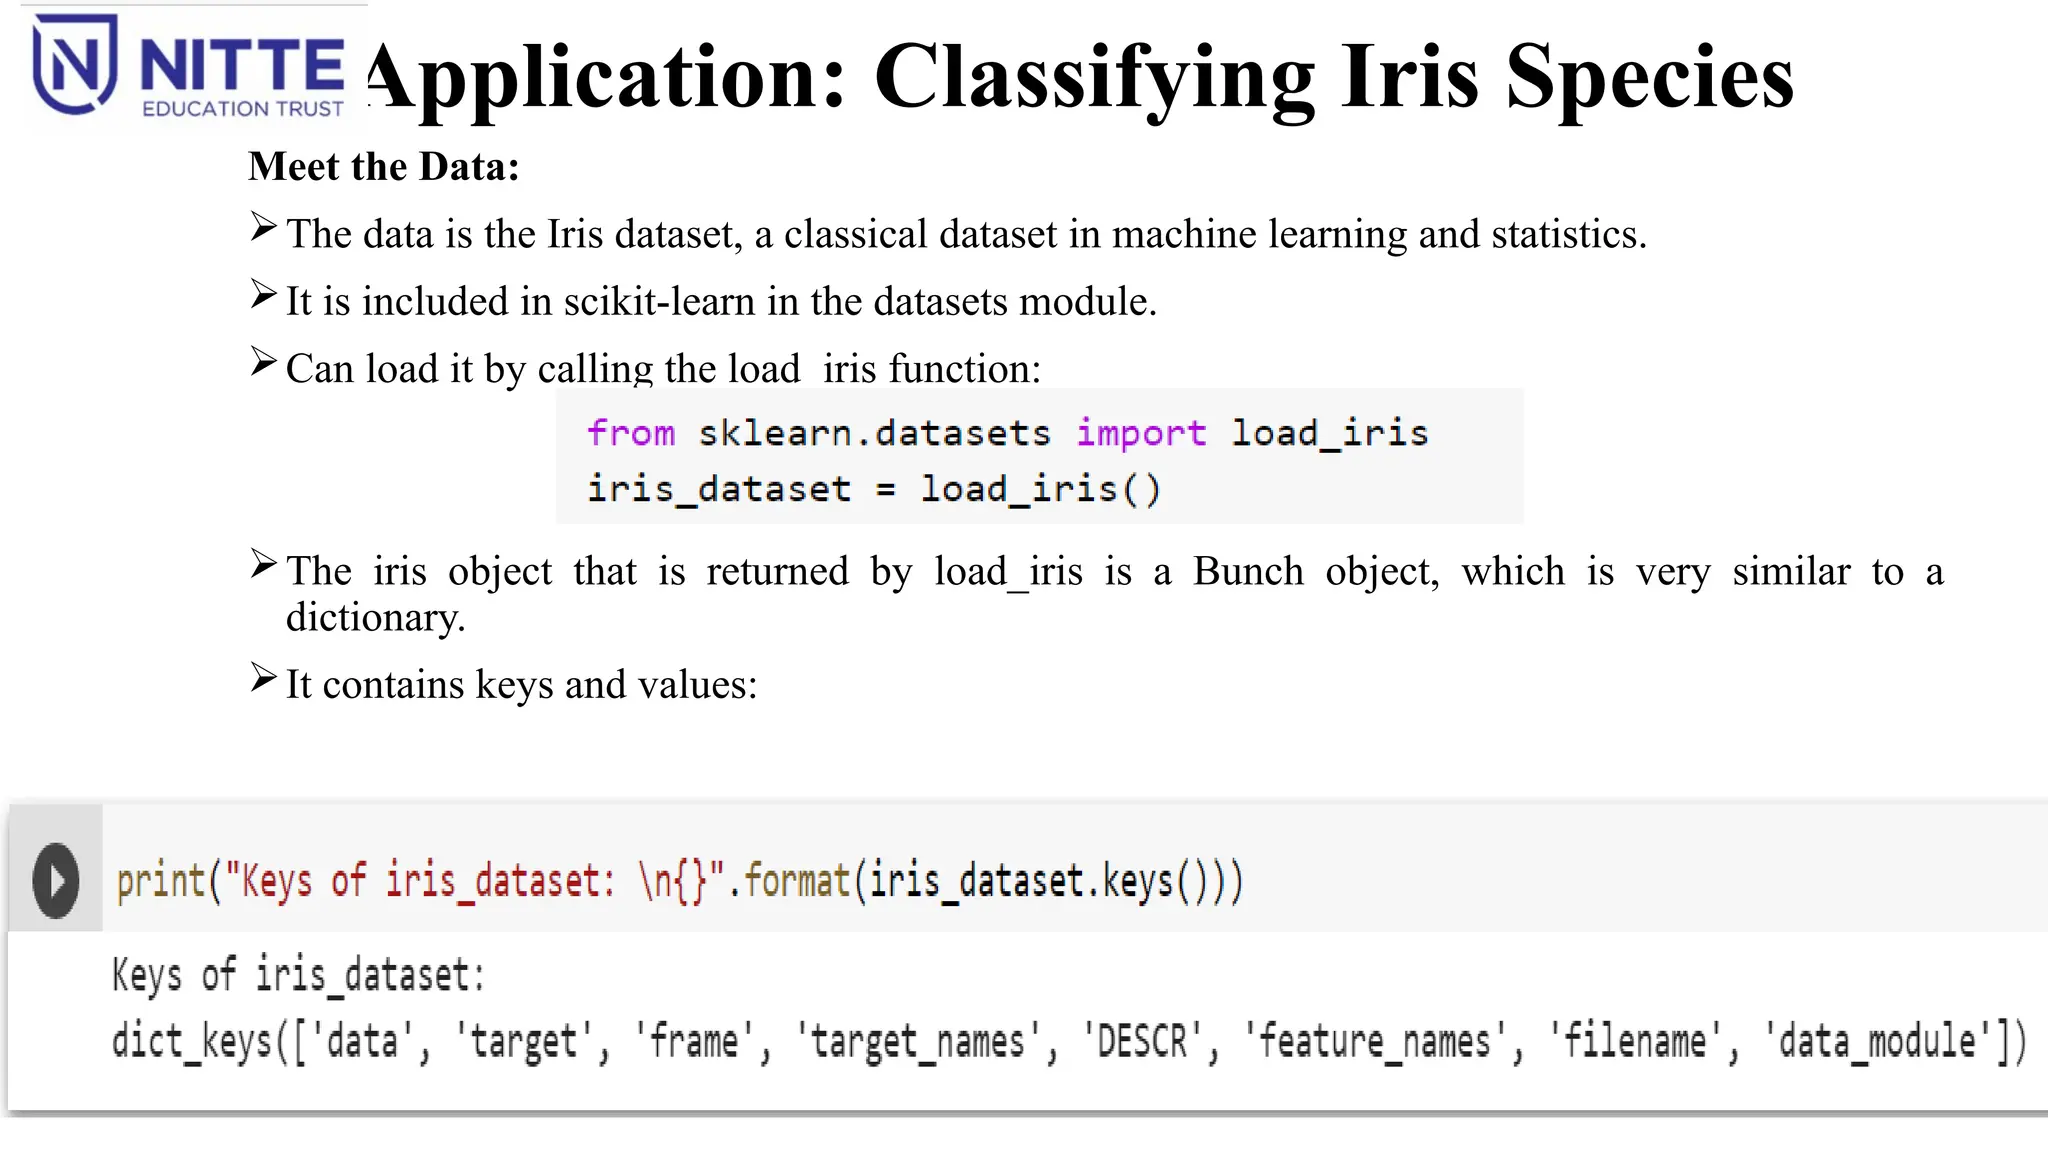
Meet the Data:
The data is the Iris dataset, a classical dataset in machine learning and statistics.
It is included in scikit-learn in the datasets module.
Can load it by calling the load_iris function:
The iris object that is returned by load_iris is a Bunch object, which is very similar to a
dictionary.
It contains keys and values:
45.
Application: Classifying IrisSpecies
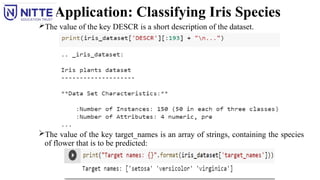
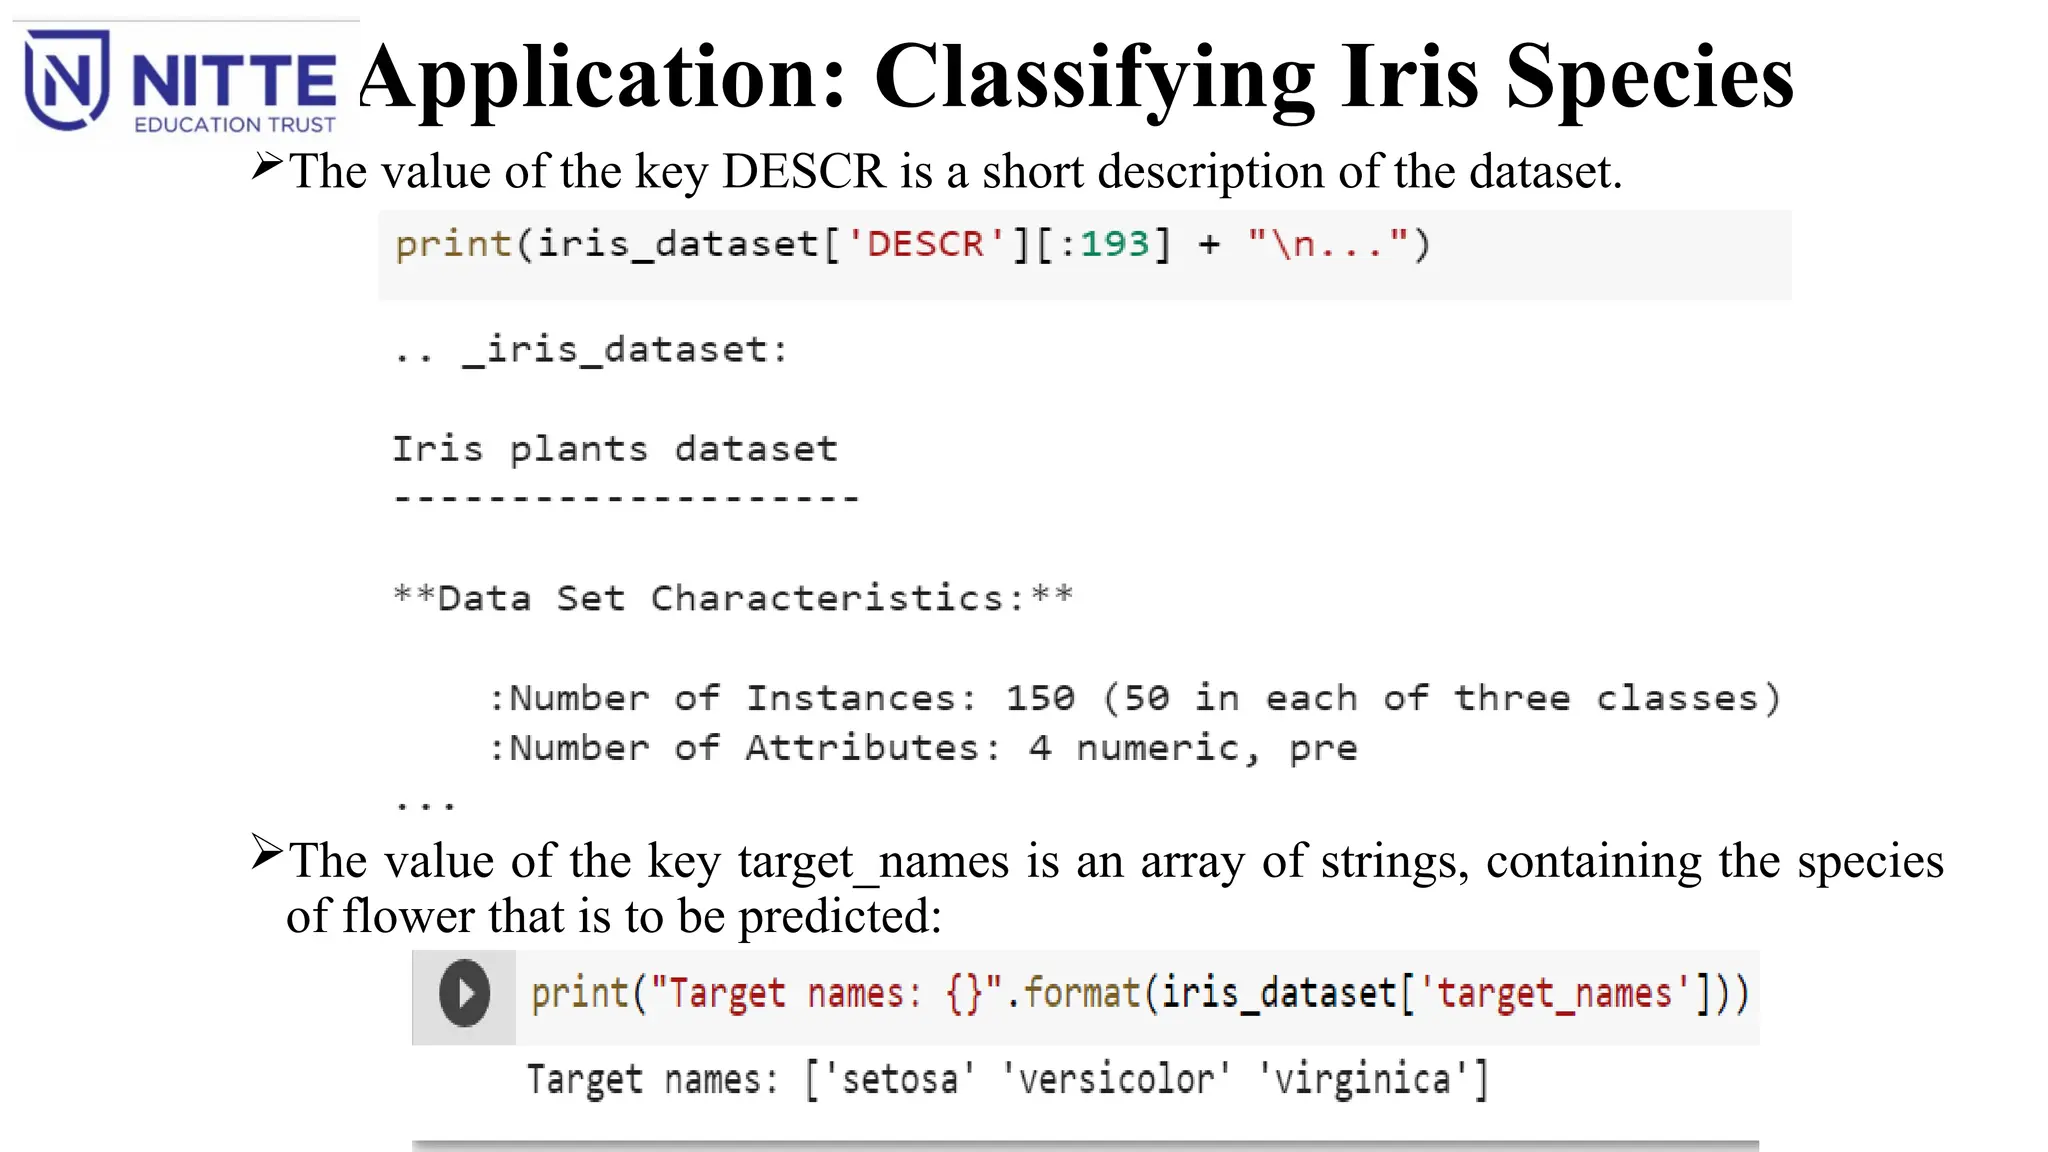
The value of the key DESCR is a short description of the dataset.
The value of the key target_names is an array of strings, containing the species
of flower that is to be predicted:
46.
Application: Classifying IrisSpecies
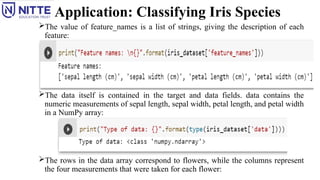
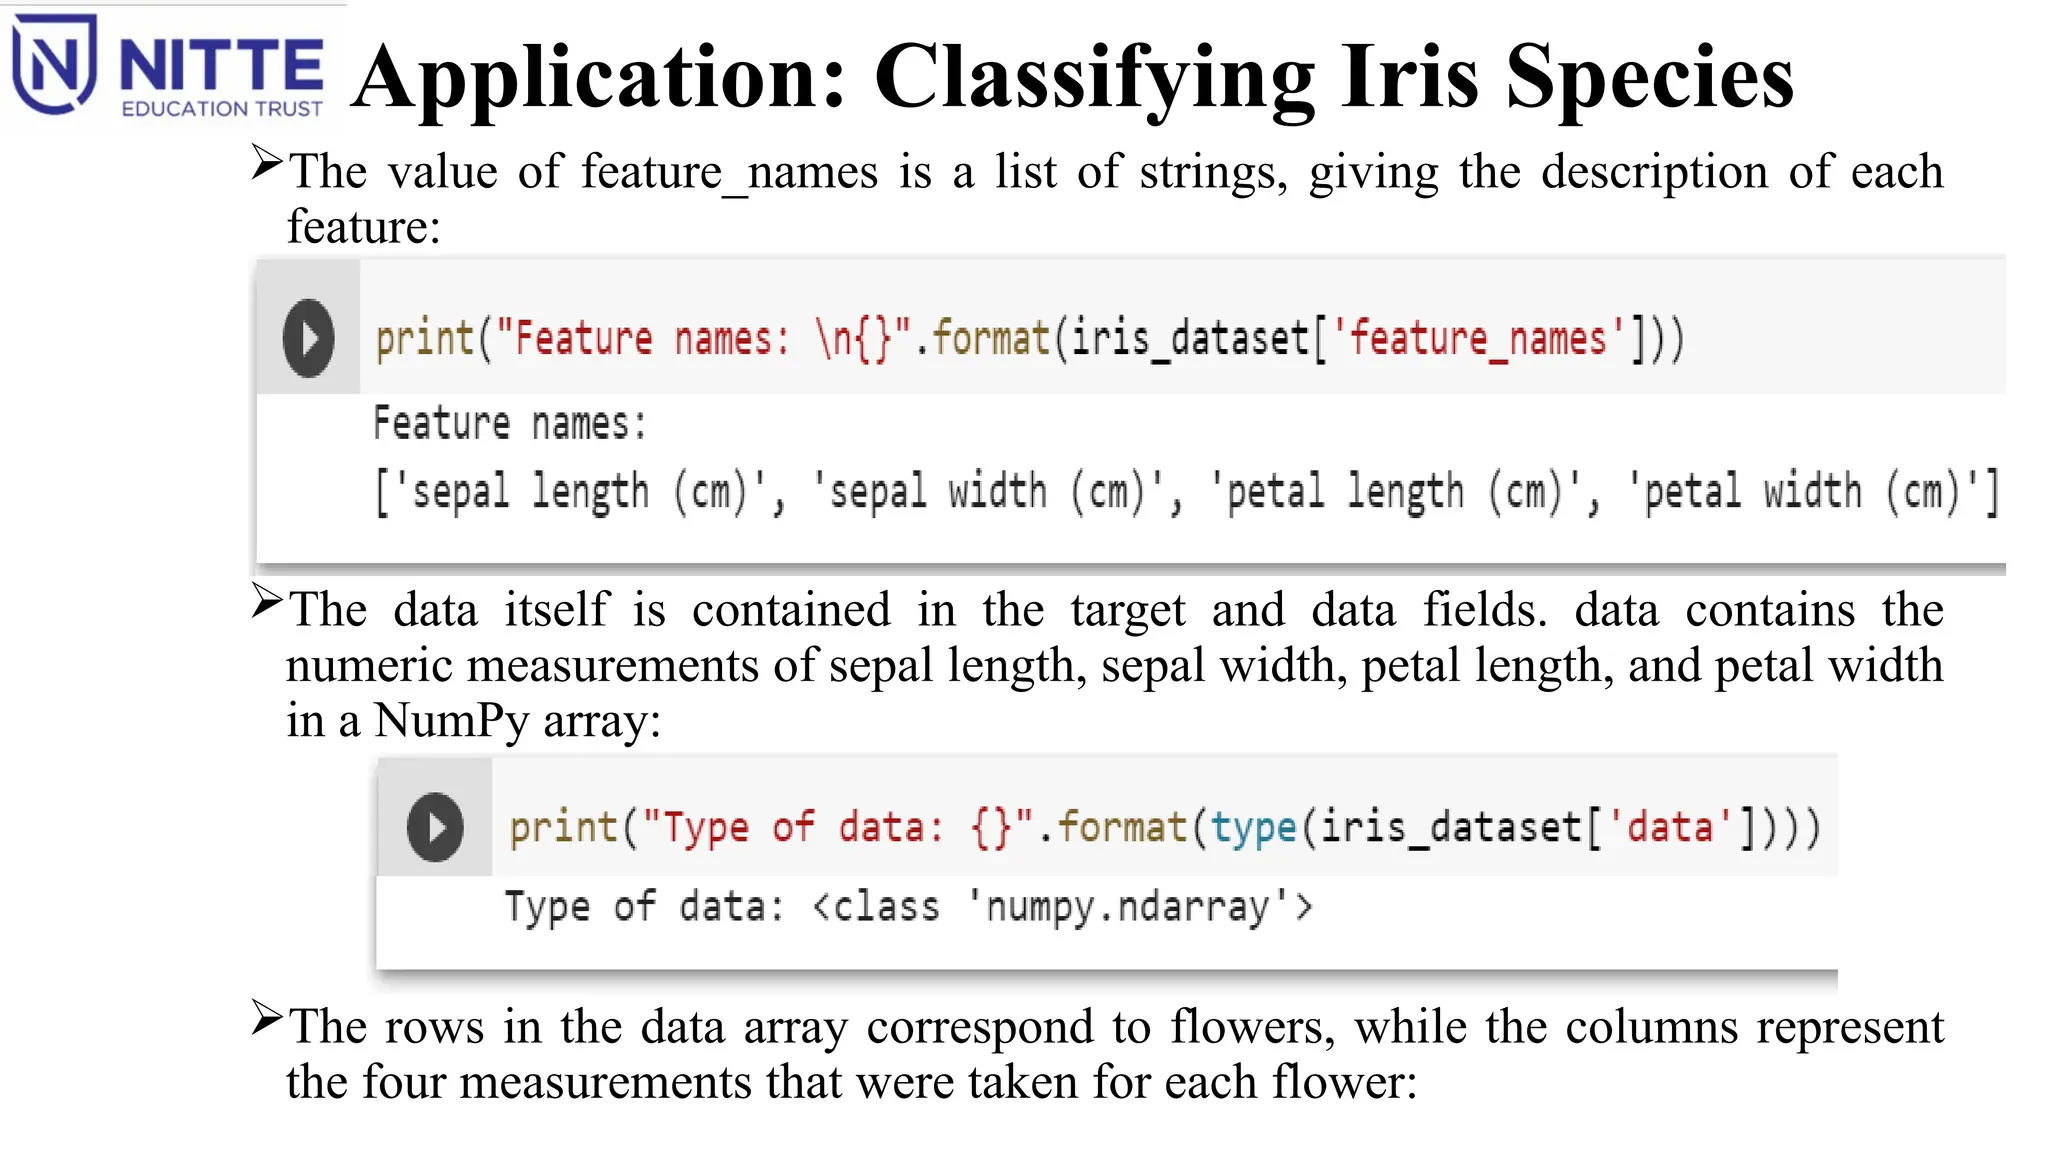
The value of feature_names is a list of strings, giving the description of each
feature:
The data itself is contained in the target and data fields. data contains the
numeric measurements of sepal length, sepal width, petal length, and petal width
in a NumPy array:
The rows in the data array correspond to flowers, while the columns represent
the four measurements that were taken for each flower:
47.
Application: Classifying IrisSpecies
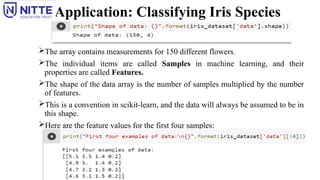
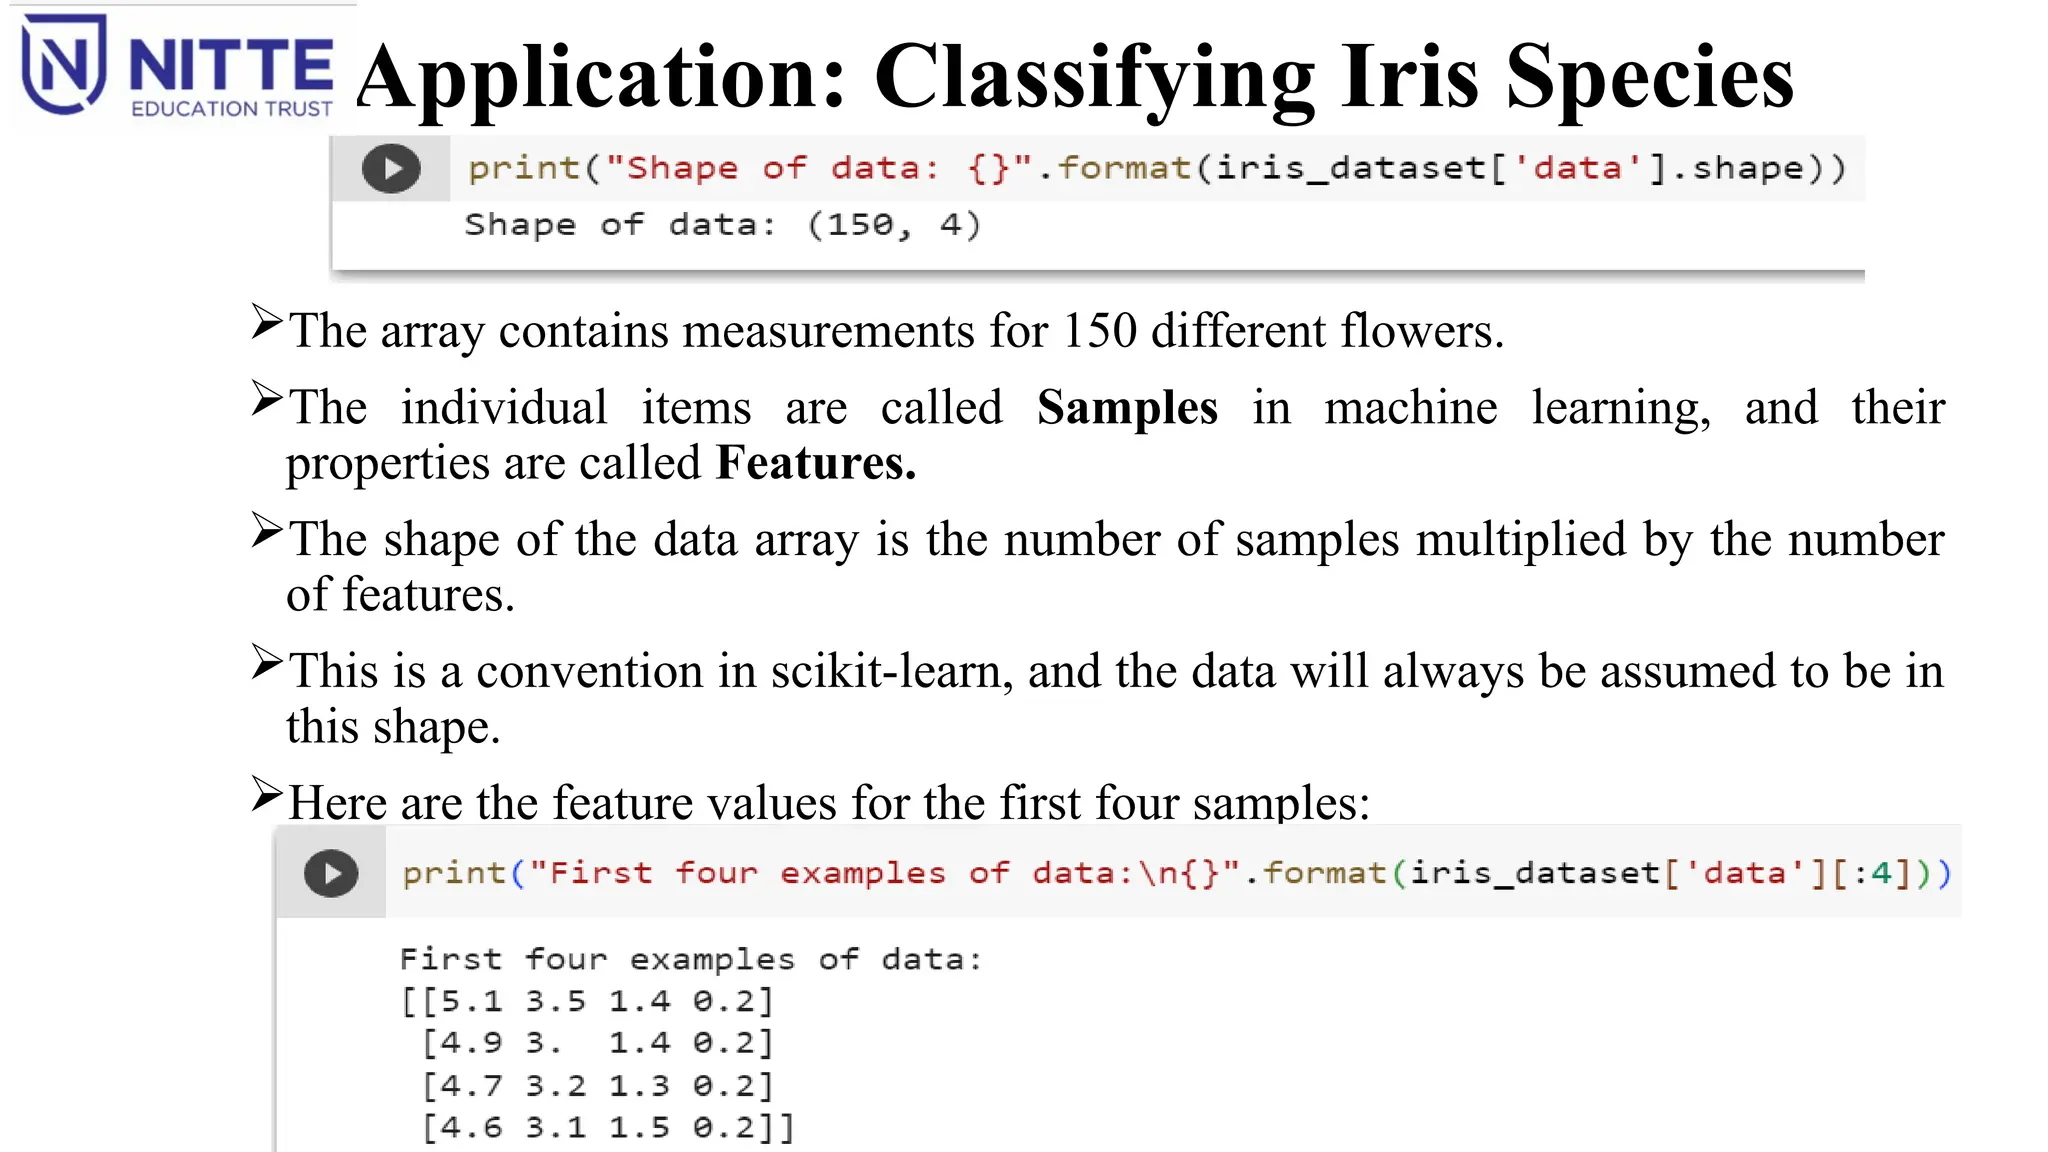
The array contains measurements for 150 different flowers.
The individual items are called Samples in machine learning, and their
properties are called Features.
The shape of the data array is the number of samples multiplied by the number
of features.
This is a convention in scikit-learn, and the data will always be assumed to be in
this shape.
Here are the feature values for the first four samples:
48.
Application: Classifying IrisSpecies
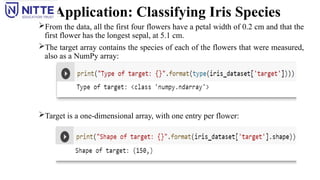
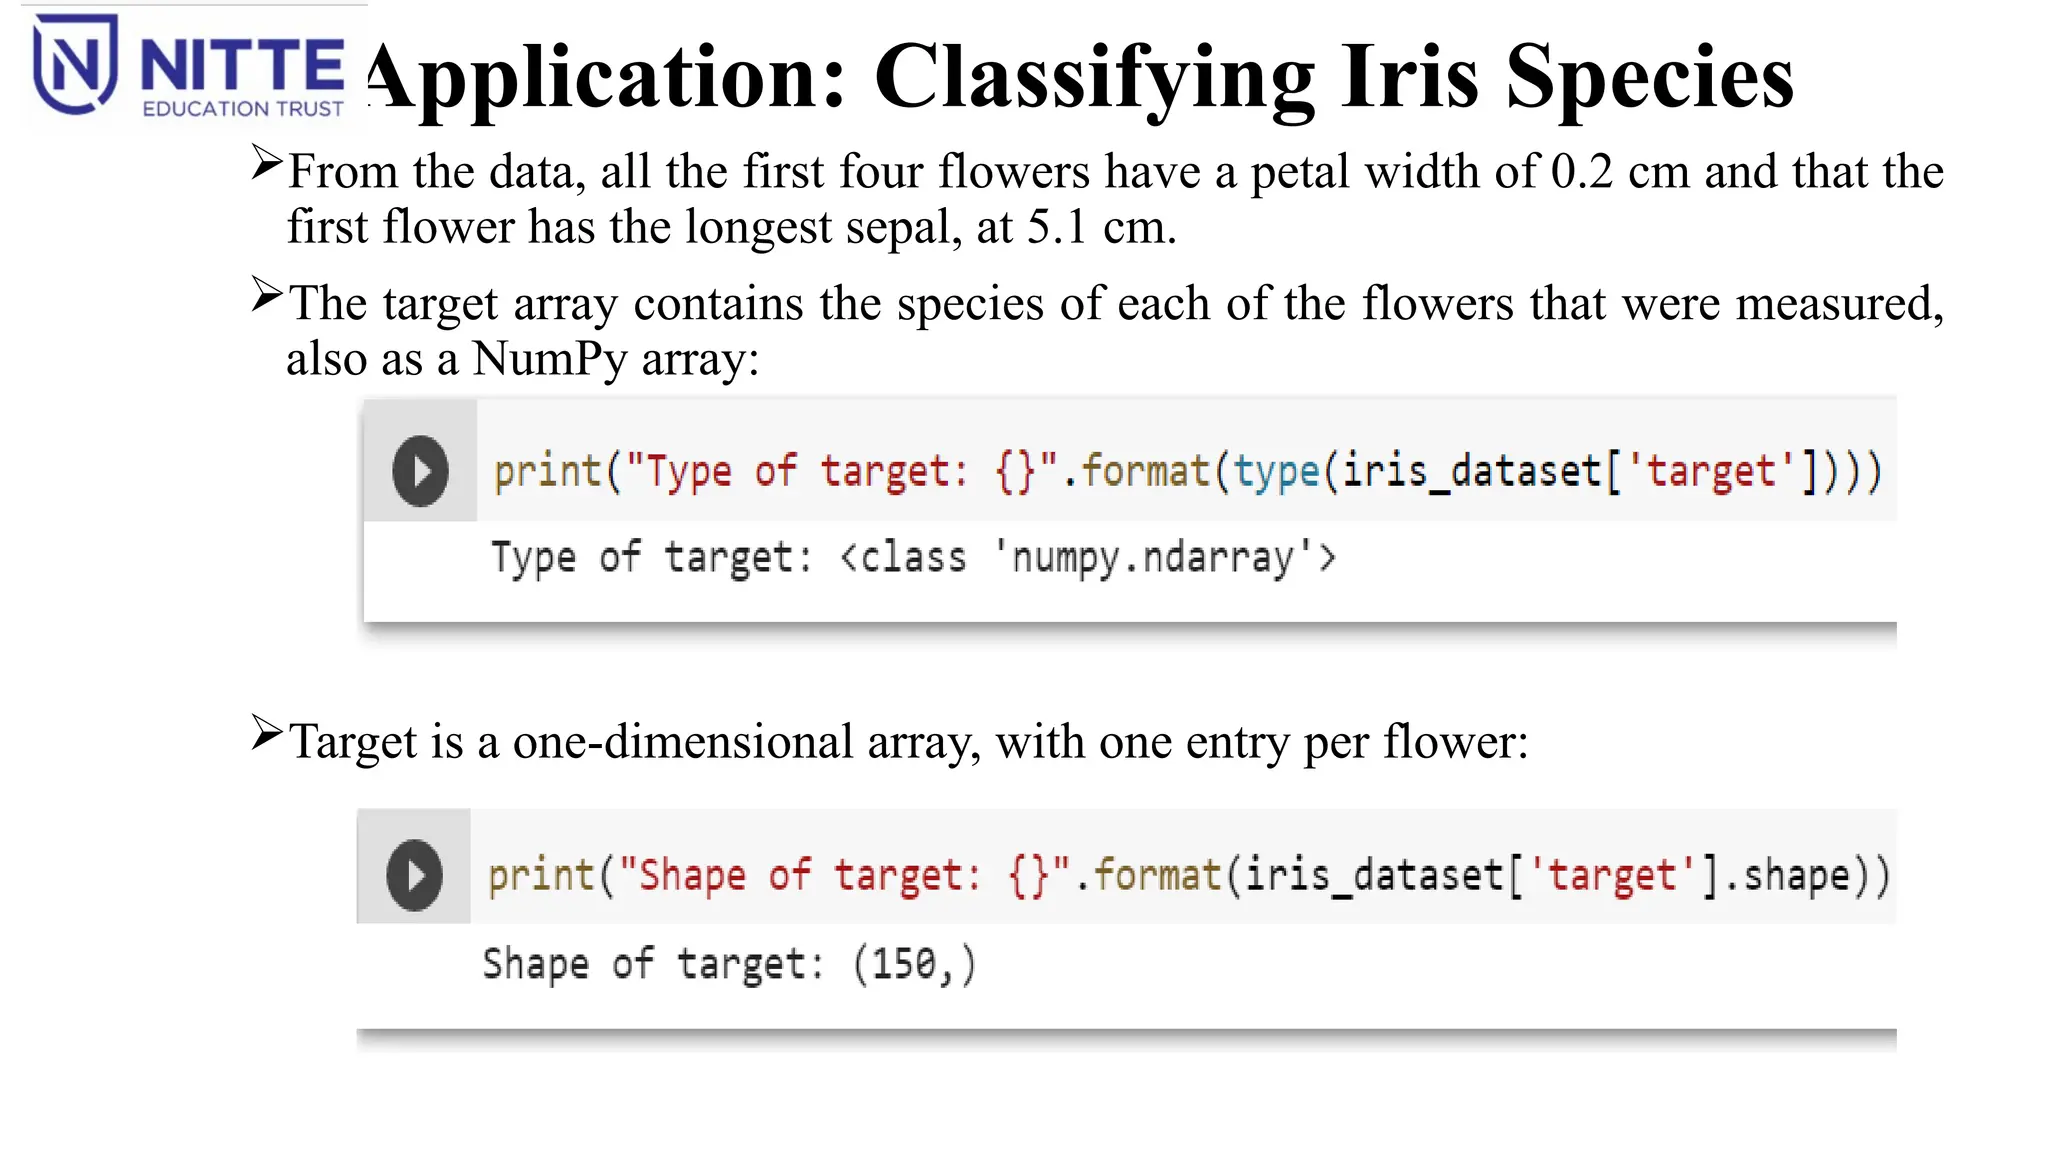
From the data, all the first four flowers have a petal width of 0.2 cm and that the
first flower has the longest sepal, at 5.1 cm.
The target array contains the species of each of the flowers that were measured,
also as a NumPy array:
Target is a one-dimensional array, with one entry per flower:
49.
Application: Classifying IrisSpecies
The species are encoded as integers from 0 to 2:
The meanings of the numbers are given by the iris['target_names'] array:
0 means setosa
1 means versicolor
2 means virginica.
50.
Application: Classifying IrisSpecies
Measuring Success: Training and Testing Data:
To build a ML model from this data that can predict the species of iris for a new set of measurements.
But before apply the model to new measurements, need to know whether it actually works i.e, whether to
trust its predictions.
Cannot use the data that is used to build the model to evaluate it.
Because the model can always remember the whole training set and will always predict the correct label for
any point in the training set.
This “remembering” does not indicate whether model will generalize well.
To assess the model’s performance, use new data which have labels.
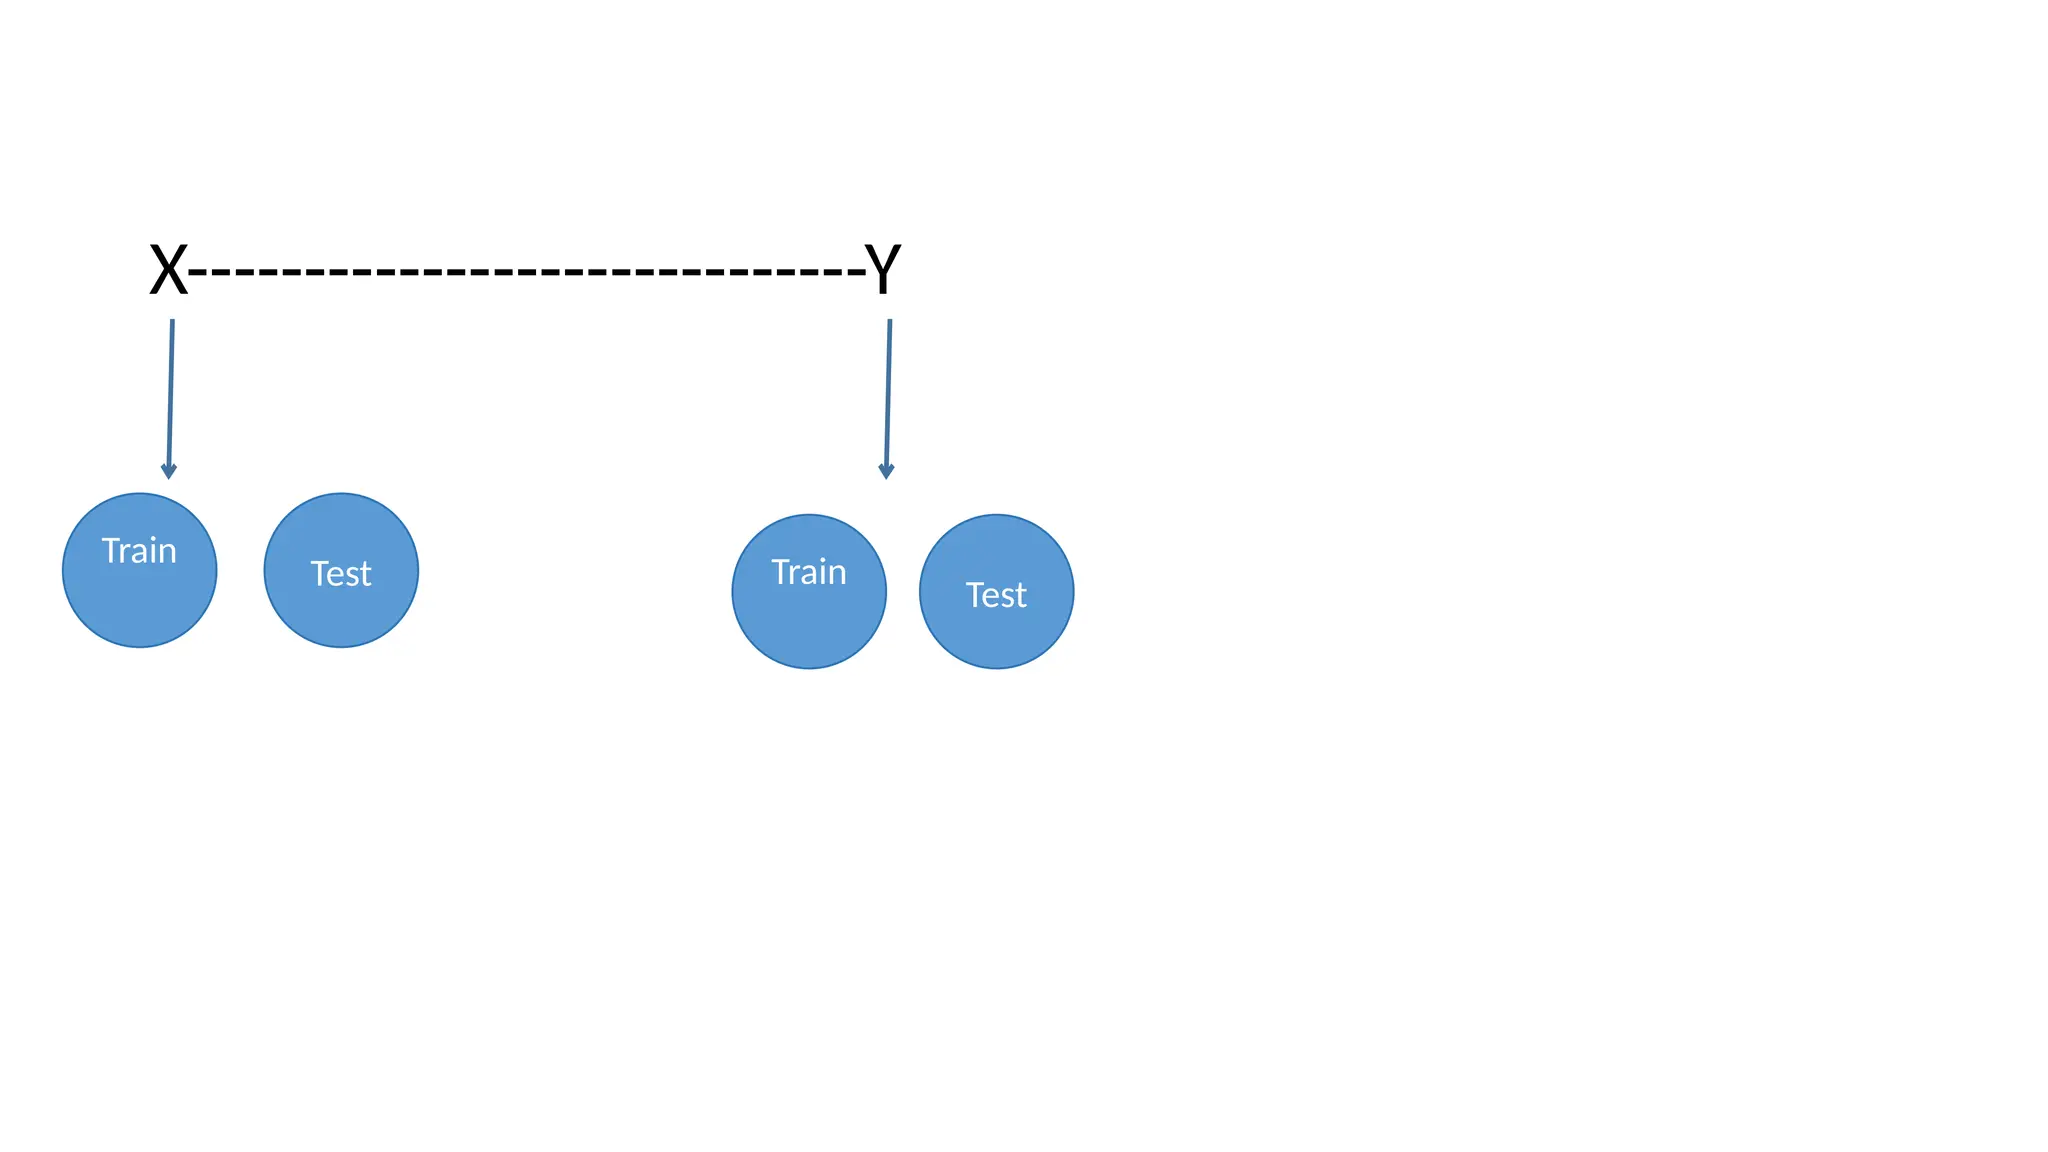
This is usually done by splitting the labeled data into two parts.
1. One part of the data is used to build the ML model, - Training data or Training set.
2. The rest of the data used to assess how well the model works - Test data, Test set, or Hold-out set.
51.
Application: Classifying IrisSpecies
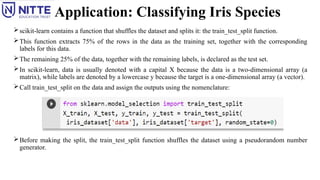
scikit-learn contains a function that shuffles the dataset and splits it: the train_test_split function.
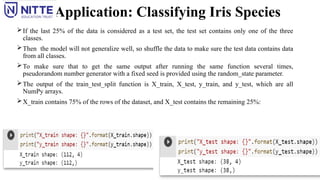
This function extracts 75% of the rows in the data as the training set, together with the corresponding
labels for this data.
The remaining 25% of the data, together with the remaining labels, is declared as the test set.
In scikit-learn, data is usually denoted with a capital X because the data is a two-dimensional array (a
matrix), while labels are denoted by a lowercase y because the target is a one-dimensional array (a vector).
Call train_test_split on the data and assign the outputs using the nomenclature:
Before making the split, the train_test_split function shuffles the dataset using a pseudorandom number
generator.
52.
Application: Classifying IrisSpecies
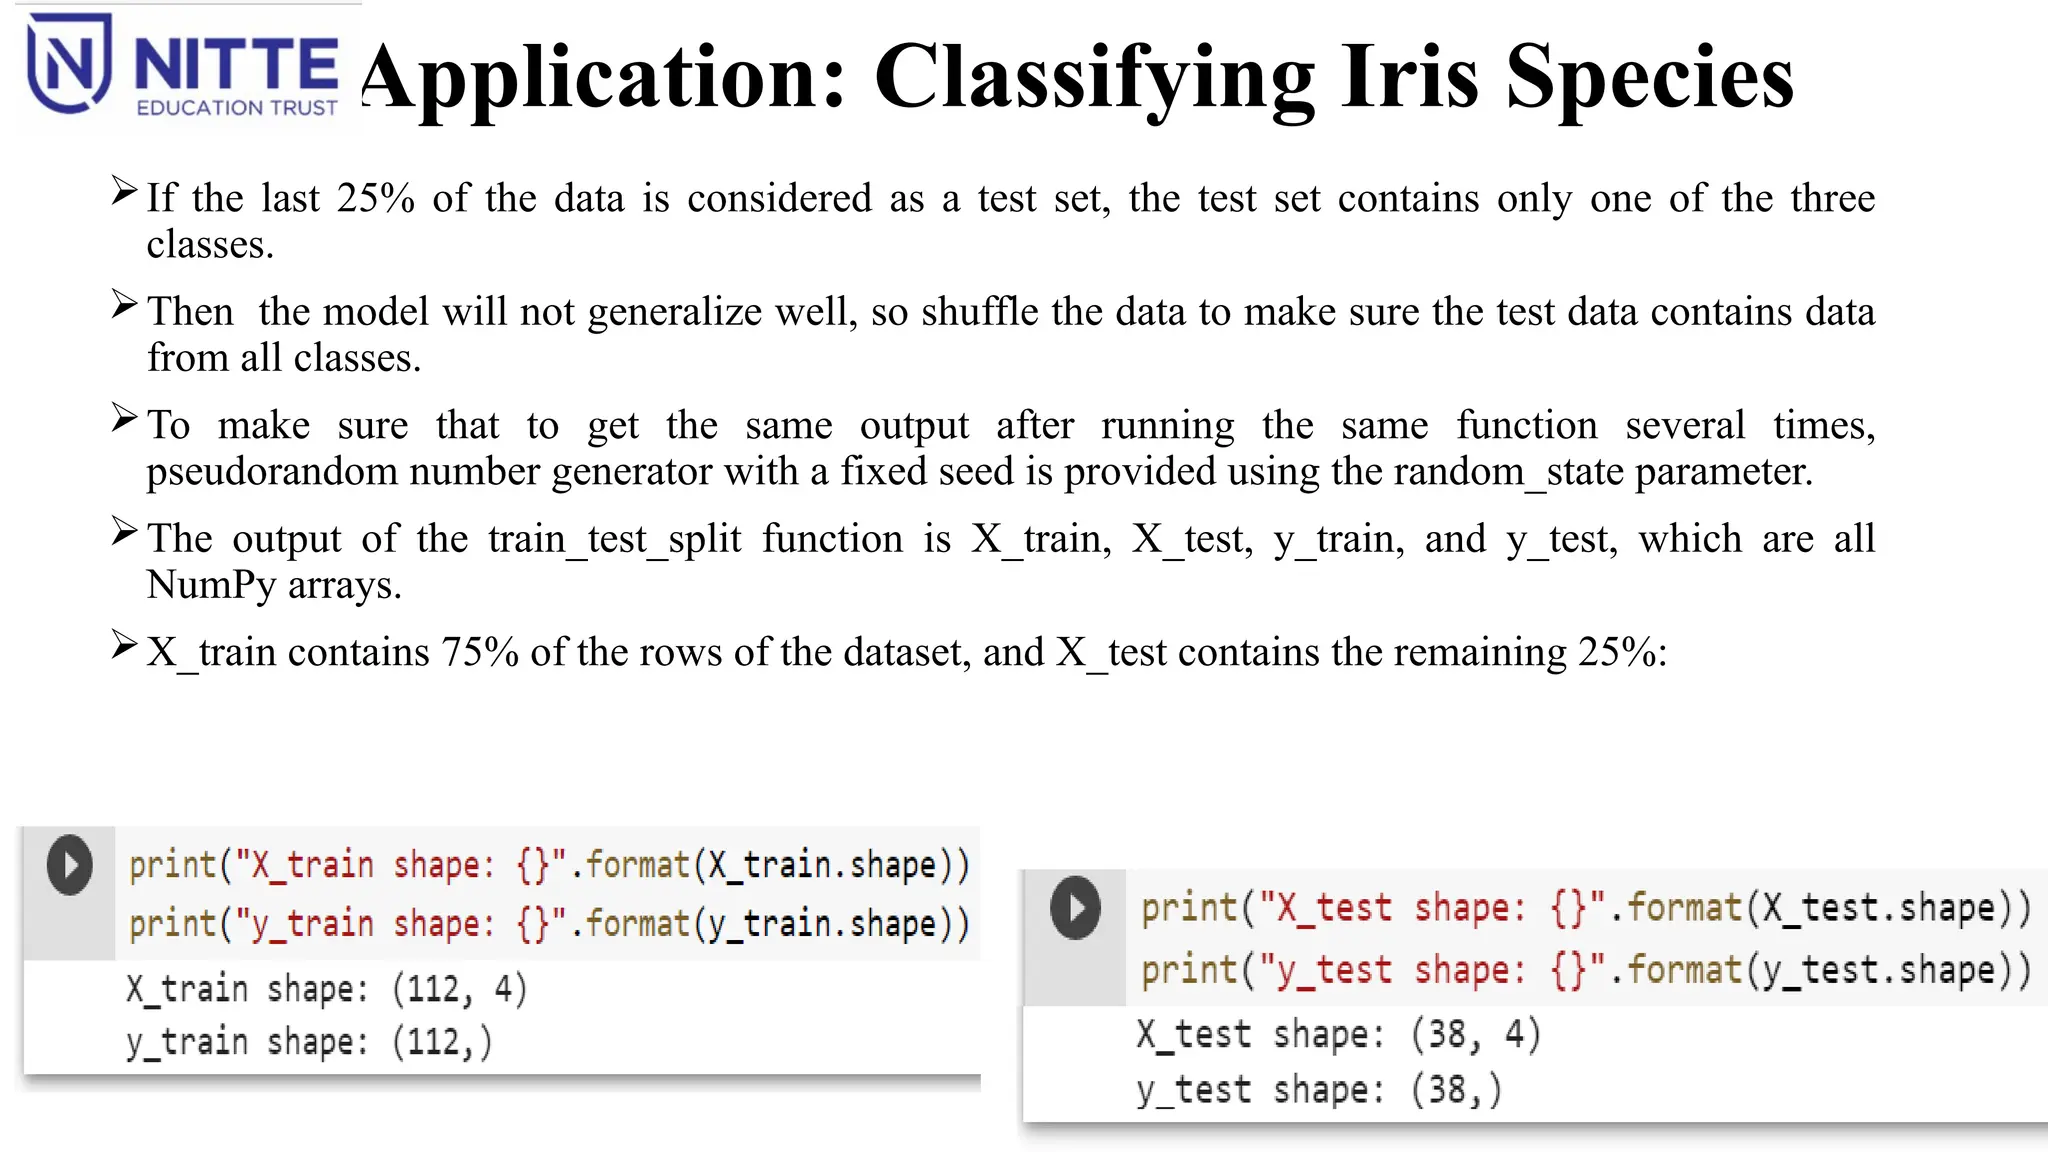
If the last 25% of the data is considered as a test set, the test set contains only one of the three
classes.
Then the model will not generalize well, so shuffle the data to make sure the test data contains data
from all classes.
To make sure that to get the same output after running the same function several times,
pseudorandom number generator with a fixed seed is provided using the random_state parameter.
The output of the train_test_split function is X_train, X_test, y_train, and y_test, which are all
NumPy arrays.
X_train contains 75% of the rows of the dataset, and X_test contains the remaining 25%:
53.
Application: Classifying IrisSpecies
First Things First: Look at Your Data
Before building a ML model, inspect the data, to see if the task is easily solvable without ML, or if the desired
information might not be contained in the data.
Inspecting your data helps to find abnormalities and peculiarities.
Ex: Some of irises were measured using inches and not centimeters.
In the real world, inconsistencies in the data and unexpected measurements are very common.
Visualization is the best ways to inspect data.
Scatter Plot: Puts one feature along the x-axis and another along the y-axis and draws a dot for each data
point.
It is difficult to plot datasets with more than three features.
Pair Plot: Looks at all possible pairs of features.
Pair plot does not show the interaction of all of features at once.
54.
Application: Classifying IrisSpecies
To create the plot, convert the NumPy array into a pandas DataFrame.
pandas has a function to create pair plots called scatter_matrix.
The diagonal of this matrix is filled with histograms of each feature:
55.
Application: Classifying IrisSpecies
From the plots, the three classes seem to be relatively well separated using the sepal and petal
measurements.
A machine learning model will likely be able to learn to separate them.
56.
K-Nearest Neighbor(KNN)
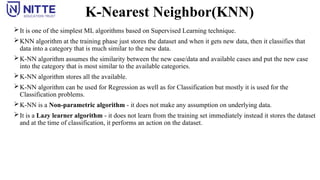
It isone of the simplest ML algorithms based on Supervised Learning technique.
KNN algorithm at the training phase just stores the dataset and when it gets new data, then it classifies that
data into a category that is much similar to the new data.
K-NN algorithm assumes the similarity between the new case/data and available cases and put the new case
into the category that is most similar to the available categories.
K-NN algorithm stores all the available.
K-NN algorithm can be used for Regression as well as for Classification but mostly it is used for the
Classification problems.
K-NN is a Non-parametric algorithm - it does not make any assumption on underlying data.
It is a Lazy learner algorithm - it does not learn from the training set immediately instead it stores the dataset
and at the time of classification, it performs an action on the dataset.
57.
K-Nearest Neighbor(KNN)
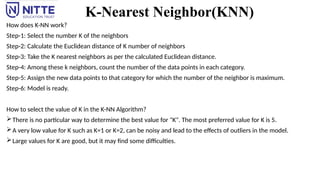
How doesK-NN work?
Step-1: Select the number K of the neighbors
Step-2: Calculate the Euclidean distance of K number of neighbors
Step-3: Take the K nearest neighbors as per the calculated Euclidean distance.
Step-4: Among these k neighbors, count the number of the data points in each category.
Step-5: Assign the new data points to that category for which the number of the neighbor is maximum.
Step-6: Model is ready.
How to select the value of K in the K-NN Algorithm?
There is no particular way to determine the best value for "K". The most preferred value for K is 5.
A very low value for K such as K=1 or K=2, can be noisy and lead to the effects of outliers in the model.
Large values for K are good, but it may find some difficulties.
58.
K-Nearest Neighbor(KNN)
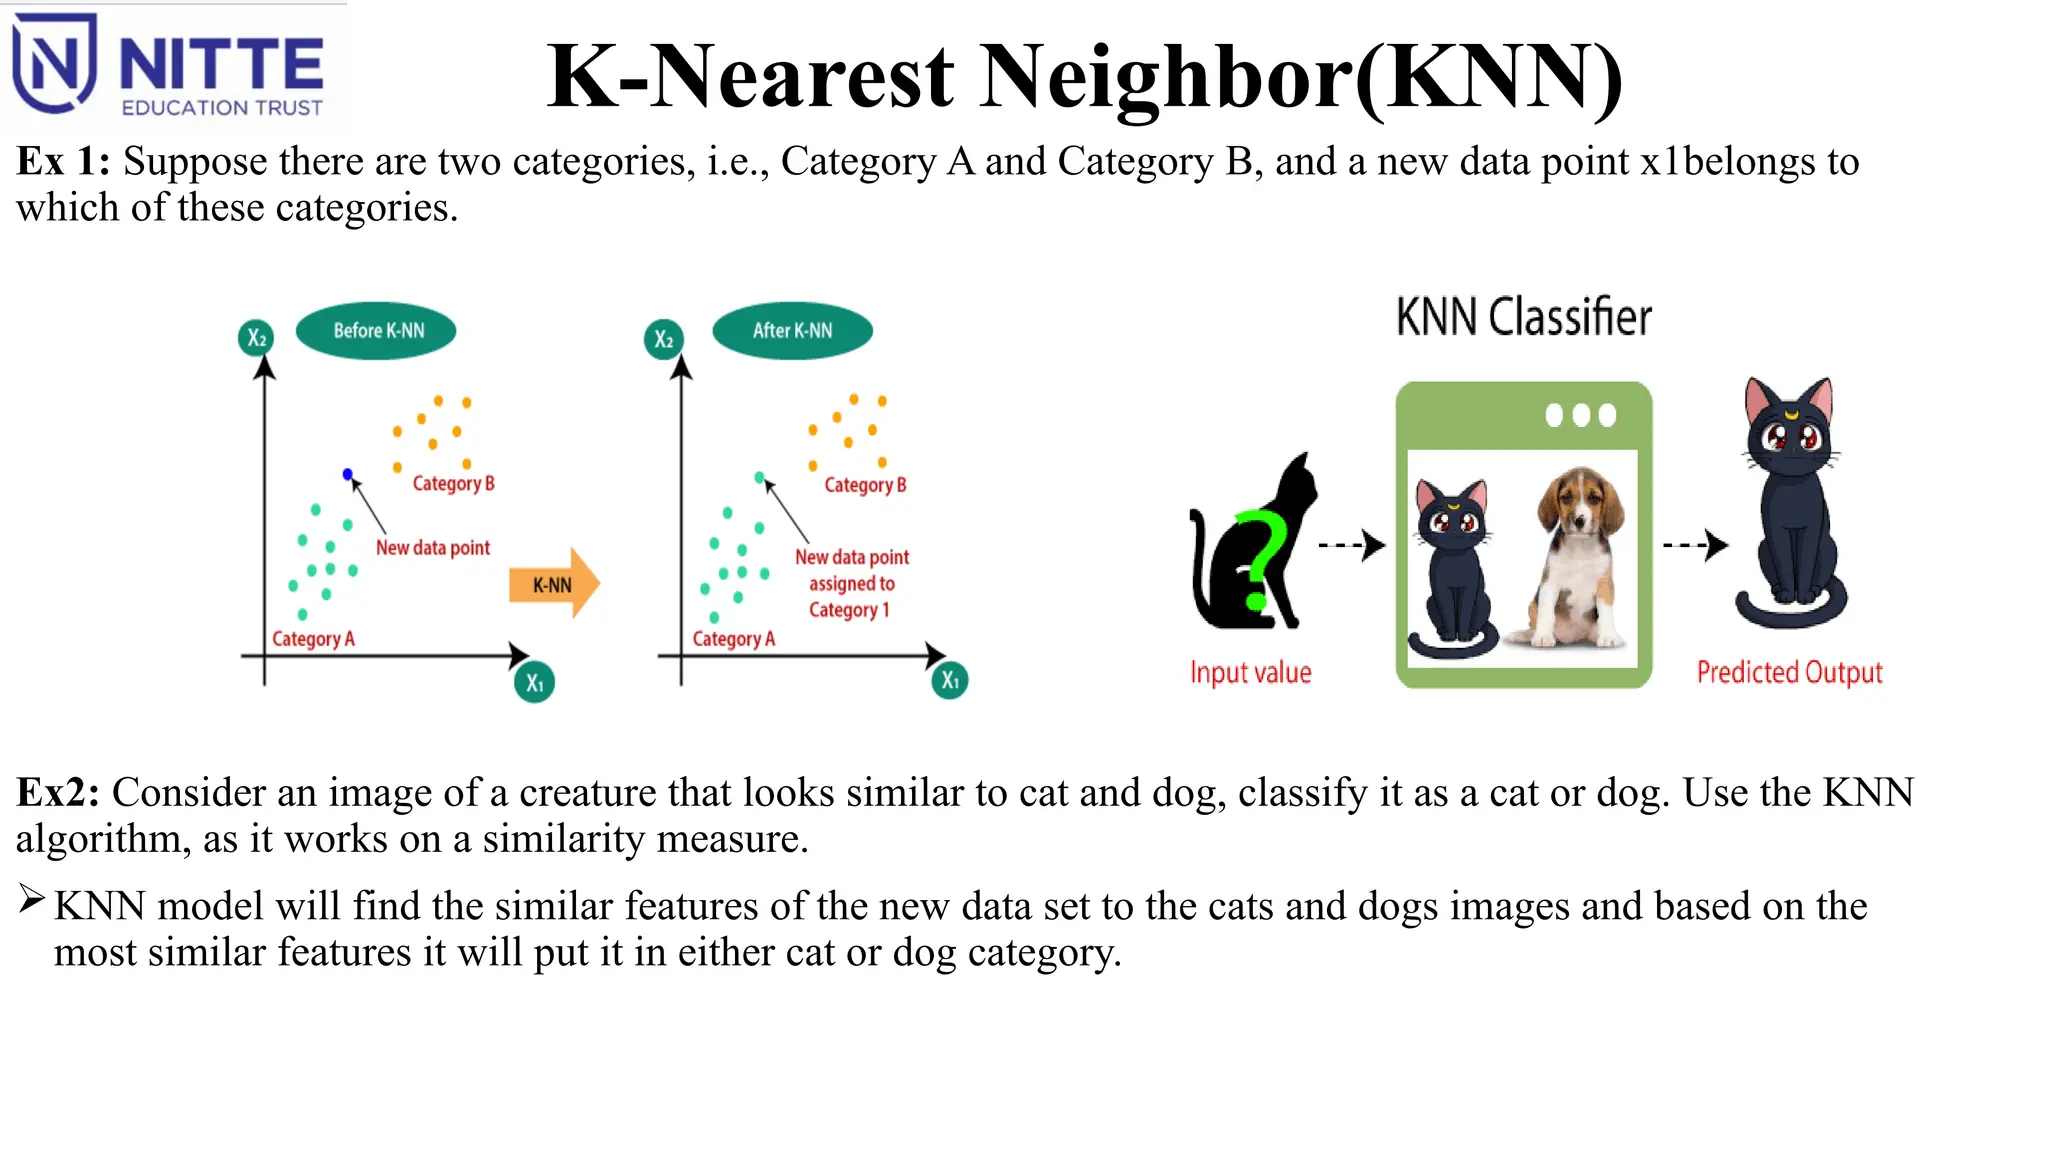
Ex 1:Suppose there are two categories, i.e., Category A and Category B, and a new data point x1belongs to
which of these categories.
Ex2: Consider an image of a creature that looks similar to cat and dog, classify it as a cat or dog. Use the KNN
algorithm, as it works on a similarity measure.
KNN model will find the similar features of the new data set to the cats and dogs images and based on the
most similar features it will put it in either cat or dog category.
59.
K-Nearest Neighbor(KNN)
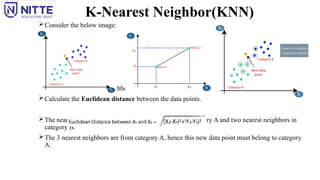
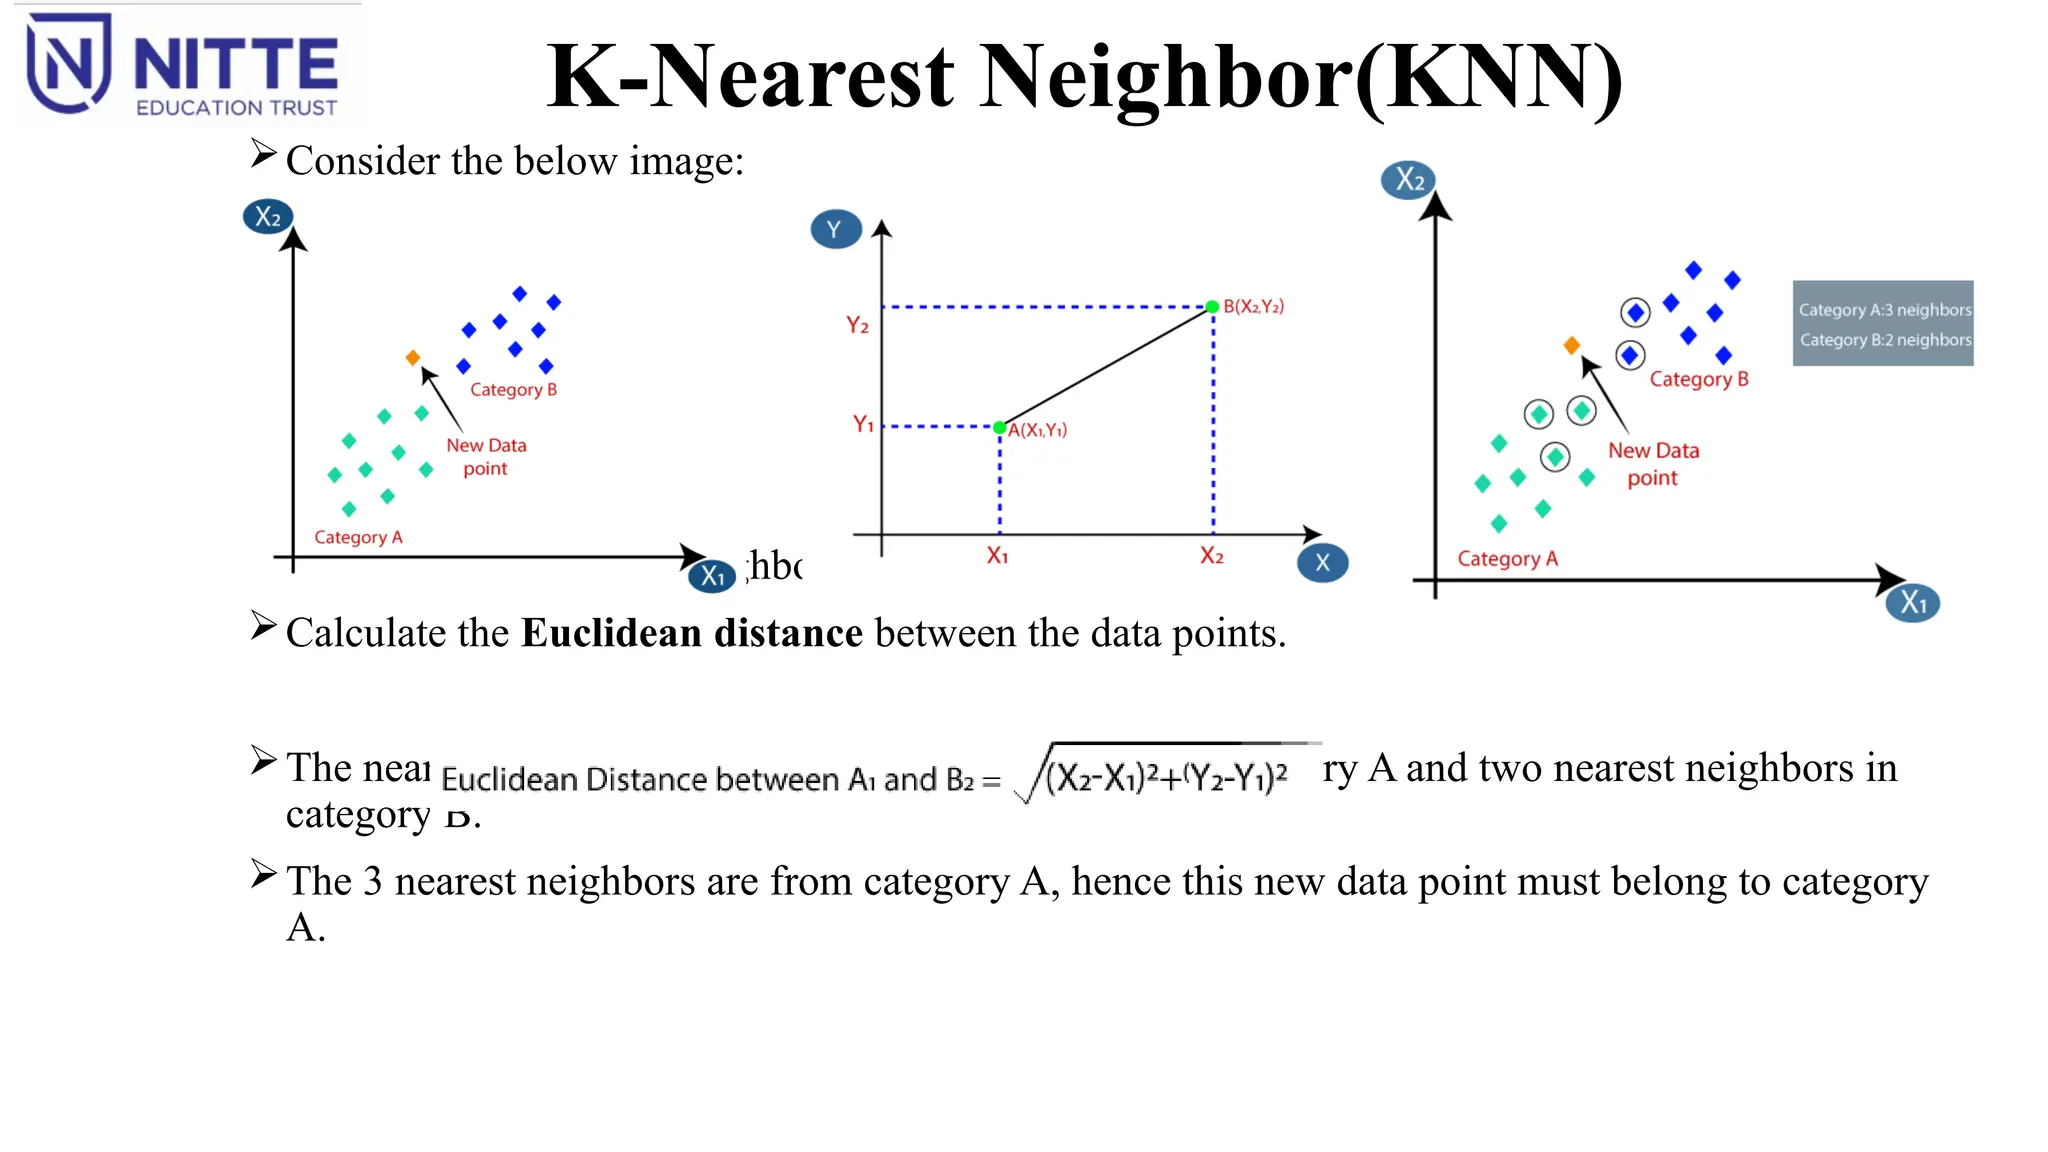
Consider thebelow image:
Choose the number of neighbors, choose k=5.
Calculate the Euclidean distance between the data points.
The nearest neighbors, are: three nearest neighbors in category A and two nearest neighbors in
category B.
The 3 nearest neighbors are from category A, hence this new data point must belong to category
A.
60.
K-Nearest Neighbor(KNN)
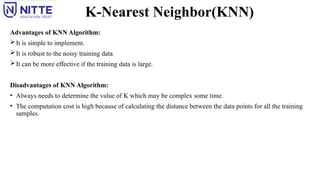
Advantages ofKNN Algorithm:
It is simple to implement.
It is robust to the noisy training data
It can be more effective if the training data is large.
Disadvantages of KNN Algorithm:
• Always needs to determine the value of K which may be complex some time.
• The computation cost is high because of calculating the distance between the data points for all the training
samples.
61.
Application: Classifying IrisSpecies
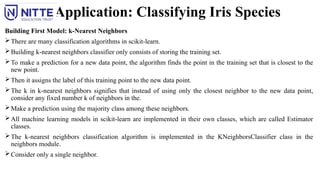
Building First Model: k-Nearest Neighbors
There are many classification algorithms in scikit-learn.
Building k-nearest neighbors classifier only consists of storing the training set.
To make a prediction for a new data point, the algorithm finds the point in the training set that is closest to the
new point.
Then it assigns the label of this training point to the new data point.
The k in k-nearest neighbors signifies that instead of using only the closest neighbor to the new data point,
consider any fixed number k of neighbors in the.
Make a prediction using the majority class among these neighbors.
All machine learning models in scikit-learn are implemented in their own classes, which are called Estimator
classes.
The k-nearest neighbors classification algorithm is implemented in the KNeighborsClassifier class in the
neighbors module.
Consider only a single neighbor.
62.
Application: Classifying IrisSpecies
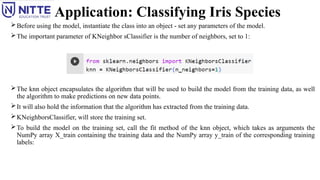
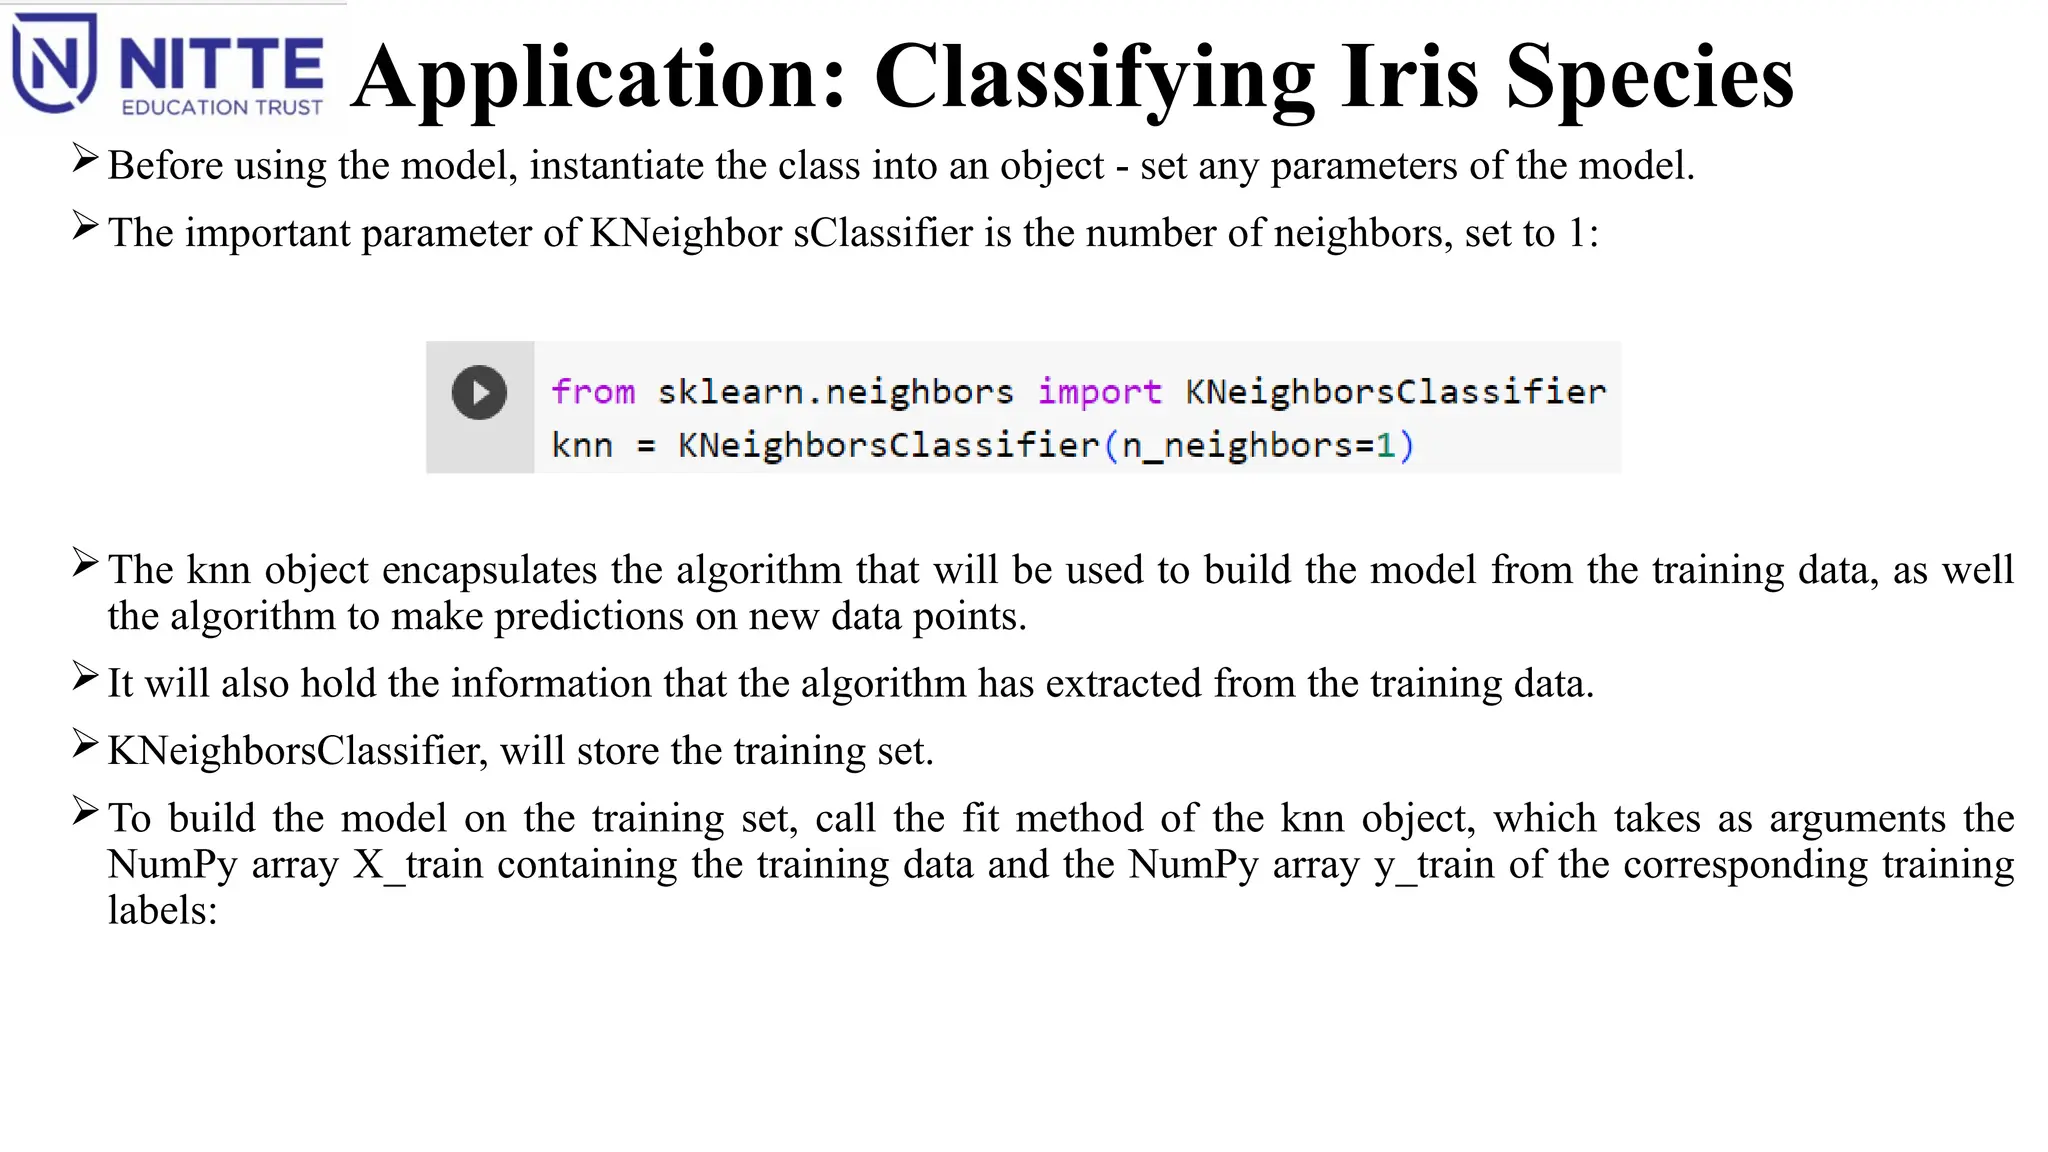
Before using the model, instantiate the class into an object - set any parameters of the model.
The important parameter of KNeighbor sClassifier is the number of neighbors, set to 1:
The knn object encapsulates the algorithm that will be used to build the model from the training data, as well
the algorithm to make predictions on new data points.
It will also hold the information that the algorithm has extracted from the training data.
KNeighborsClassifier, will store the training set.
To build the model on the training set, call the fit method of the knn object, which takes as arguments the
NumPy array X_train containing the training data and the NumPy array y_train of the corresponding training
labels:
63.
step 1: loadthe data sets from sklearn
*****--------------------*****
from sklearn.datasets import load_iris
iris=load_iris()
step 2 : As the dataset is a dictionary check the keys
---------------------------------------------------------------
***********to check the keys******************
print("keys of datasets:n".format(iris.keys()))
----------------------------------------------------------------
step 3 : divide the data for training and testing
from sklearn.model_selection import train_test_split
X_train,X_test, y_train , y_test = train_test_split(----------------)
X_train,X_test, y_train , y_test = train_test_split(iris['data'],iris['target'], random state = 0)
---------------------------------------------------------------------
step 4 : use a suitable model for classifying the data in the datasets
from sklearn.neighbors import KNeighboursClassifier
knn=KNeighboursClassifier(n_neighbour=1)
knn.fit(X_train,y_train)
-------------------------------------------------
step 5: predict for a new data point
X_new=np.array([[5,2.9,1,0.2]])
prediction = knn.predict(X_new)
-------------------------------------------------
Step 6 : Evaluation of the model
y_pred = knn.predict(X_test)
64.
Application: Classifying IrisSpecies
The fit method returns the knn object itself (and modifies it in place), so get a string representation of the
classifier.
The representation shows which parameters were used in creating the model.
Nearly all of them are the default values, but you can also find n_neighbors=1, which is the parameter that we
passed.
Most models in scikit-learn have many parameters, but the majority of them are either speed optimizations or
for very special use cases.
You don’t have to worry about the other parameters shown in this representation.
Printing a scikit-learn model can yield very long strings, but don’t be intimidated by these. We will cover all the
important parameters in Chapter 2. In the remainder of this book, we will not show the output of fit because it
doesn’t contain any new information.
65.
Application: Classifying IrisSpecies
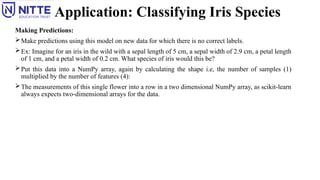
Making Predictions:
Make predictions using this model on new data for which there is no correct labels.
Ex: Imagine for an iris in the wild with a sepal length of 5 cm, a sepal width of 2.9 cm, a petal length
of 1 cm, and a petal width of 0.2 cm. What species of iris would this be?
Put this data into a NumPy array, again by calculating the shape i.e, the number of samples (1)
multiplied by the number of features (4):
The measurements of this single flower into a row in a two dimensional NumPy array, as scikit-learn
always expects two-dimensional arrays for the data.
66.
Application: Classifying IrisSpecies
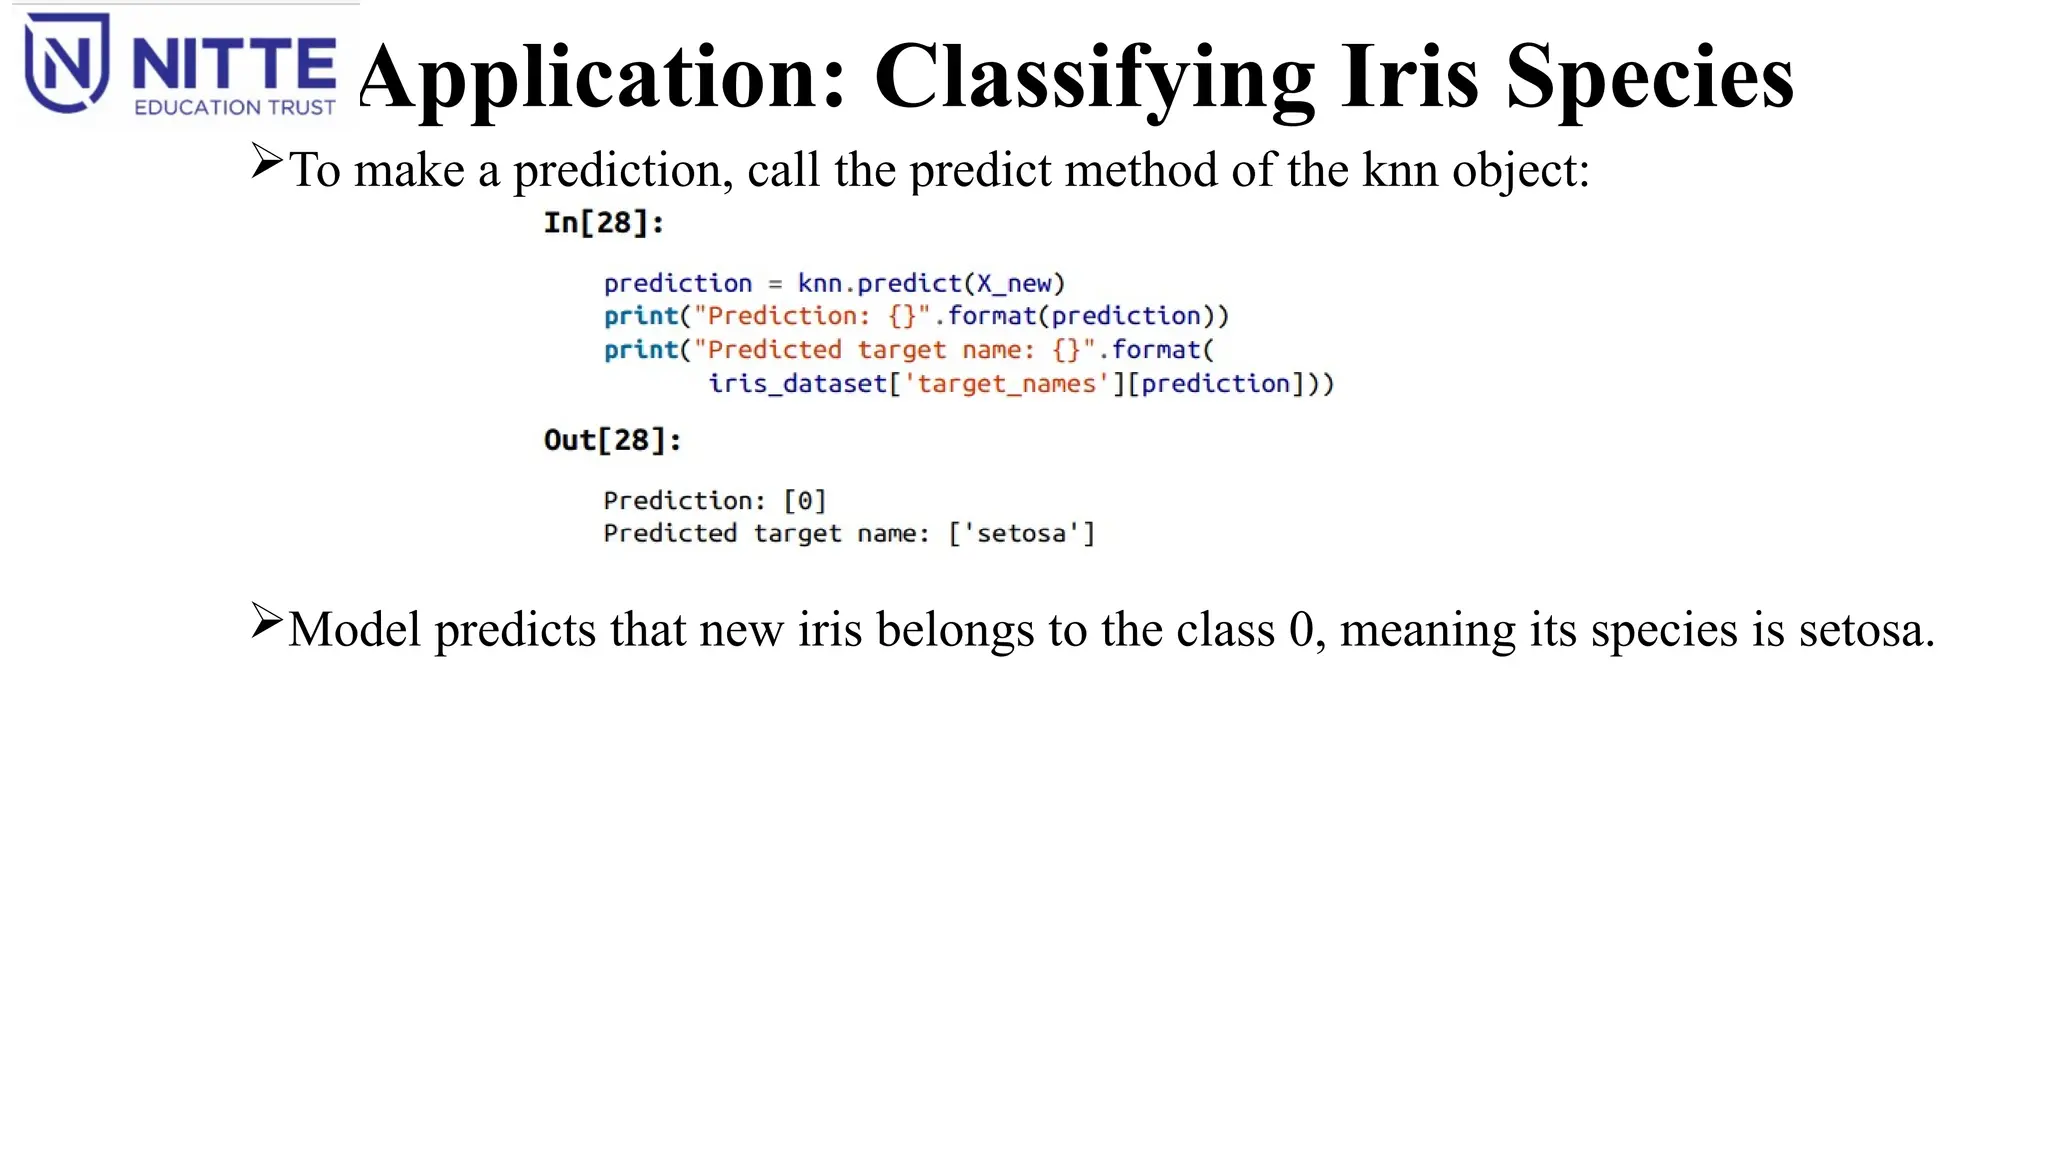
To make a prediction, call the predict method of the knn object:
Model predicts that new iris belongs to the class 0, meaning its species is setosa.
67.
Application: Classifying IrisSpecies
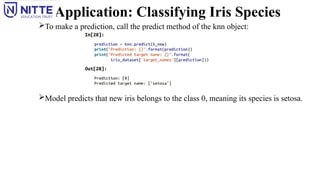
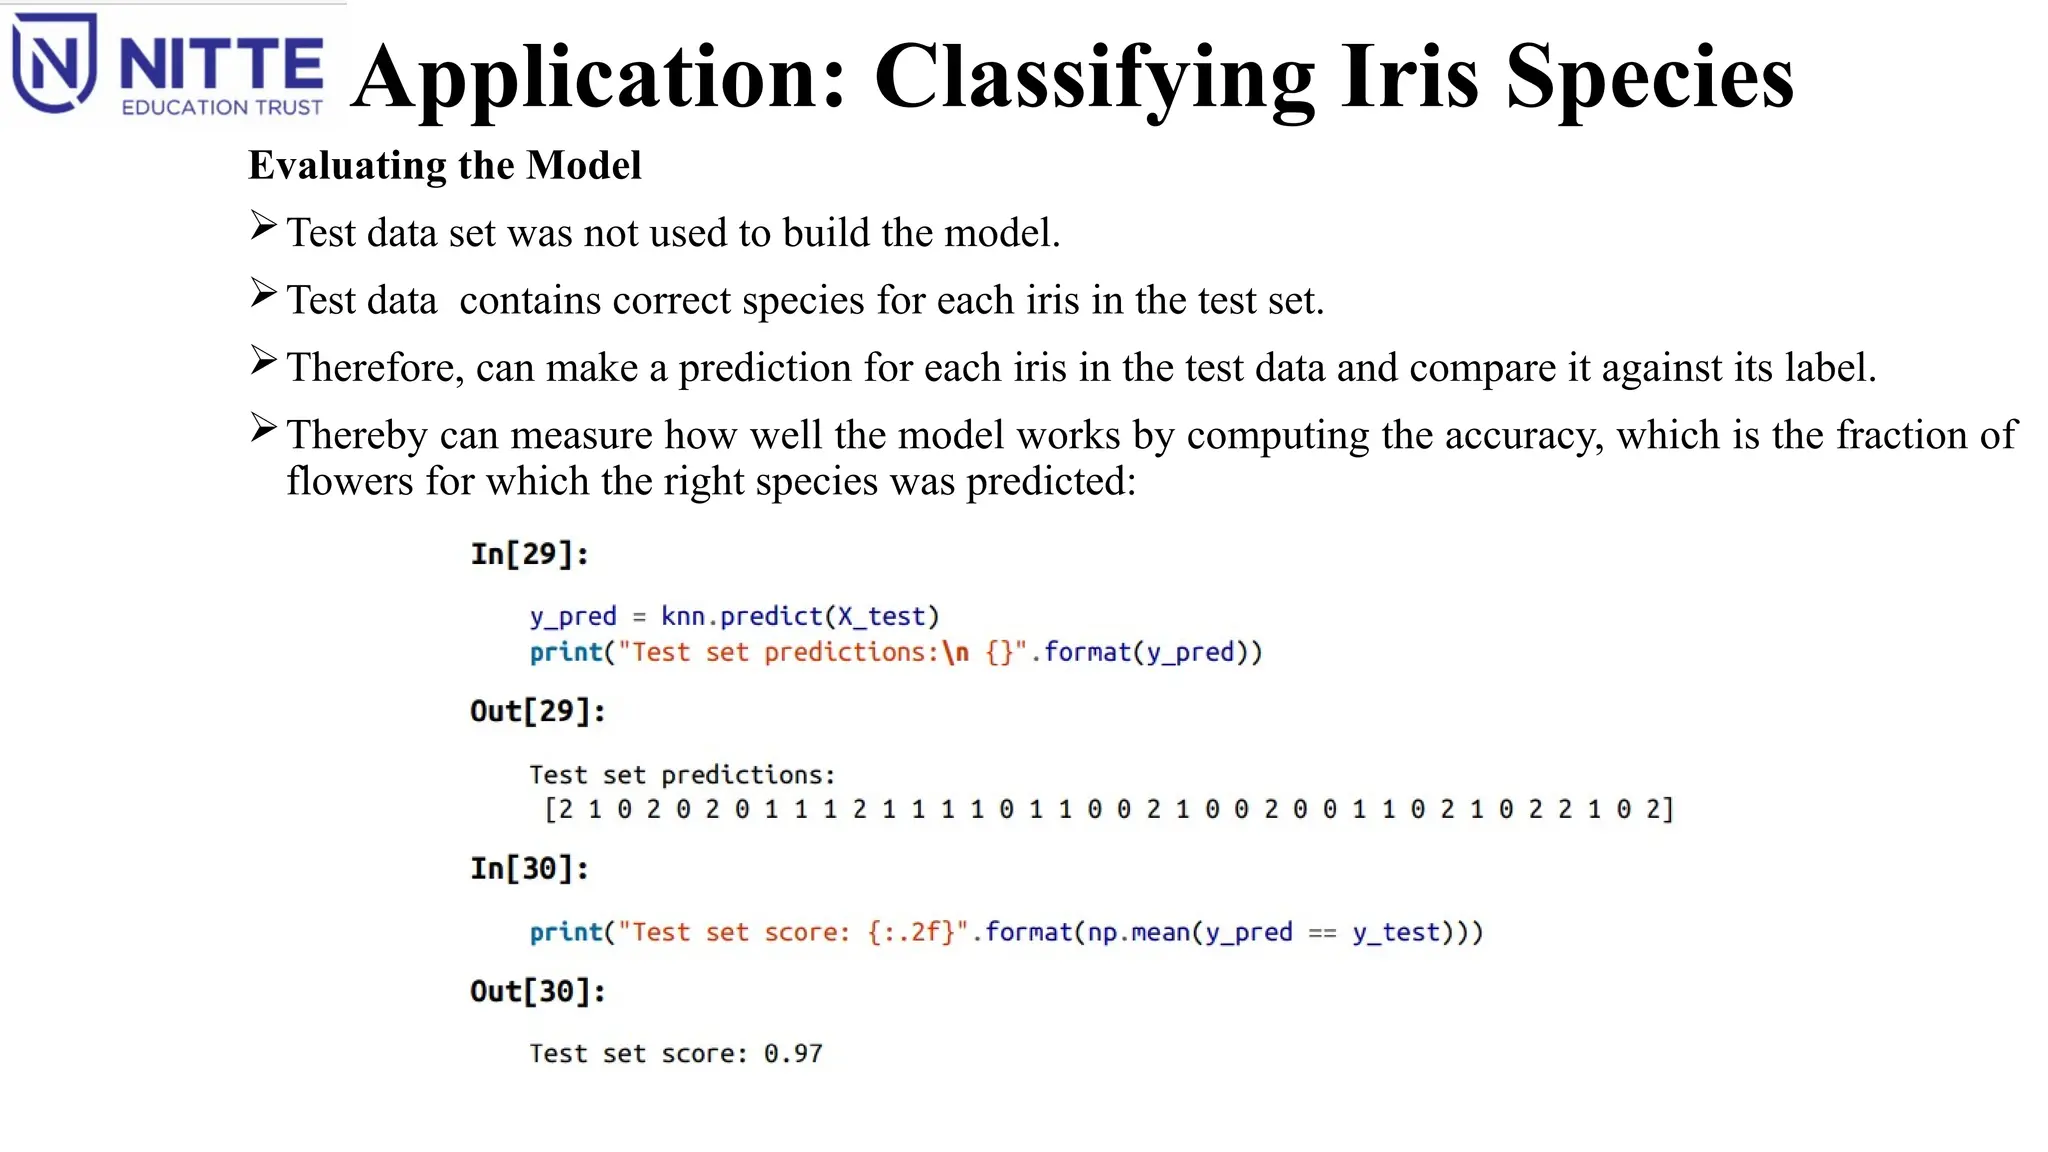
Evaluating the Model
Test data set was not used to build the model.
Test data contains correct species for each iris in the test set.
Therefore, can make a prediction for each iris in the test data and compare it against its label.
Thereby can measure how well the model works by computing the accuracy, which is the fraction of
flowers for which the right species was predicted:
68.
Application: Classifying IrisSpecies
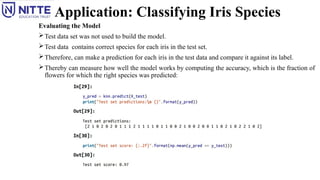
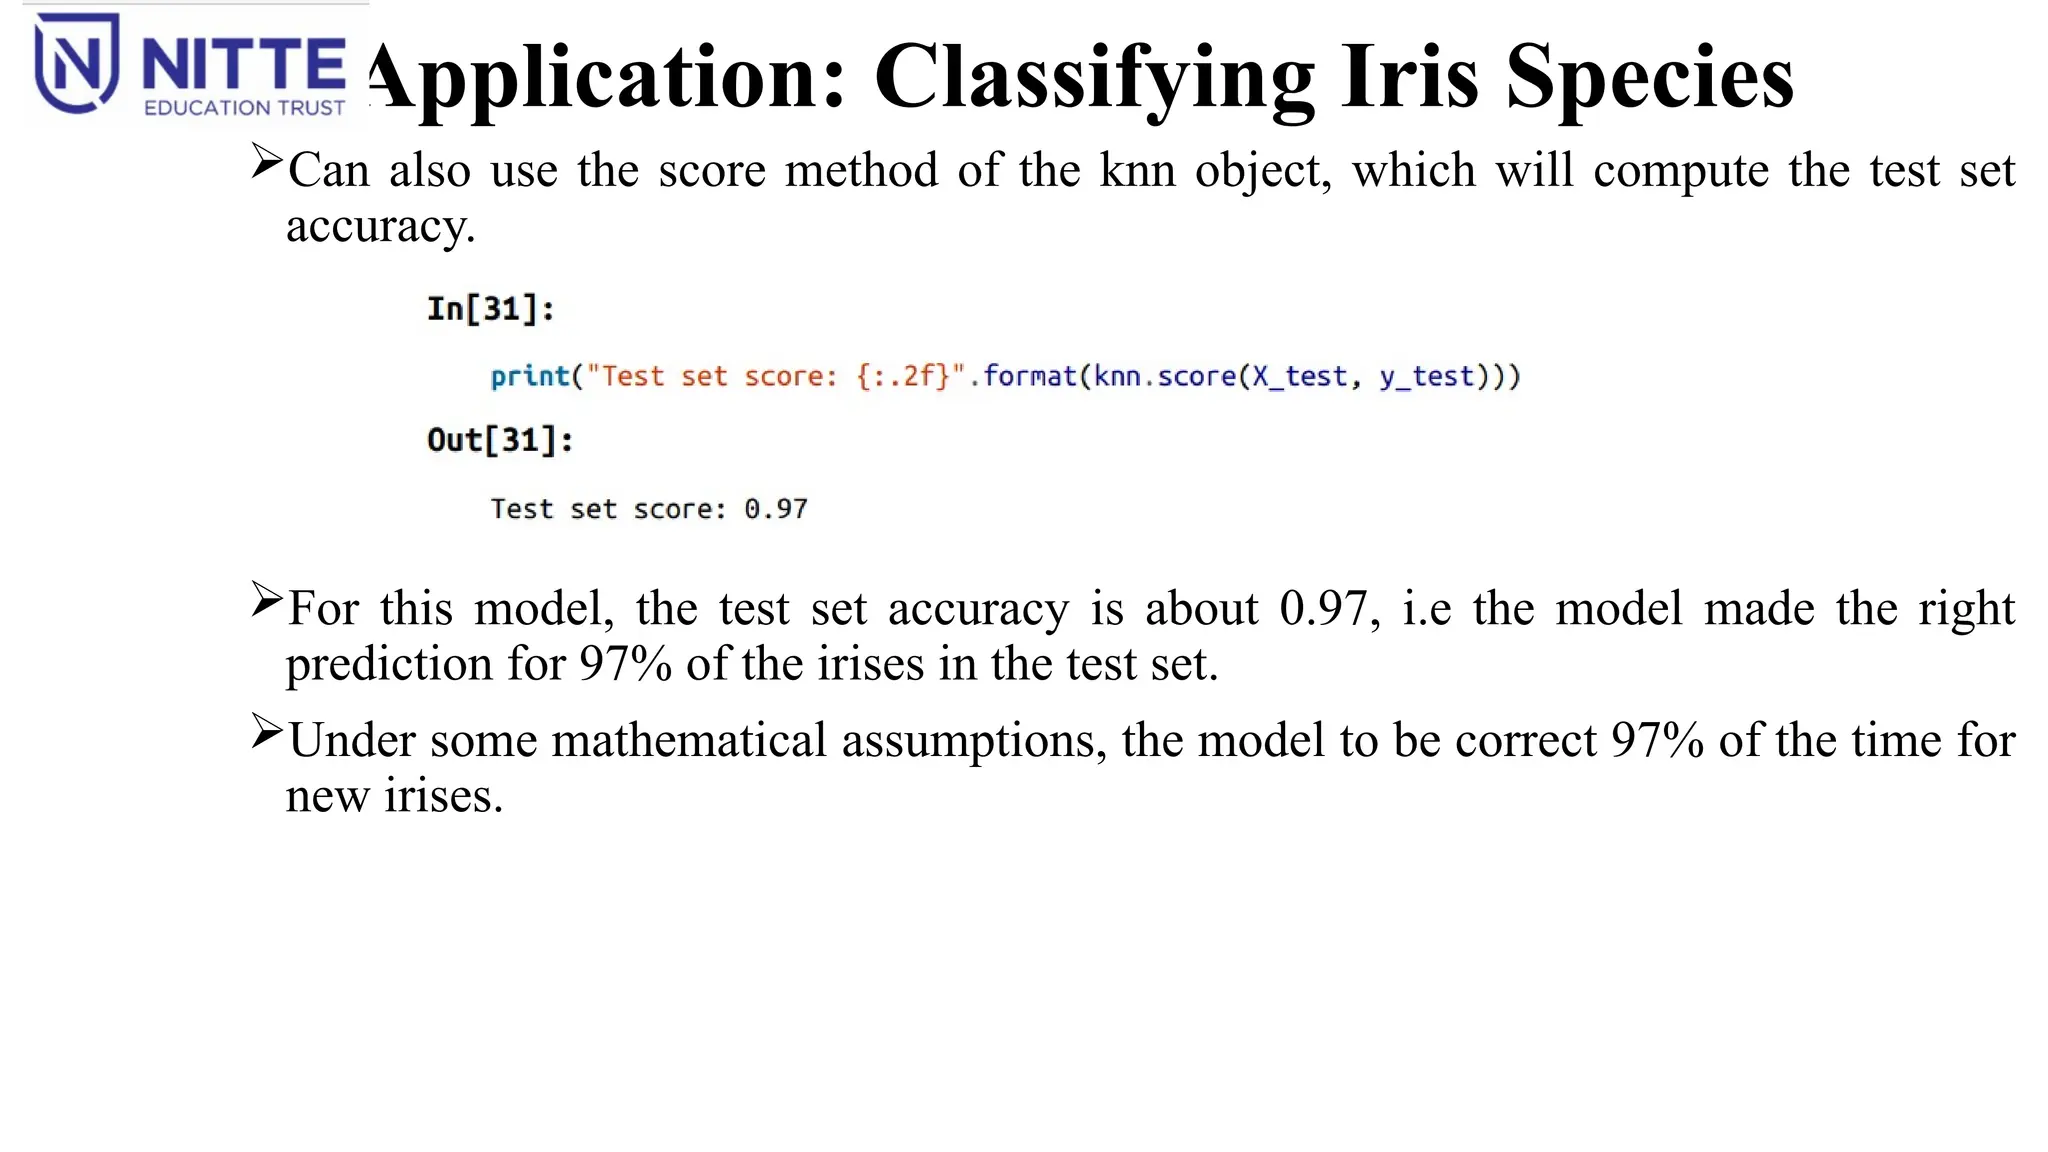
Can also use the score method of the knn object, which will compute the test set
accuracy.
For this model, the test set accuracy is about 0.97, i.e the model made the right
prediction for 97% of the irises in the test set.
Under some mathematical assumptions, the model to be correct 97% of the time for
new irises.
69.
Application: Classifying IrisSpecies
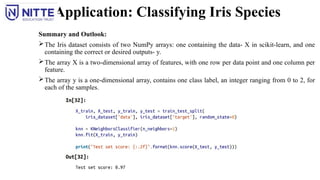
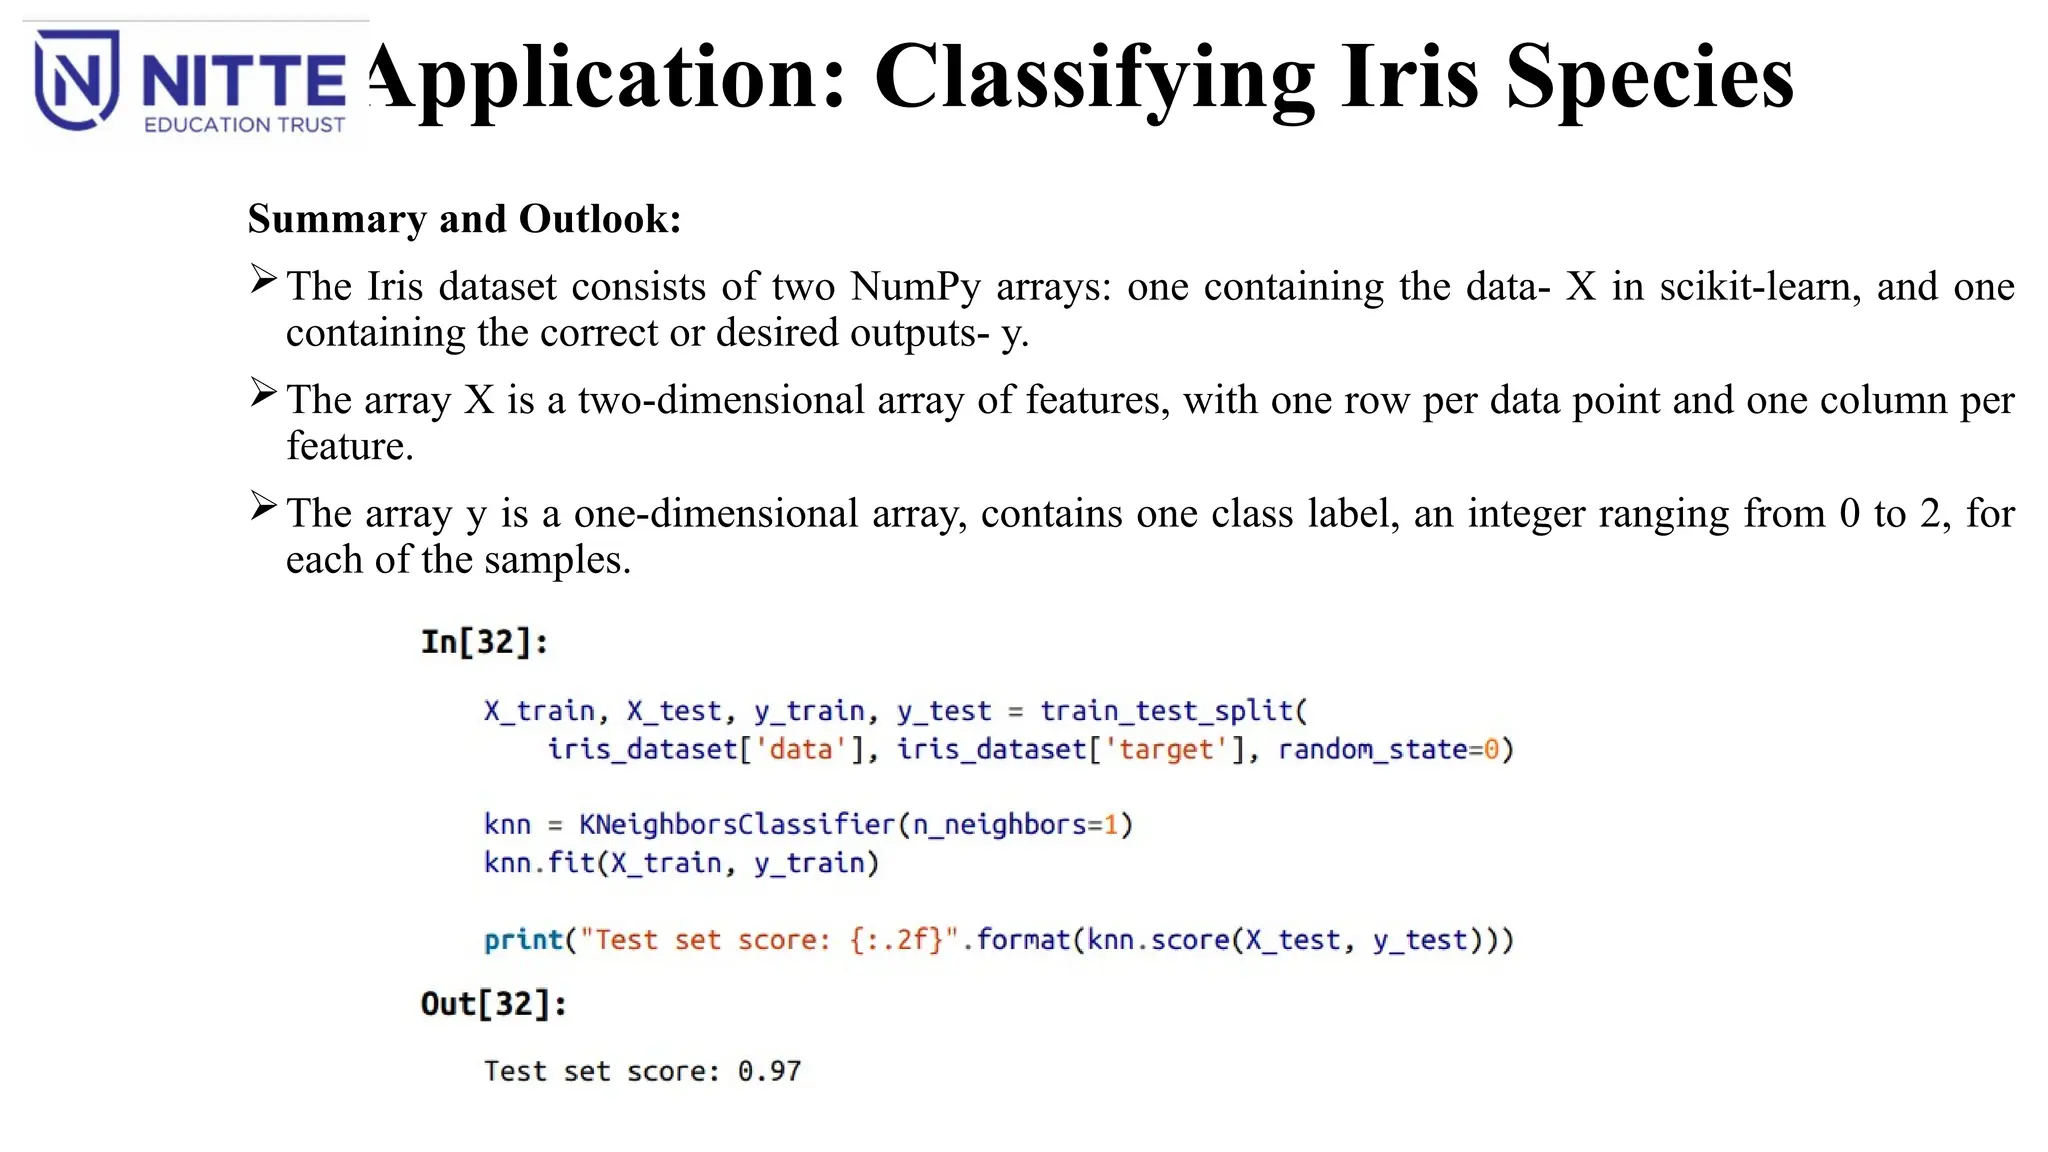
Summary and Outlook:
The Iris dataset consists of two NumPy arrays: one containing the data- X in scikit-learn, and one
containing the correct or desired outputs- y.
The array X is a two-dimensional array of features, with one row per data point and one column per
feature.
The array y is a one-dimensional array, contains one class label, an integer ranging from 0 to 2, for
each of the samples.
#44 A key is an attribute or a set of attributes that help to uniquely identify a tuple (or row) in a relation (or table).
Keys are also used to establish relationships between the different tables and columns of a relational database.
Individual values in a key are called key values.


![dictoniary
data
{
‘Name’:[“a”,”b”,”c”,”d”]
‘age’: [4,5,6,7]
‘loc’:[“g”,”t”,”m”,”b”]
}](https://image.slidesharecdn.com/unit1-250421082020-2b2d5964/85/Machine-learning-basics-using-python-programking-39-320.jpg)
![Application: Classifying Iris Species
The species are encoded as integers from 0 to 2:
The meanings of the numbers are given by the iris['target_names'] array:
0 means setosa
1 means versicolor
2 means virginica.](https://image.slidesharecdn.com/unit1-250421082020-2b2d5964/85/Machine-learning-basics-using-python-programking-49-320.jpg)


![step 1: load the data sets from sklearn
*****--------------------*****
from sklearn.datasets import load_iris
iris=load_iris()
step 2 : As the dataset is a dictionary check the keys
---------------------------------------------------------------
***********to check the keys******************
print("keys of datasets:n".format(iris.keys()))
----------------------------------------------------------------
step 3 : divide the data for training and testing
from sklearn.model_selection import train_test_split
X_train,X_test, y_train , y_test = train_test_split(----------------)
X_train,X_test, y_train , y_test = train_test_split(iris['data'],iris['target'], random state = 0)
---------------------------------------------------------------------
step 4 : use a suitable model for classifying the data in the datasets
from sklearn.neighbors import KNeighboursClassifier
knn=KNeighboursClassifier(n_neighbour=1)
knn.fit(X_train,y_train)
-------------------------------------------------
step 5: predict for a new data point
X_new=np.array([[5,2.9,1,0.2]])
prediction = knn.predict(X_new)
-------------------------------------------------
Step 6 : Evaluation of the model
y_pred = knn.predict(X_test)](https://image.slidesharecdn.com/unit1-250421082020-2b2d5964/85/Machine-learning-basics-using-python-programking-63-320.jpg)


![dictoniary
data
{
‘Name’:[“a”,”b”,”c”,”d”]
‘age’: [4,5,6,7]
‘loc’:[“g”,”t”,”m”,”b”]
}](https://image.slidesharecdn.com/unit1-250421082020-2b2d5964/75/Machine-learning-basics-using-python-programking-39-2048.jpg)

![Application: Classifying Iris Species
The species are encoded as integers from 0 to 2:
The meanings of the numbers are given by the iris['target_names'] array:
0 means setosa
1 means versicolor
2 means virginica.](https://image.slidesharecdn.com/unit1-250421082020-2b2d5964/75/Machine-learning-basics-using-python-programking-49-2048.jpg)

![step 1: load the data sets from sklearn
*****--------------------*****
from sklearn.datasets import load_iris
iris=load_iris()
step 2 : As the dataset is a dictionary check the keys
---------------------------------------------------------------
***********to check the keys******************
print("keys of datasets:n".format(iris.keys()))
----------------------------------------------------------------
step 3 : divide the data for training and testing
from sklearn.model_selection import train_test_split
X_train,X_test, y_train , y_test = train_test_split(----------------)
X_train,X_test, y_train , y_test = train_test_split(iris['data'],iris['target'], random state = 0)
---------------------------------------------------------------------
step 4 : use a suitable model for classifying the data in the datasets
from sklearn.neighbors import KNeighboursClassifier
knn=KNeighboursClassifier(n_neighbour=1)
knn.fit(X_train,y_train)
-------------------------------------------------
step 5: predict for a new data point
X_new=np.array([[5,2.9,1,0.2]])
prediction = knn.predict(X_new)
-------------------------------------------------
Step 6 : Evaluation of the model
y_pred = knn.predict(X_test)](https://image.slidesharecdn.com/unit1-250421082020-2b2d5964/75/Machine-learning-basics-using-python-programking-63-2048.jpg)


![UiPath Automation Suite Installation (Hands-On) [2/3]](https://cdn.slidesharecdn.com/ss_thumbnails/automationsuitecommunitysession2-251015095633-a6d862f1-thumbnail.jpg?width=600ounds&width=560&fit=bounds)


