Downloaded 37 times
![Problem Statement and Data
The name of the bank is Banco de Portugal
Website https://www.bportugal.pt/en-US/Pages/inicio.aspx
Problem statement : Predict using mathematical methods whether a customer a customer
subscribed to a term deposit loan.
Data has been taken from https://archive.ics.uci.edu/ml/datasets/Bank+Marketing
Citation : Moro et al., 2014] S. Moro, P. Cortez and P. Rita. A Data-Driven Approach to
Predict the Success of Bank Telemarketing. Decision Support Systems,
In press, http://dx.doi.org/10.1016/j.dss.2014.03.001
Available at: [pdf] http://dx.doi.org/10.1016/j.dss.2014.03.001
[bib] http://www3.dsi.uminho.pt/pcortez/bib/2014-dss.txt
1. Title: Bank Marketing (with social/economic context)
2. Sources : Sérgio Moro (ISCTE-IUL), Paulo Cortez (Univ. Minho) and Paulo Rita (ISCTE-
IUL) @ 2014
3. Past Usage: The full dataset (bank-additional-full.csv) was described and analyzed in: S.
Moro, P. Cortez and P. Rita. A Data-Driven Approach to Predict the Success of Bank
Telemarketing. Decision Support Systems (2014), doi:10.1016/j.dss.2014.03.001.
4. Relevant Information: This dataset is based on "Bank Marketing" UCI dataset. The data is
enriched by the addition of five new social and economic features/attributes (national wide
indicators from a ~10M population country), published by the Banco de Portugal and
publicly available at: https://www.bportugal.pt/estatisticasweb. The data is related with
direct marketing campaigns of a Portuguese banking institution. The marketing campaigns
were based on phone calls. Often, more than one contact to the same client was required, in
order to access if the product (bank term deposit) would be ('yes') or not ('no') subscribed.](https://image.slidesharecdn.com/predictivemodeling-160725033236/85/Predictive-modeling-3-320.jpg)


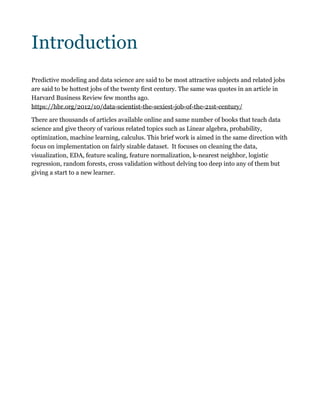
![Problem Statement and Data
The name of the bank is Banco de Portugal
Website https://www.bportugal.pt/en-US/Pages/inicio.aspx
Problem statement : Predict using mathematical methods whether a customer a customer
subscribed to a term deposit loan.
Data has been taken from https://archive.ics.uci.edu/ml/datasets/Bank+Marketing
Citation : Moro et al., 2014] S. Moro, P. Cortez and P. Rita. A Data-Driven Approach to
Predict the Success of Bank Telemarketing. Decision Support Systems,
In press, http://dx.doi.org/10.1016/j.dss.2014.03.001
Available at: [pdf] http://dx.doi.org/10.1016/j.dss.2014.03.001
[bib] http://www3.dsi.uminho.pt/pcortez/bib/2014-dss.txt
1. Title: Bank Marketing (with social/economic context)
2. Sources : Sérgio Moro (ISCTE-IUL), Paulo Cortez (Univ. Minho) and Paulo Rita (ISCTE-
IUL) @ 2014
3. Past Usage: The full dataset (bank-additional-full.csv) was described and analyzed in: S.
Moro, P. Cortez and P. Rita. A Data-Driven Approach to Predict the Success of Bank
Telemarketing. Decision Support Systems (2014), doi:10.1016/j.dss.2014.03.001.
4. Relevant Information: This dataset is based on "Bank Marketing" UCI dataset. The data is
enriched by the addition of five new social and economic features/attributes (national wide
indicators from a ~10M population country), published by the Banco de Portugal and
publicly available at: https://www.bportugal.pt/estatisticasweb. The data is related with
direct marketing campaigns of a Portuguese banking institution. The marketing campaigns
were based on phone calls. Often, more than one contact to the same client was required, in
order to access if the product (bank term deposit) would be ('yes') or not ('no') subscribed.](https://image.slidesharecdn.com/predictivemodeling-160725033236/75/Predictive-modeling-3-2048.jpg)

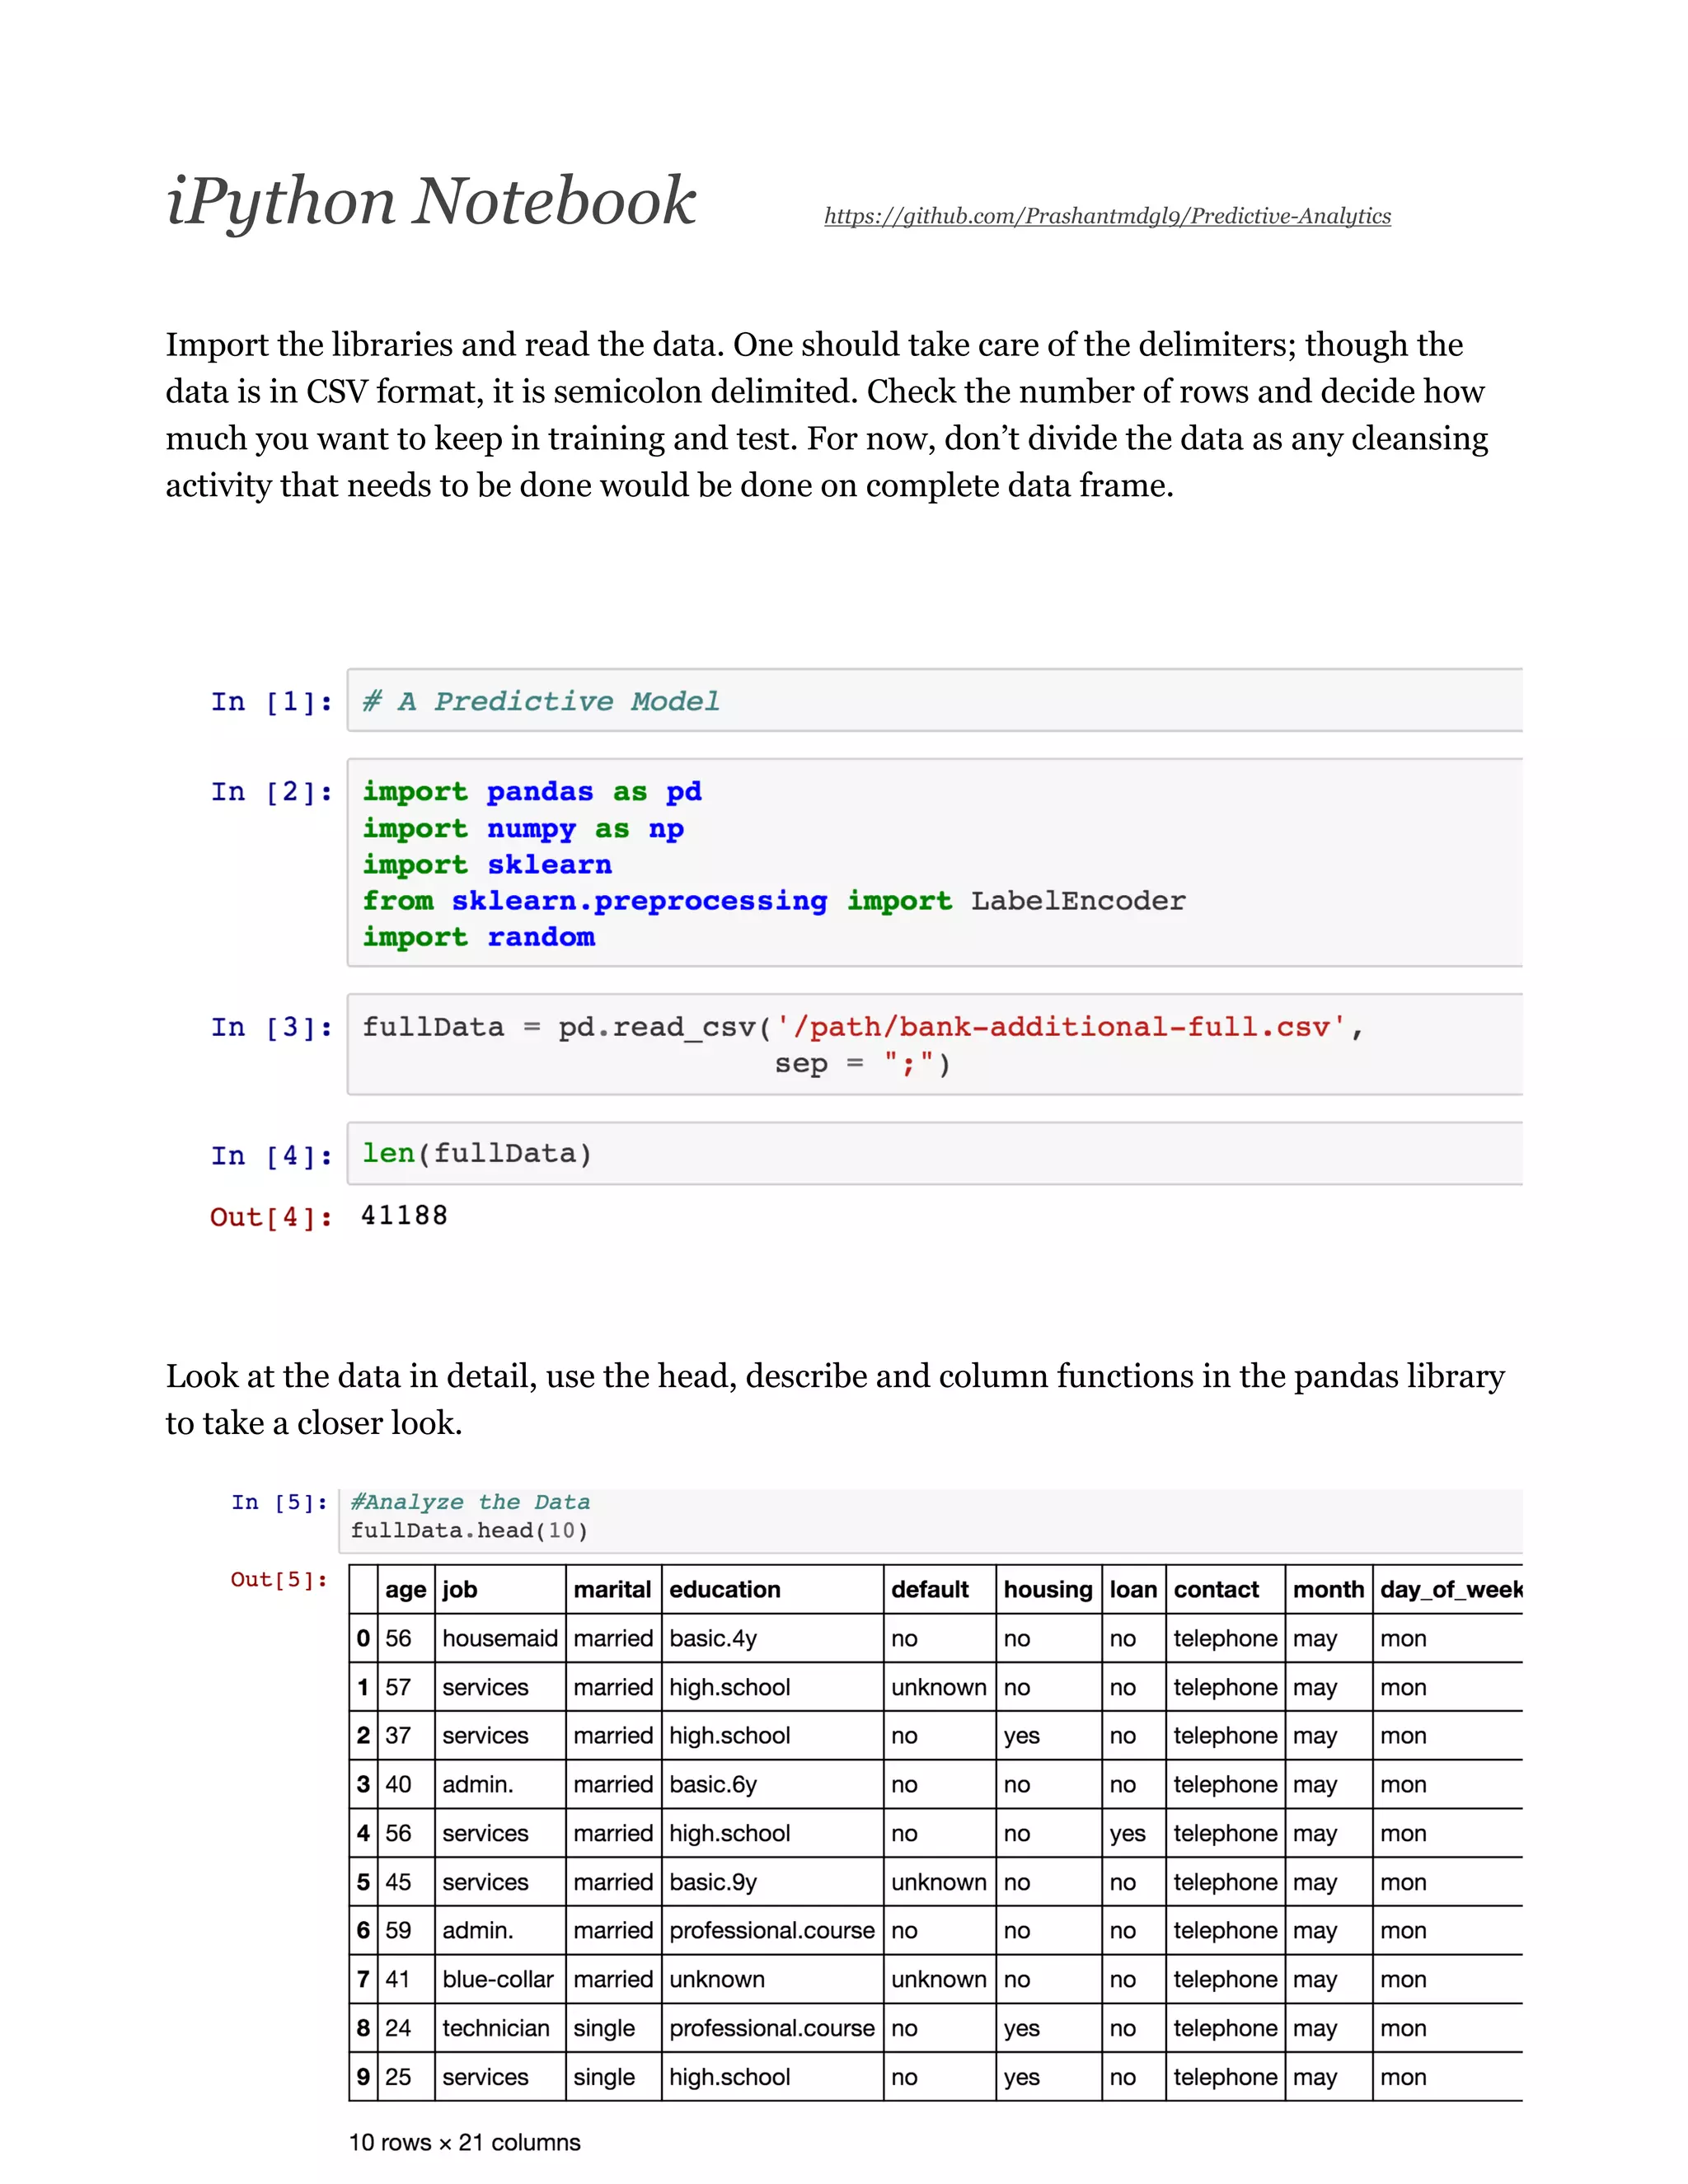

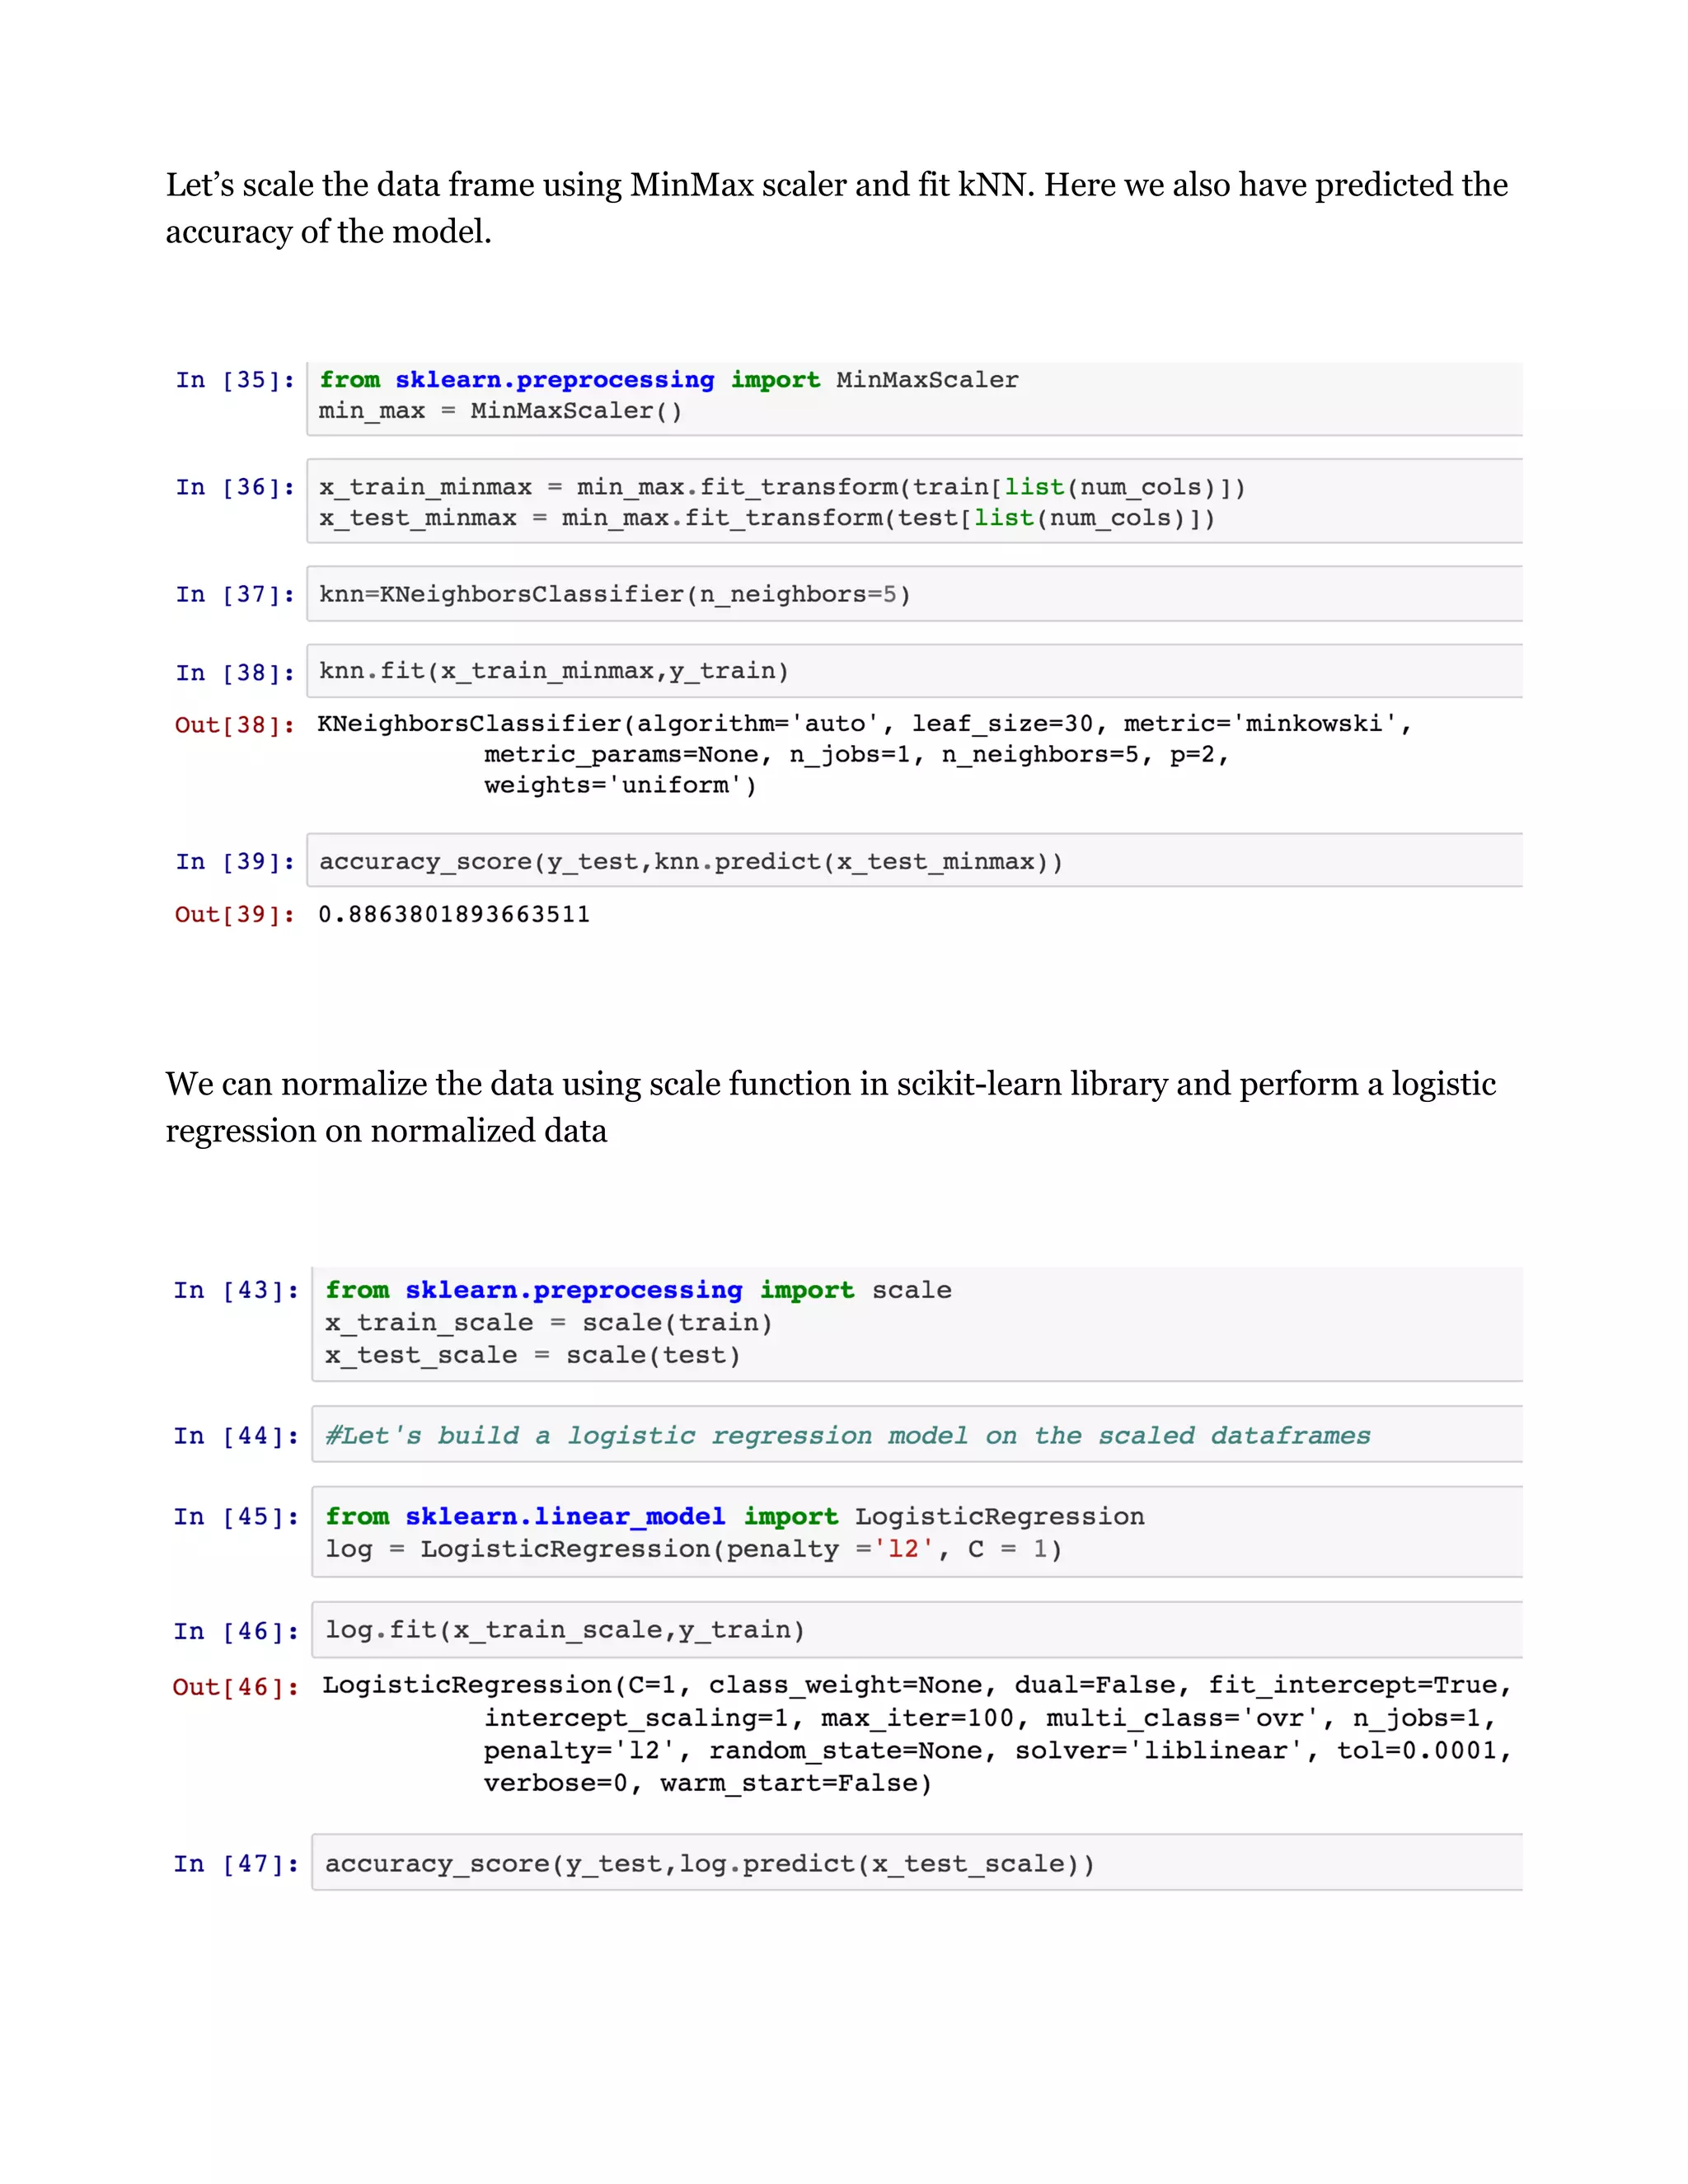
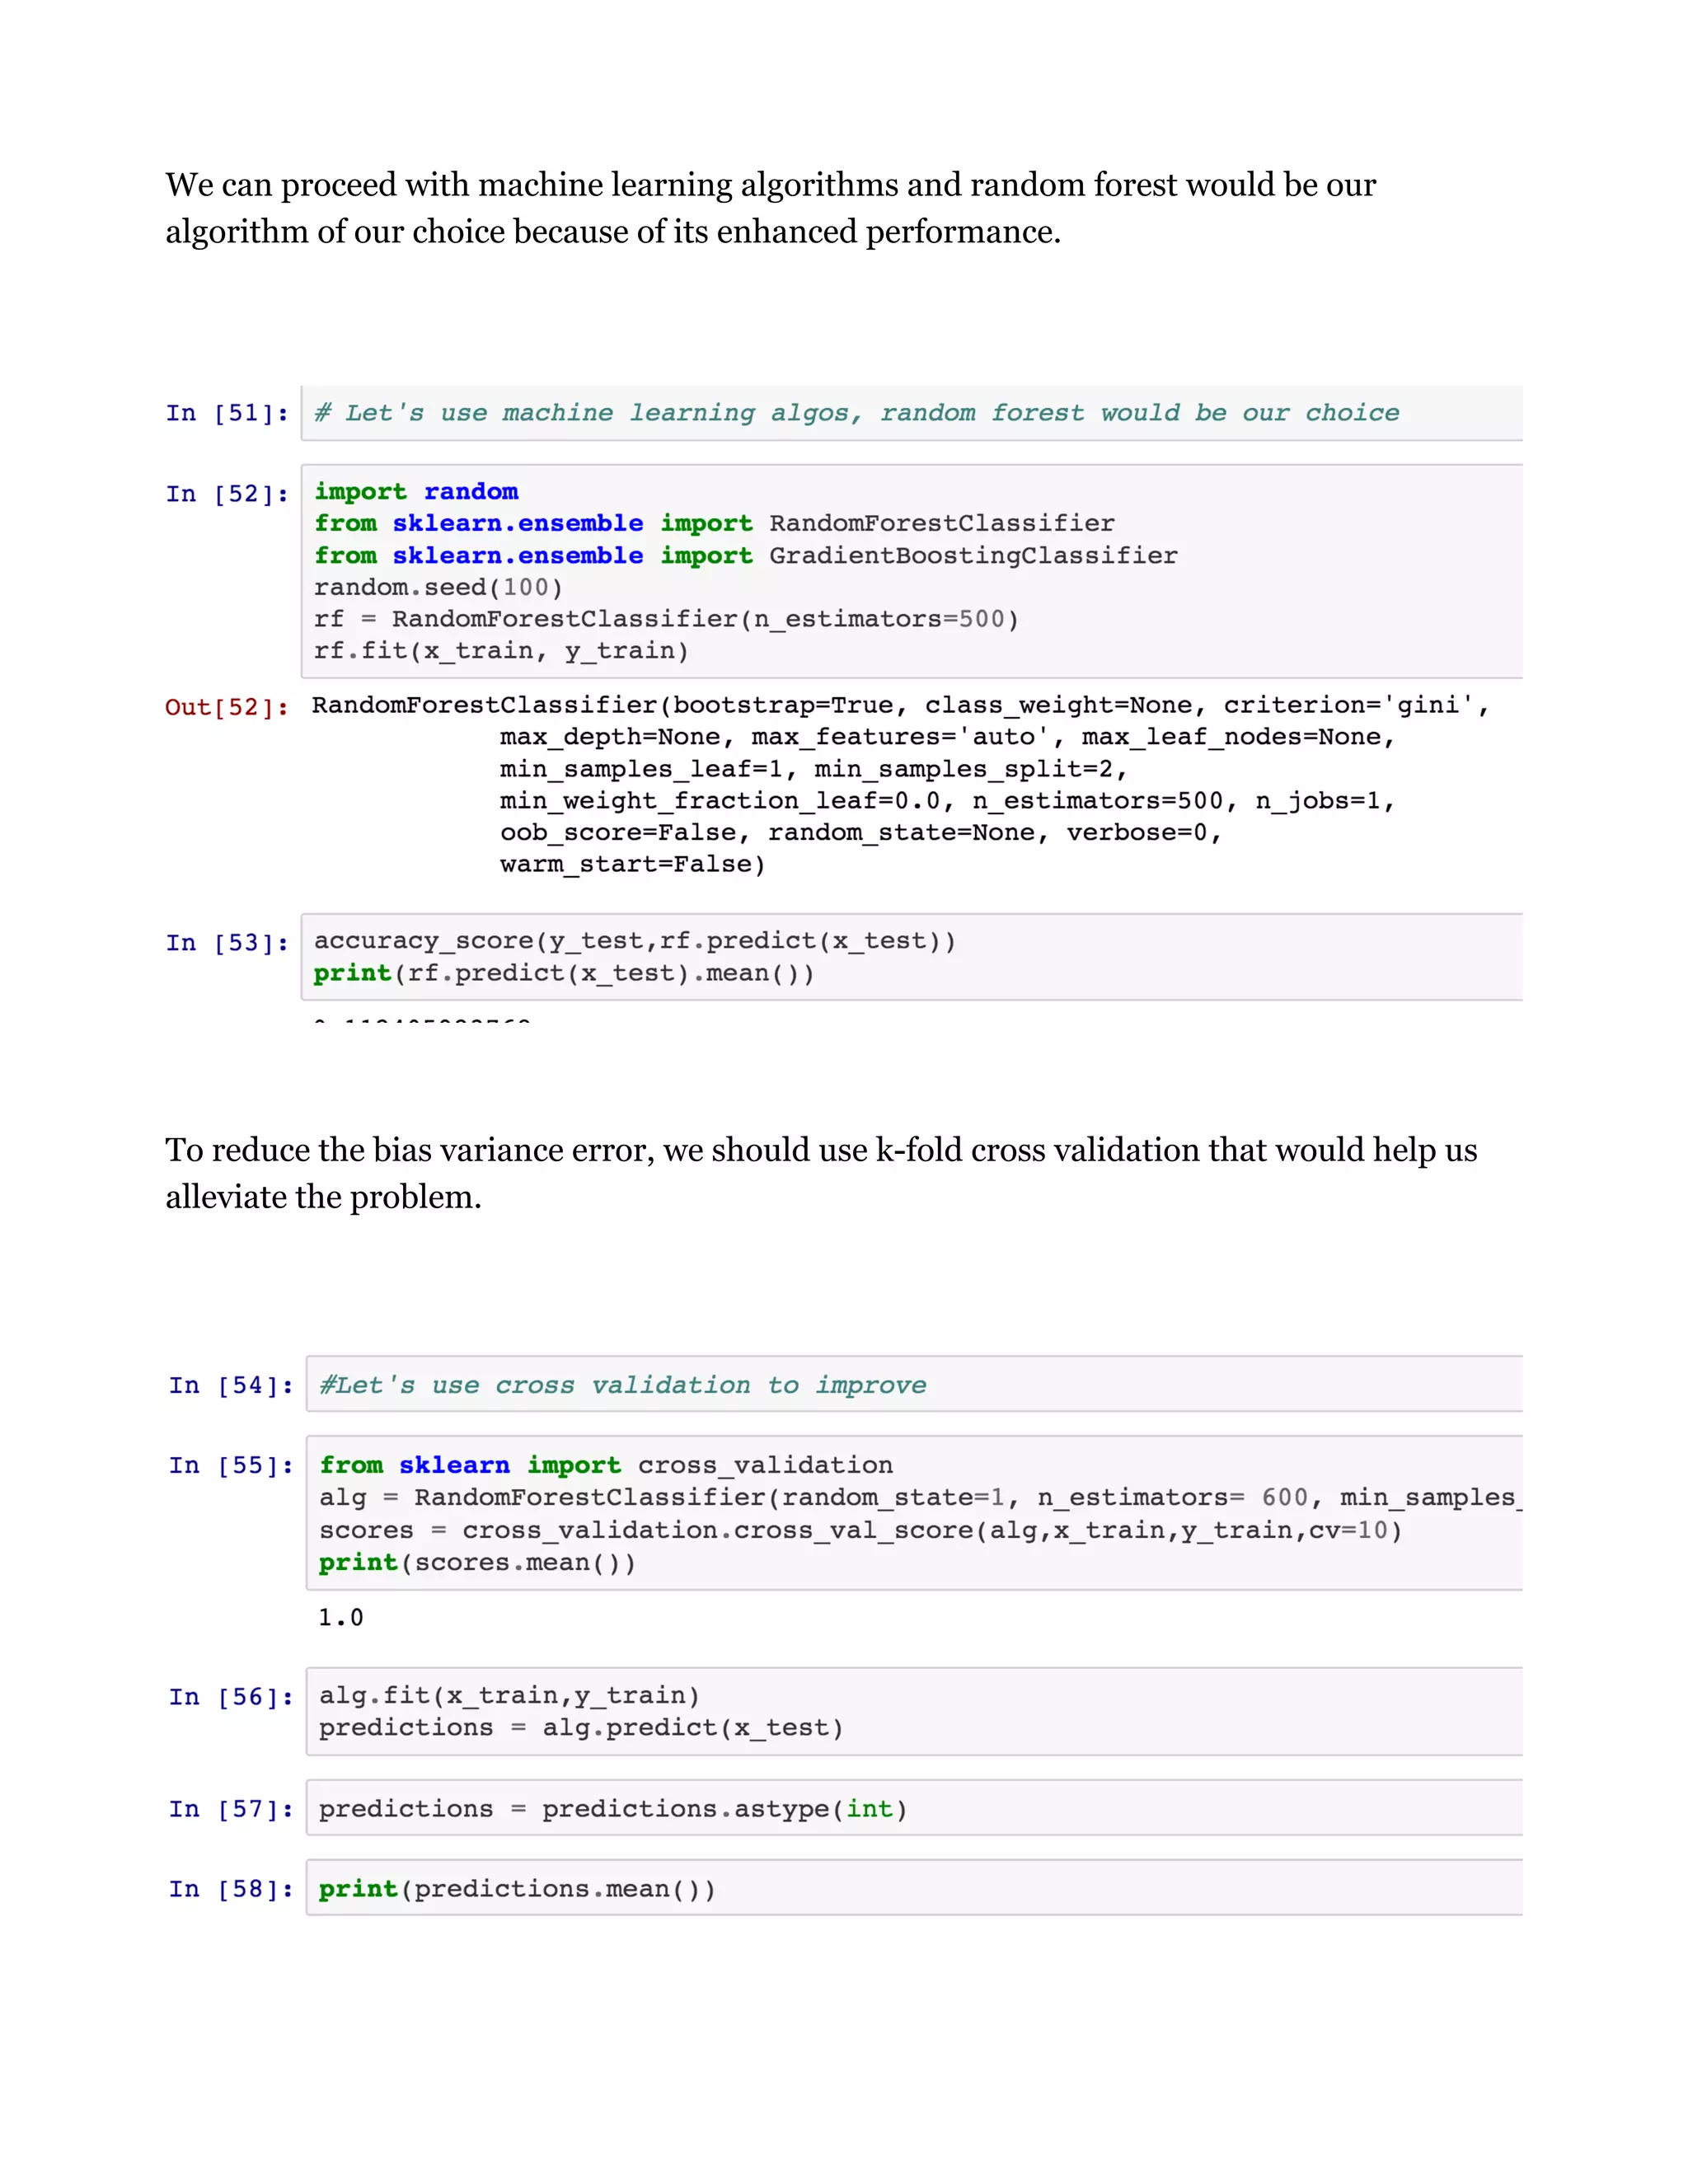
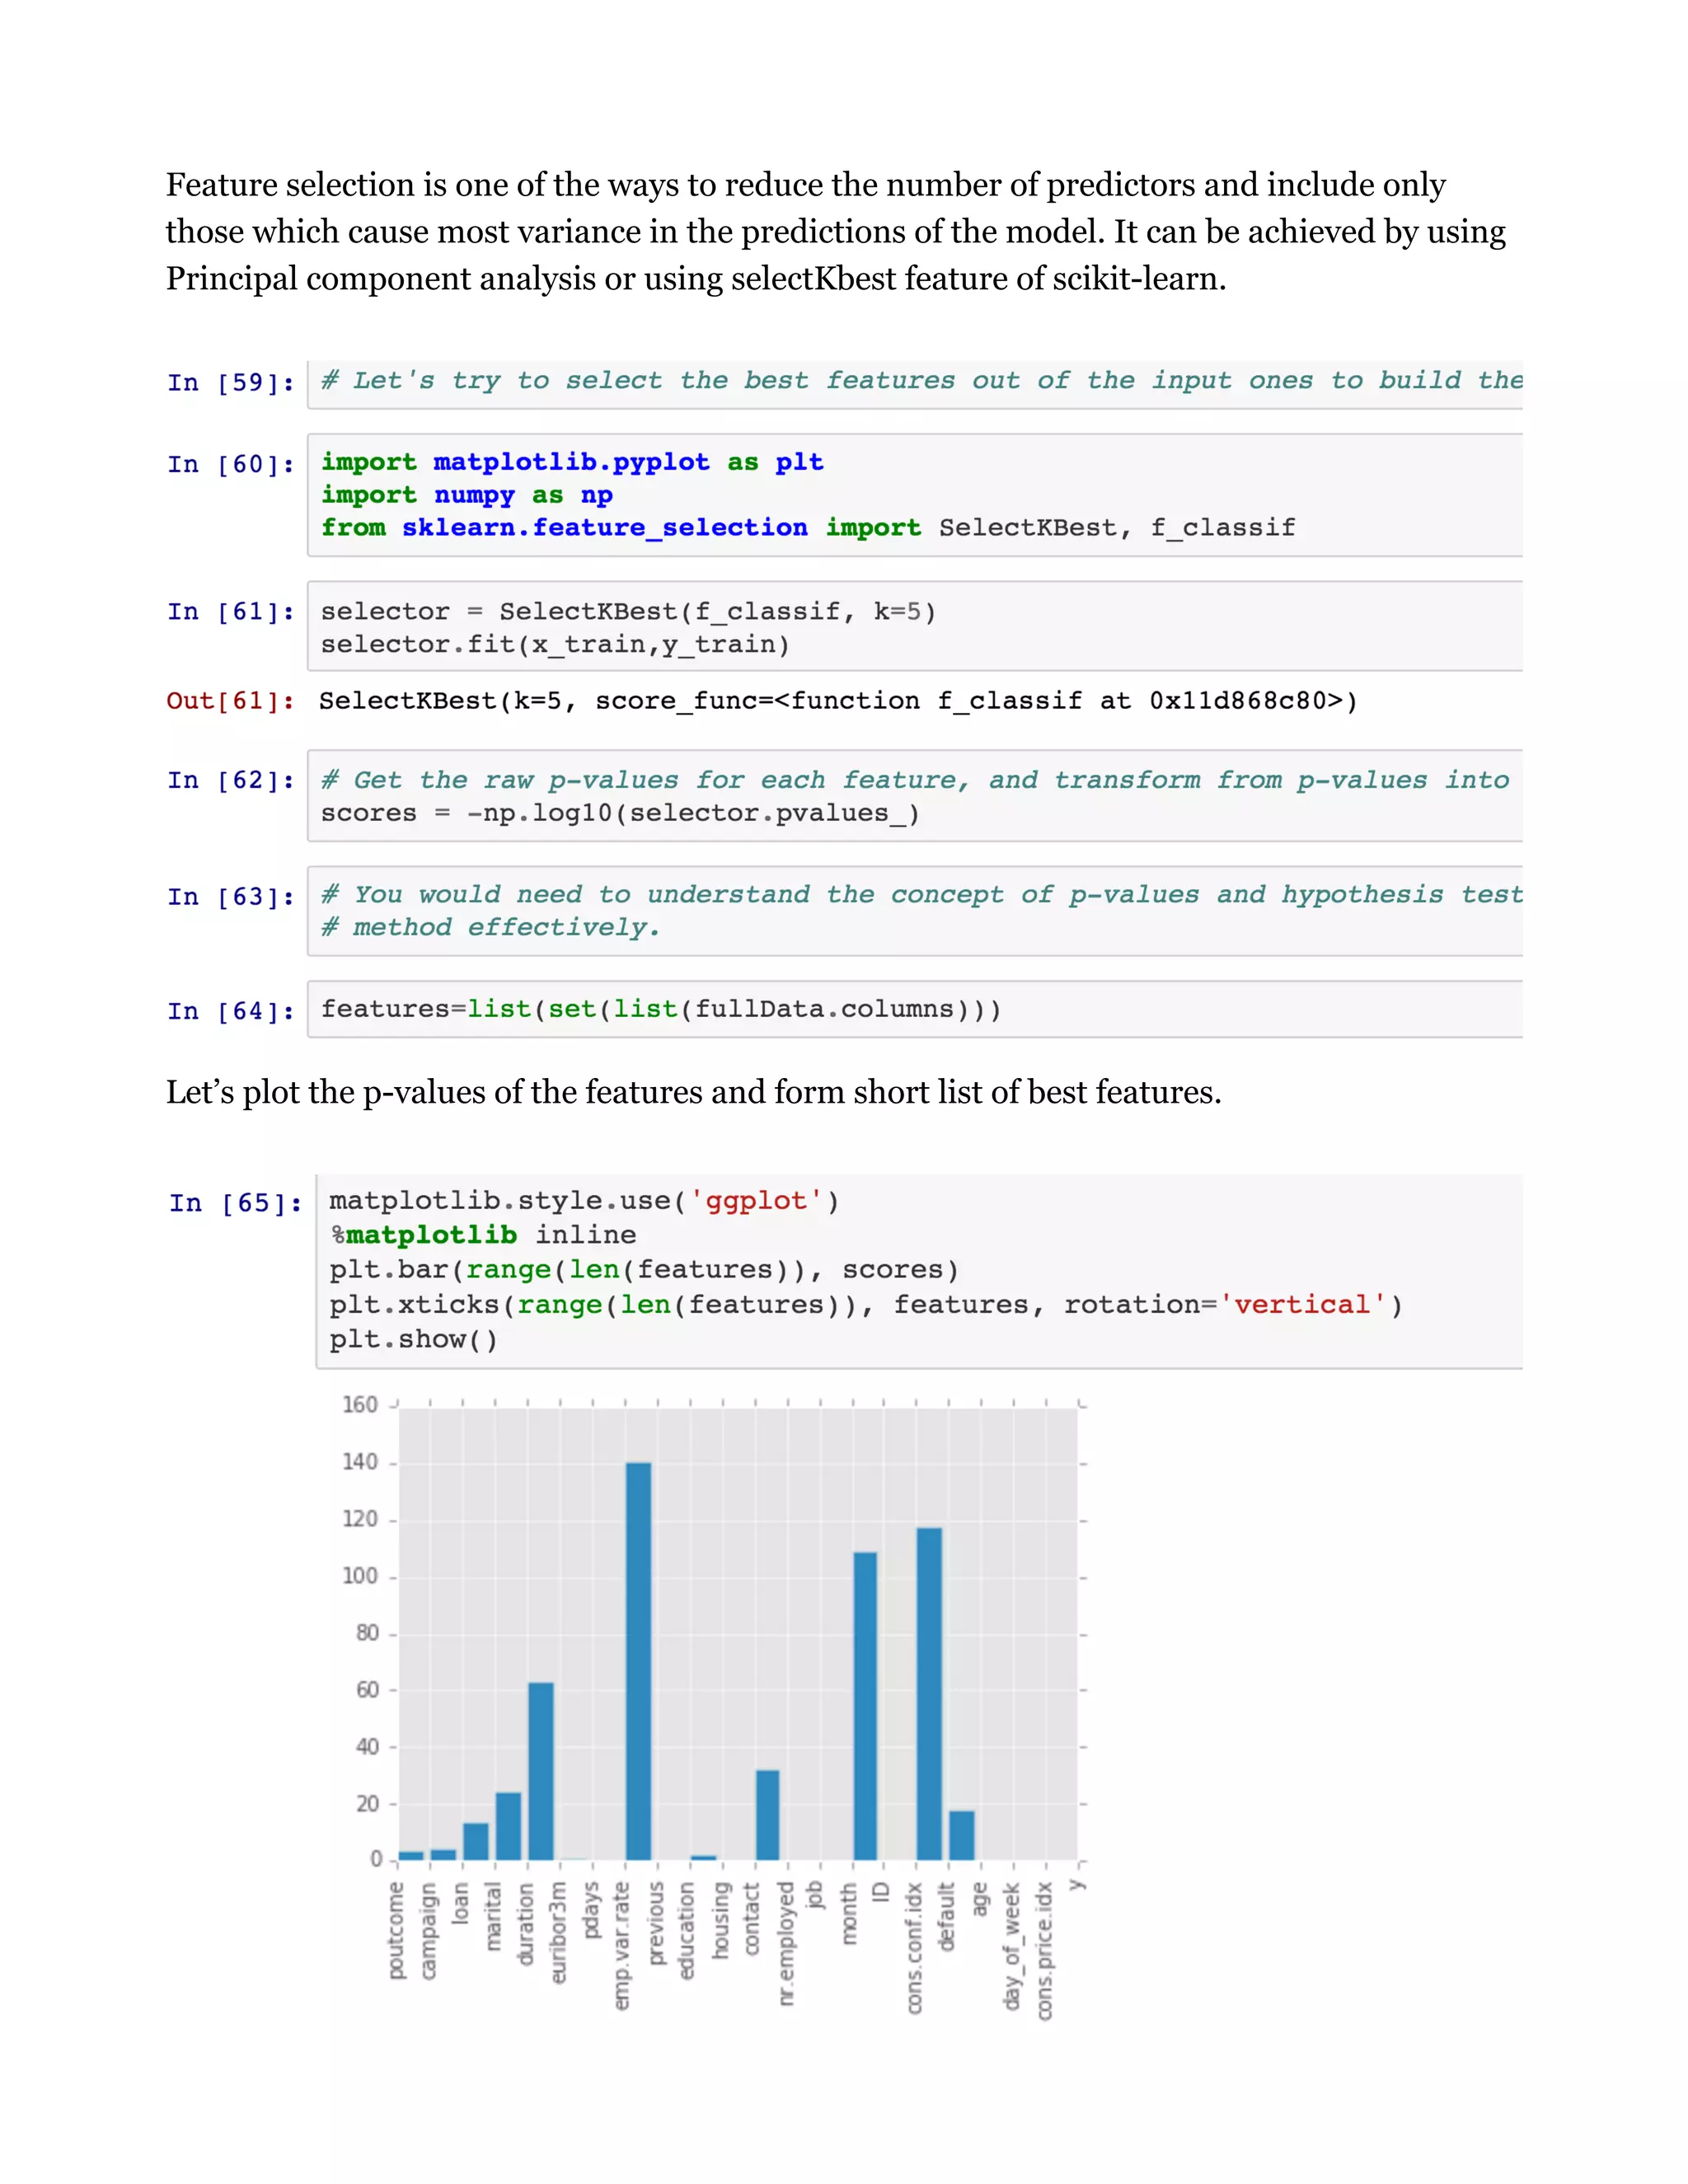
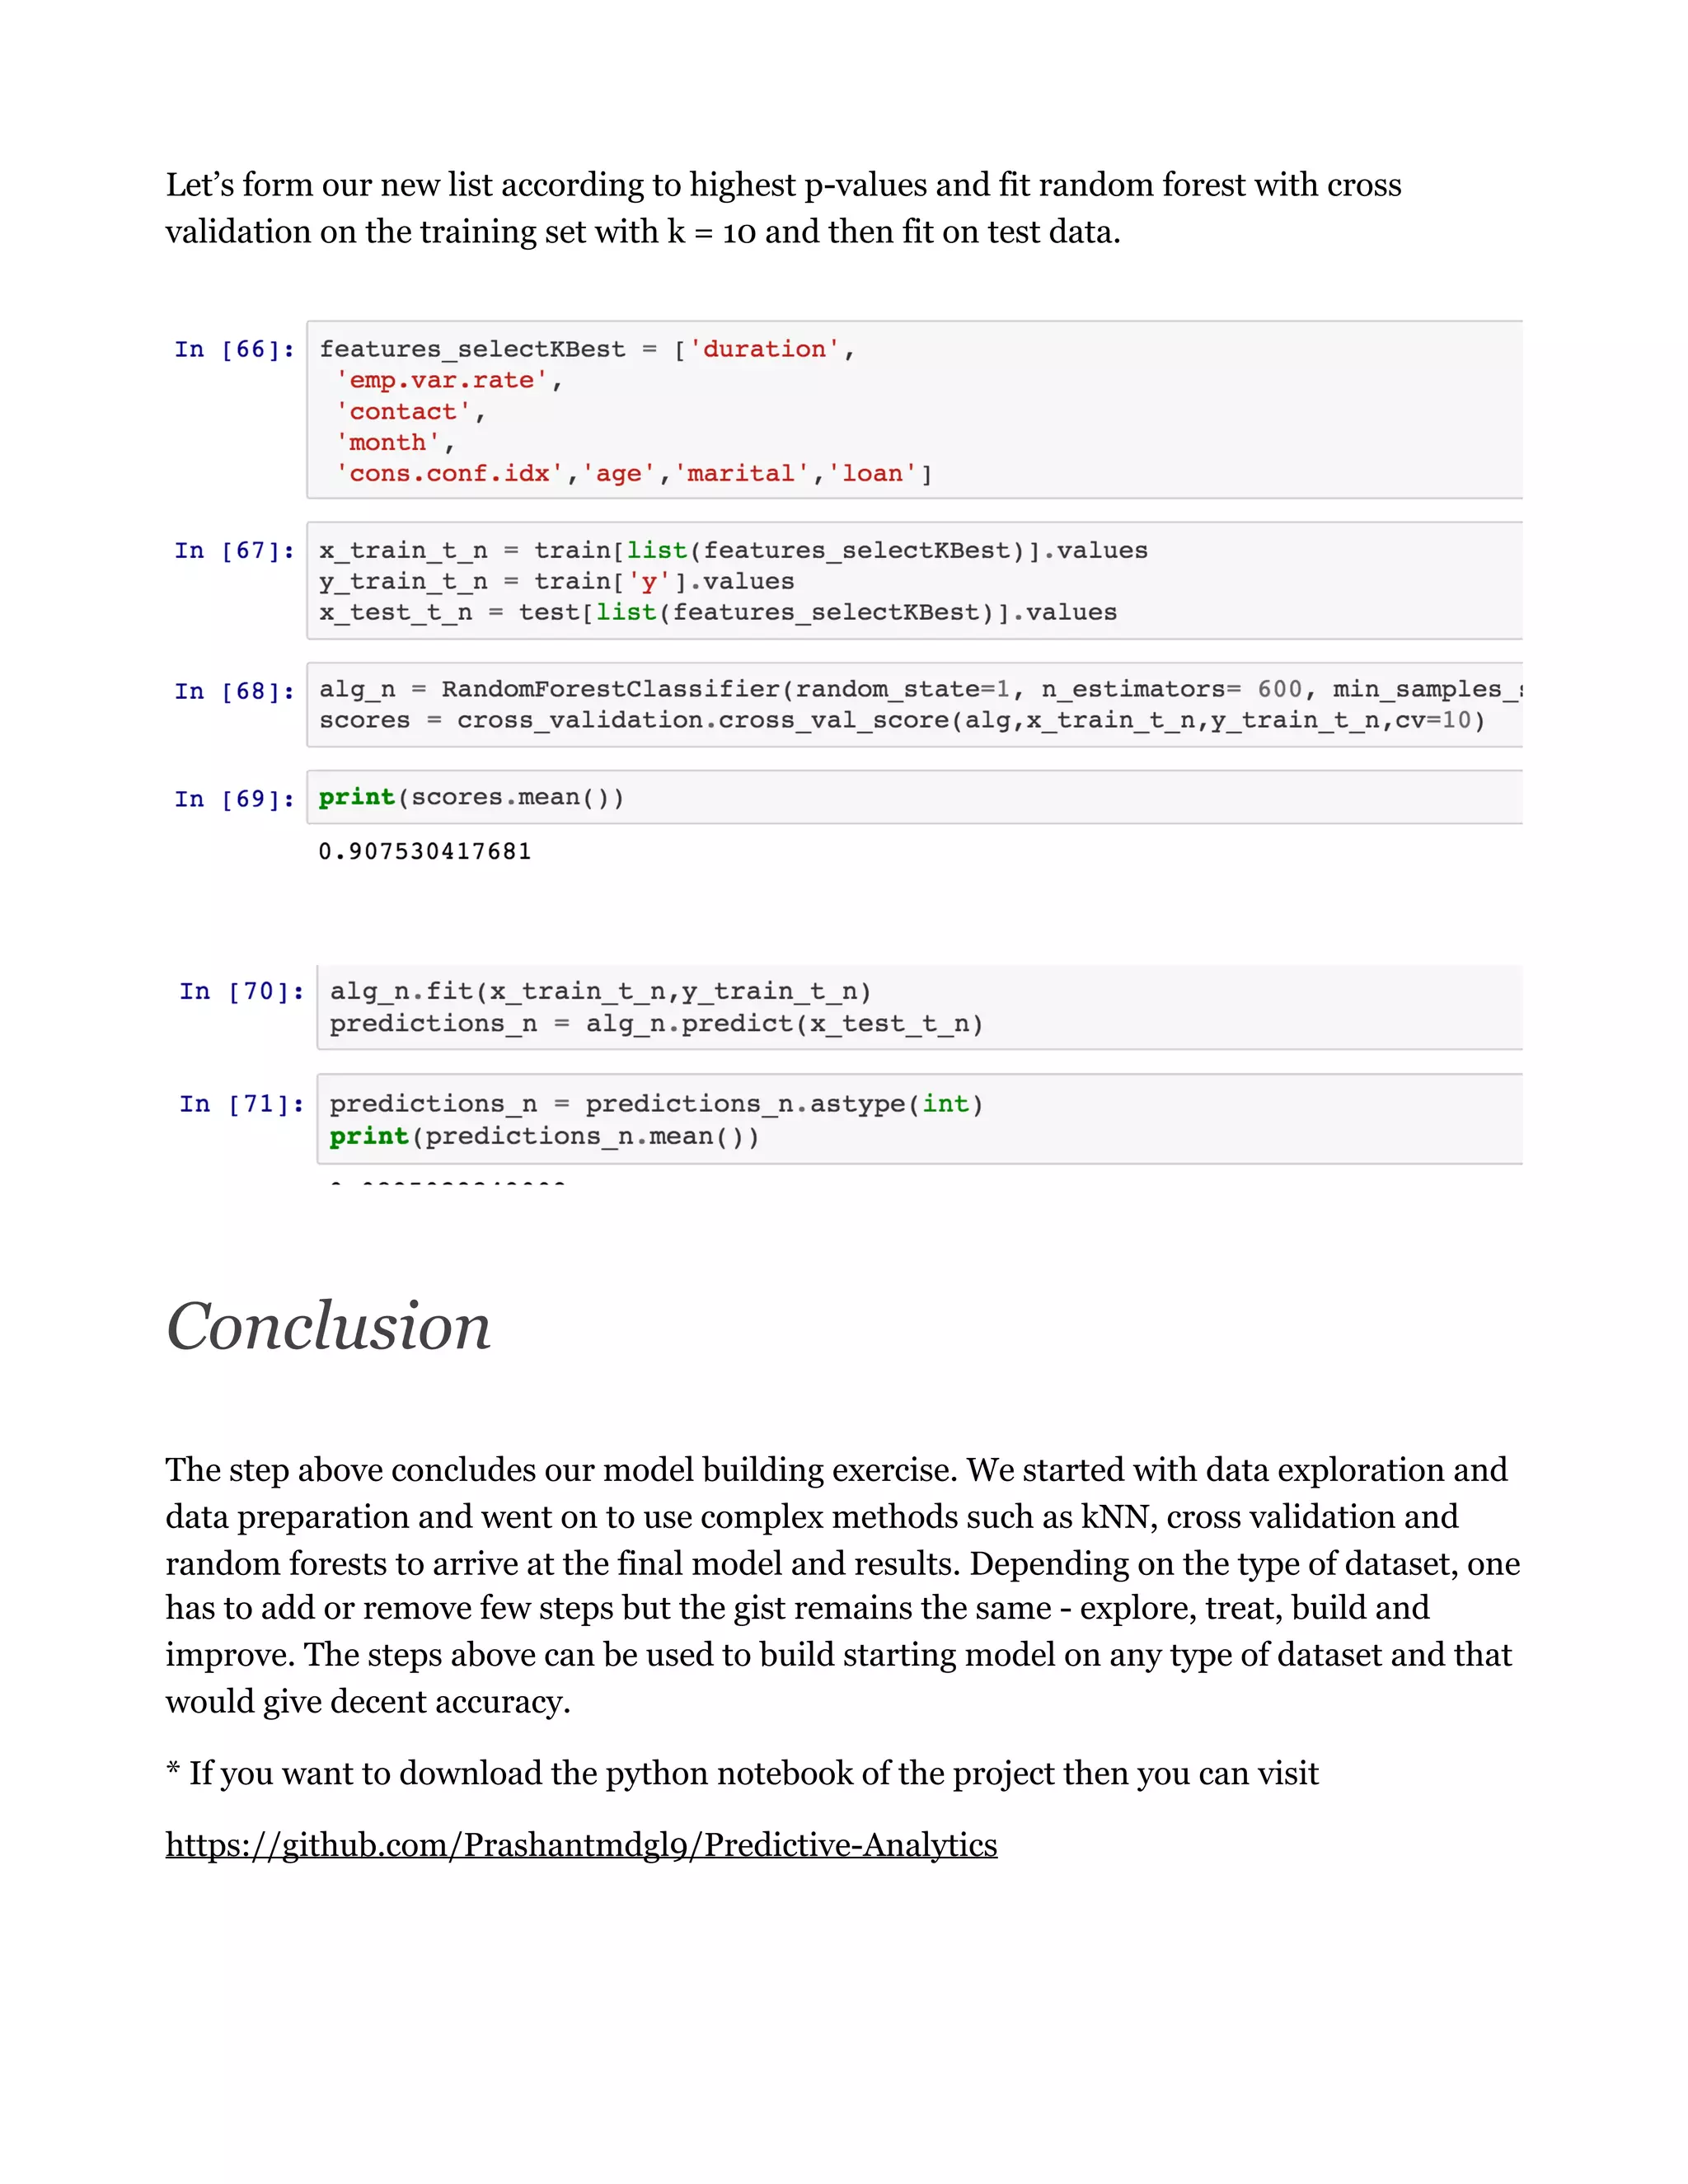

This document provides a practical guide to predictive modeling and data science, focusing on implementation methods for analyzing a sizable banking dataset. It discusses data cleaning, visualization, exploration, model building, and performance estimation techniques using Python, specifically targeting the prediction of bank term deposit subscriptions. The guide aims to introduce new learners to the essential concepts and methodologies in predictive analytics, emphasized through the application of various machine learning techniques.