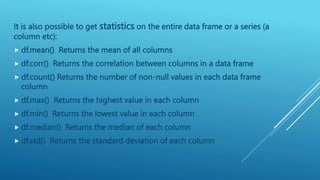
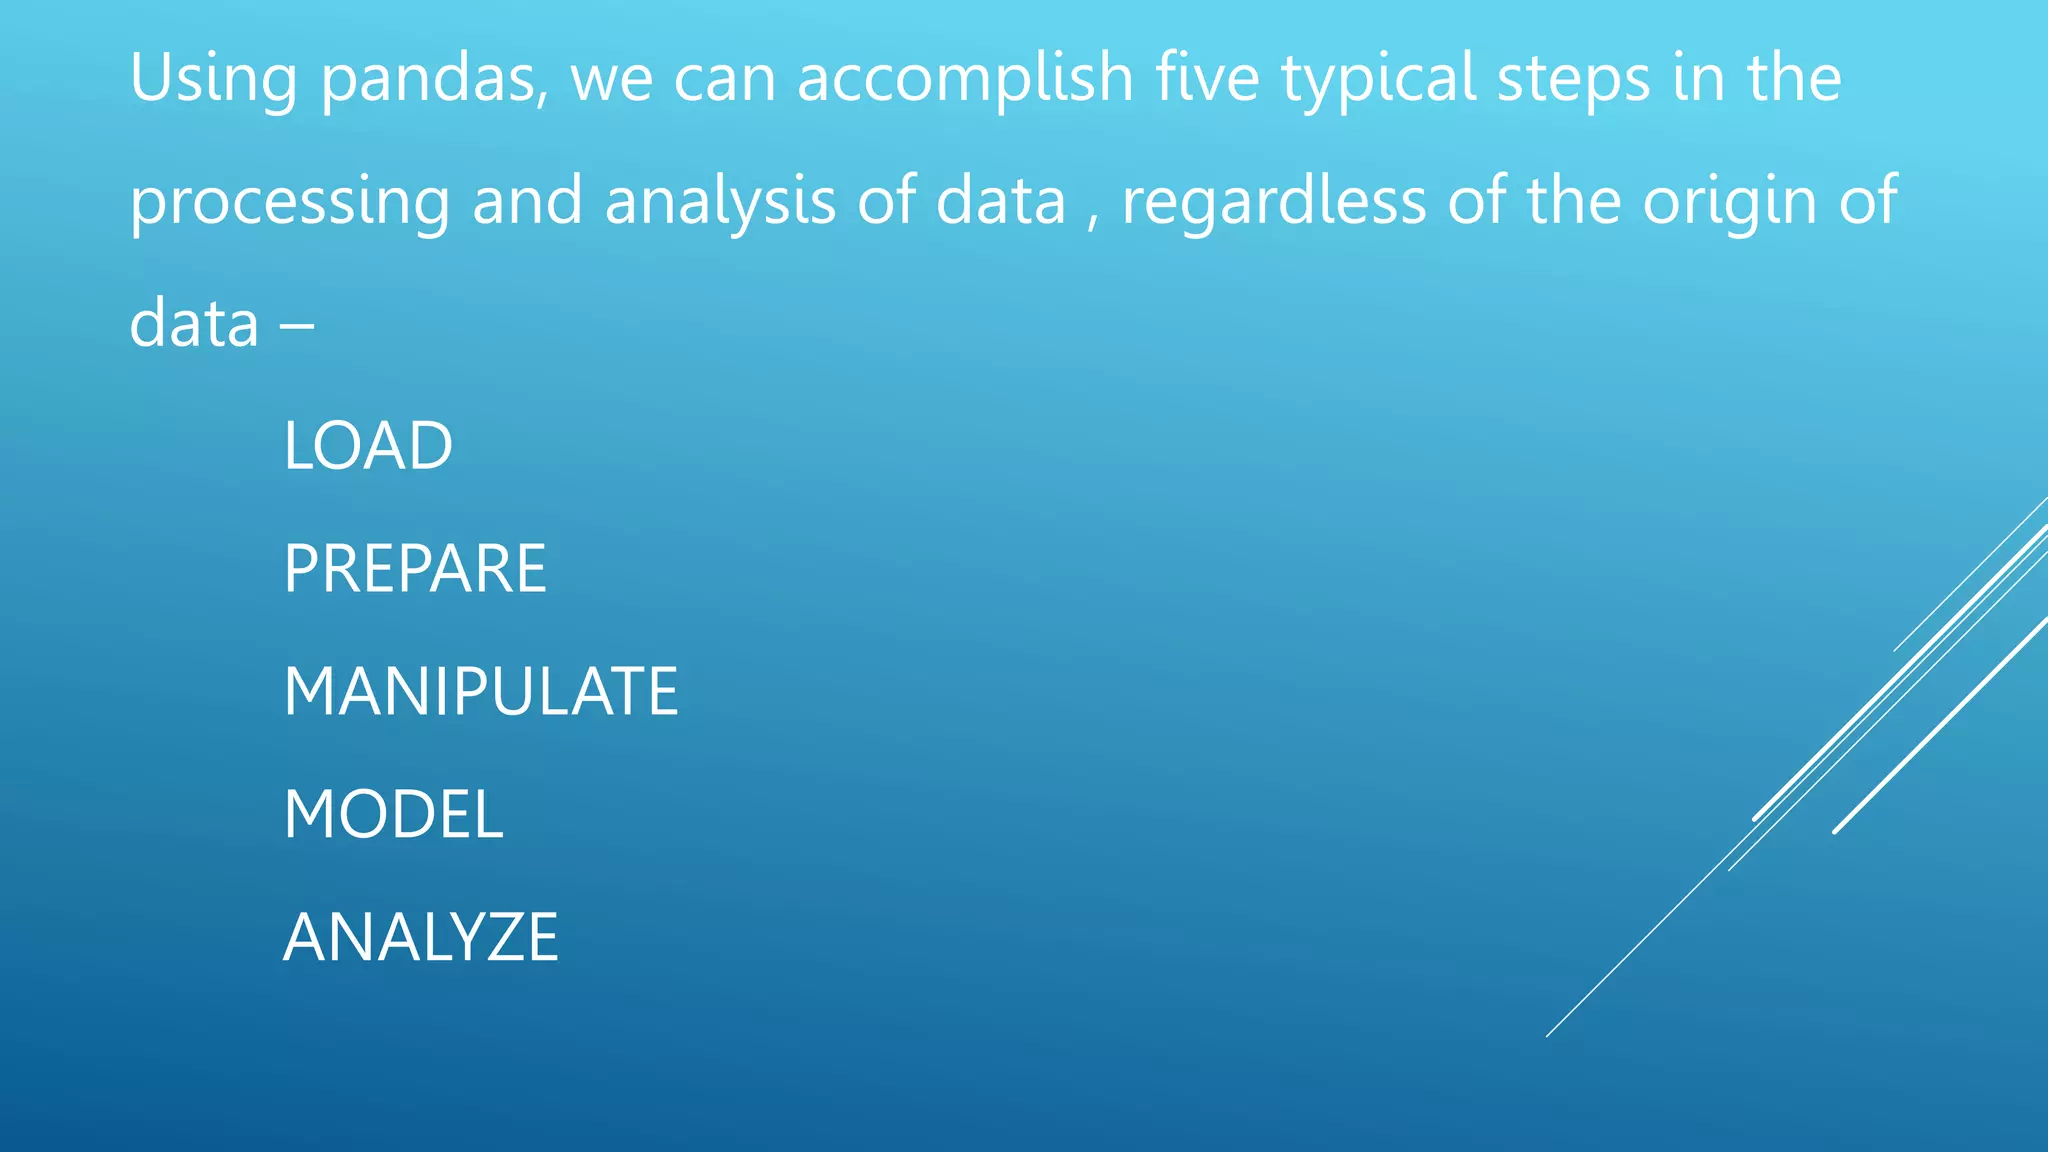
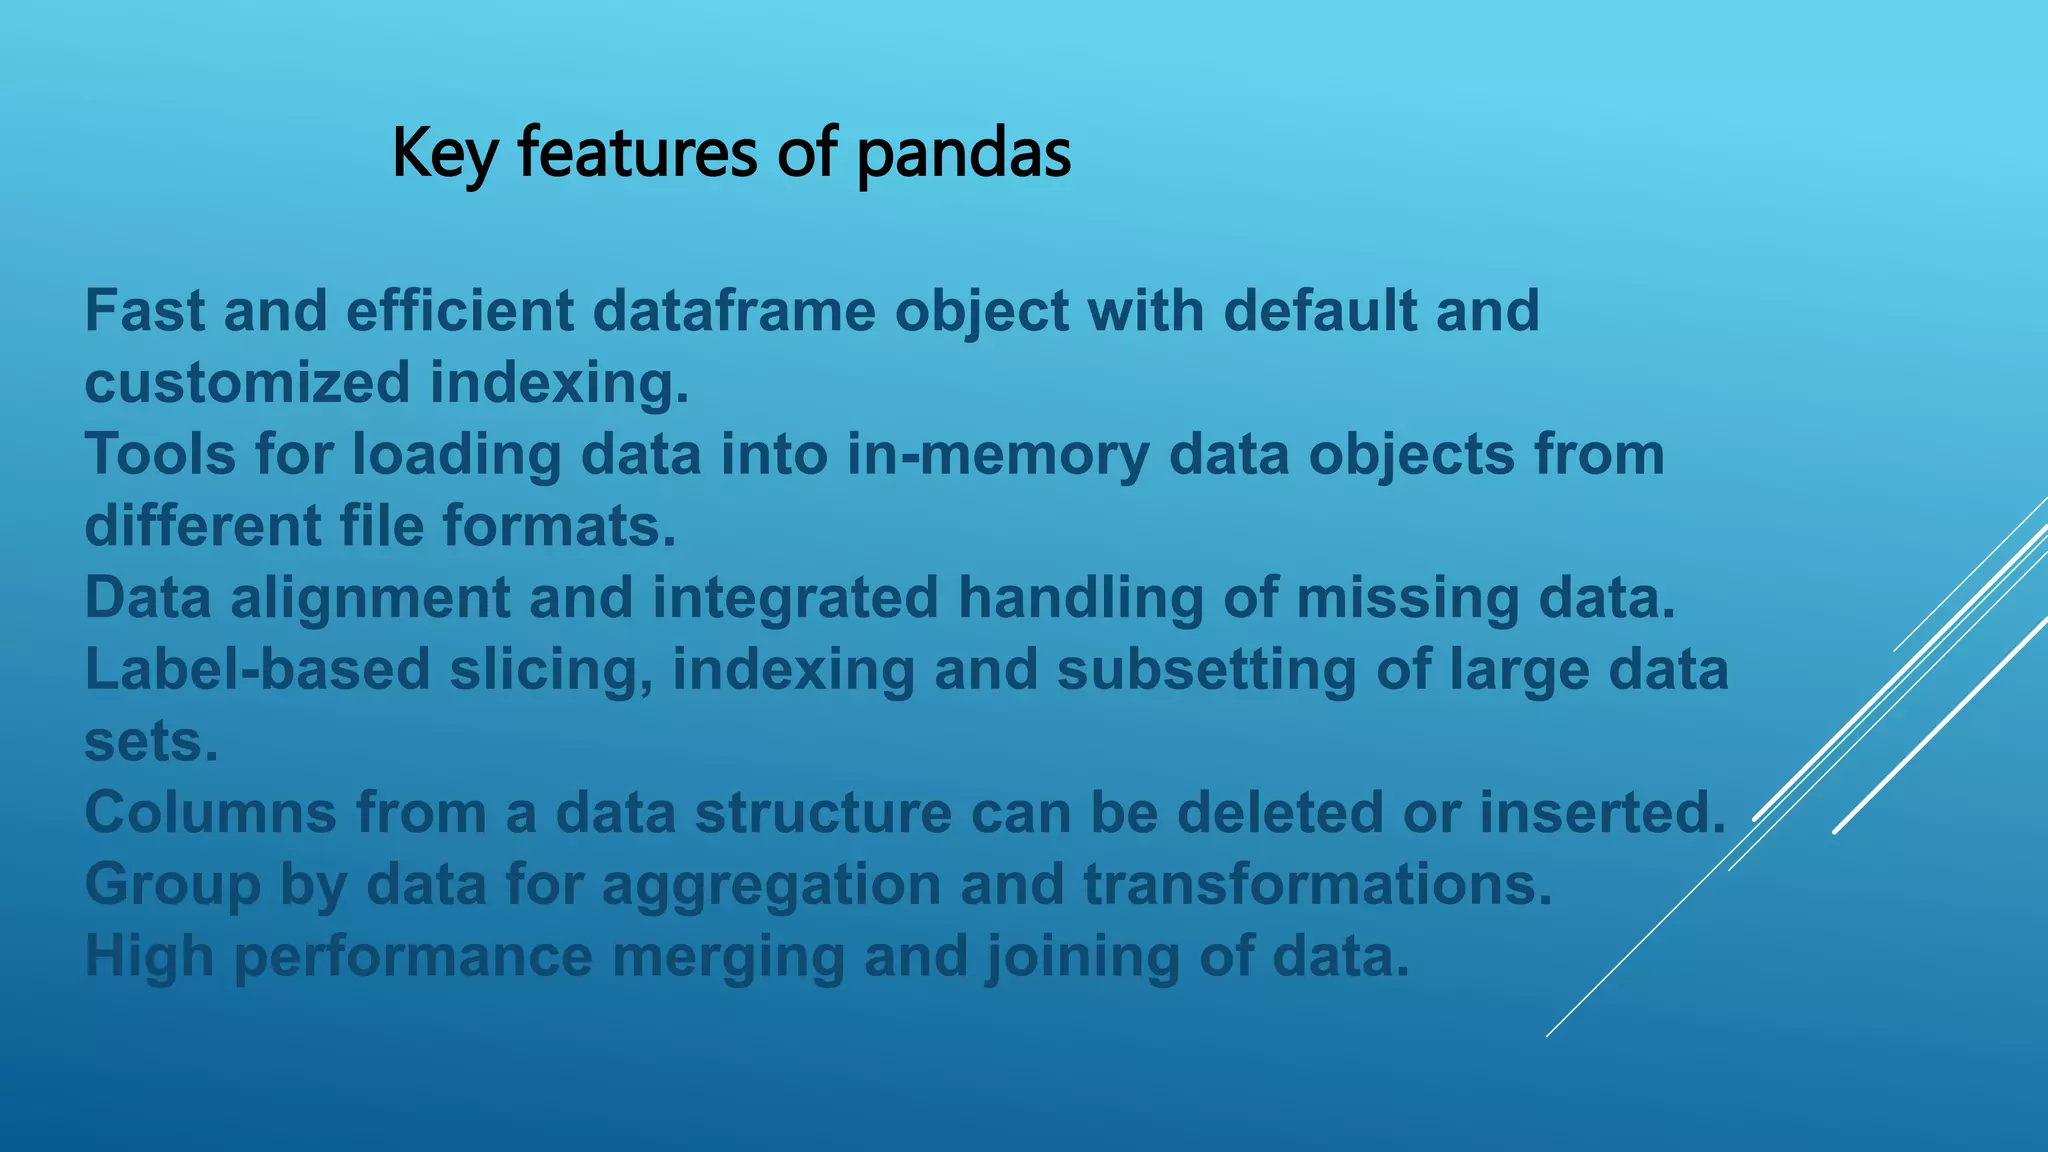
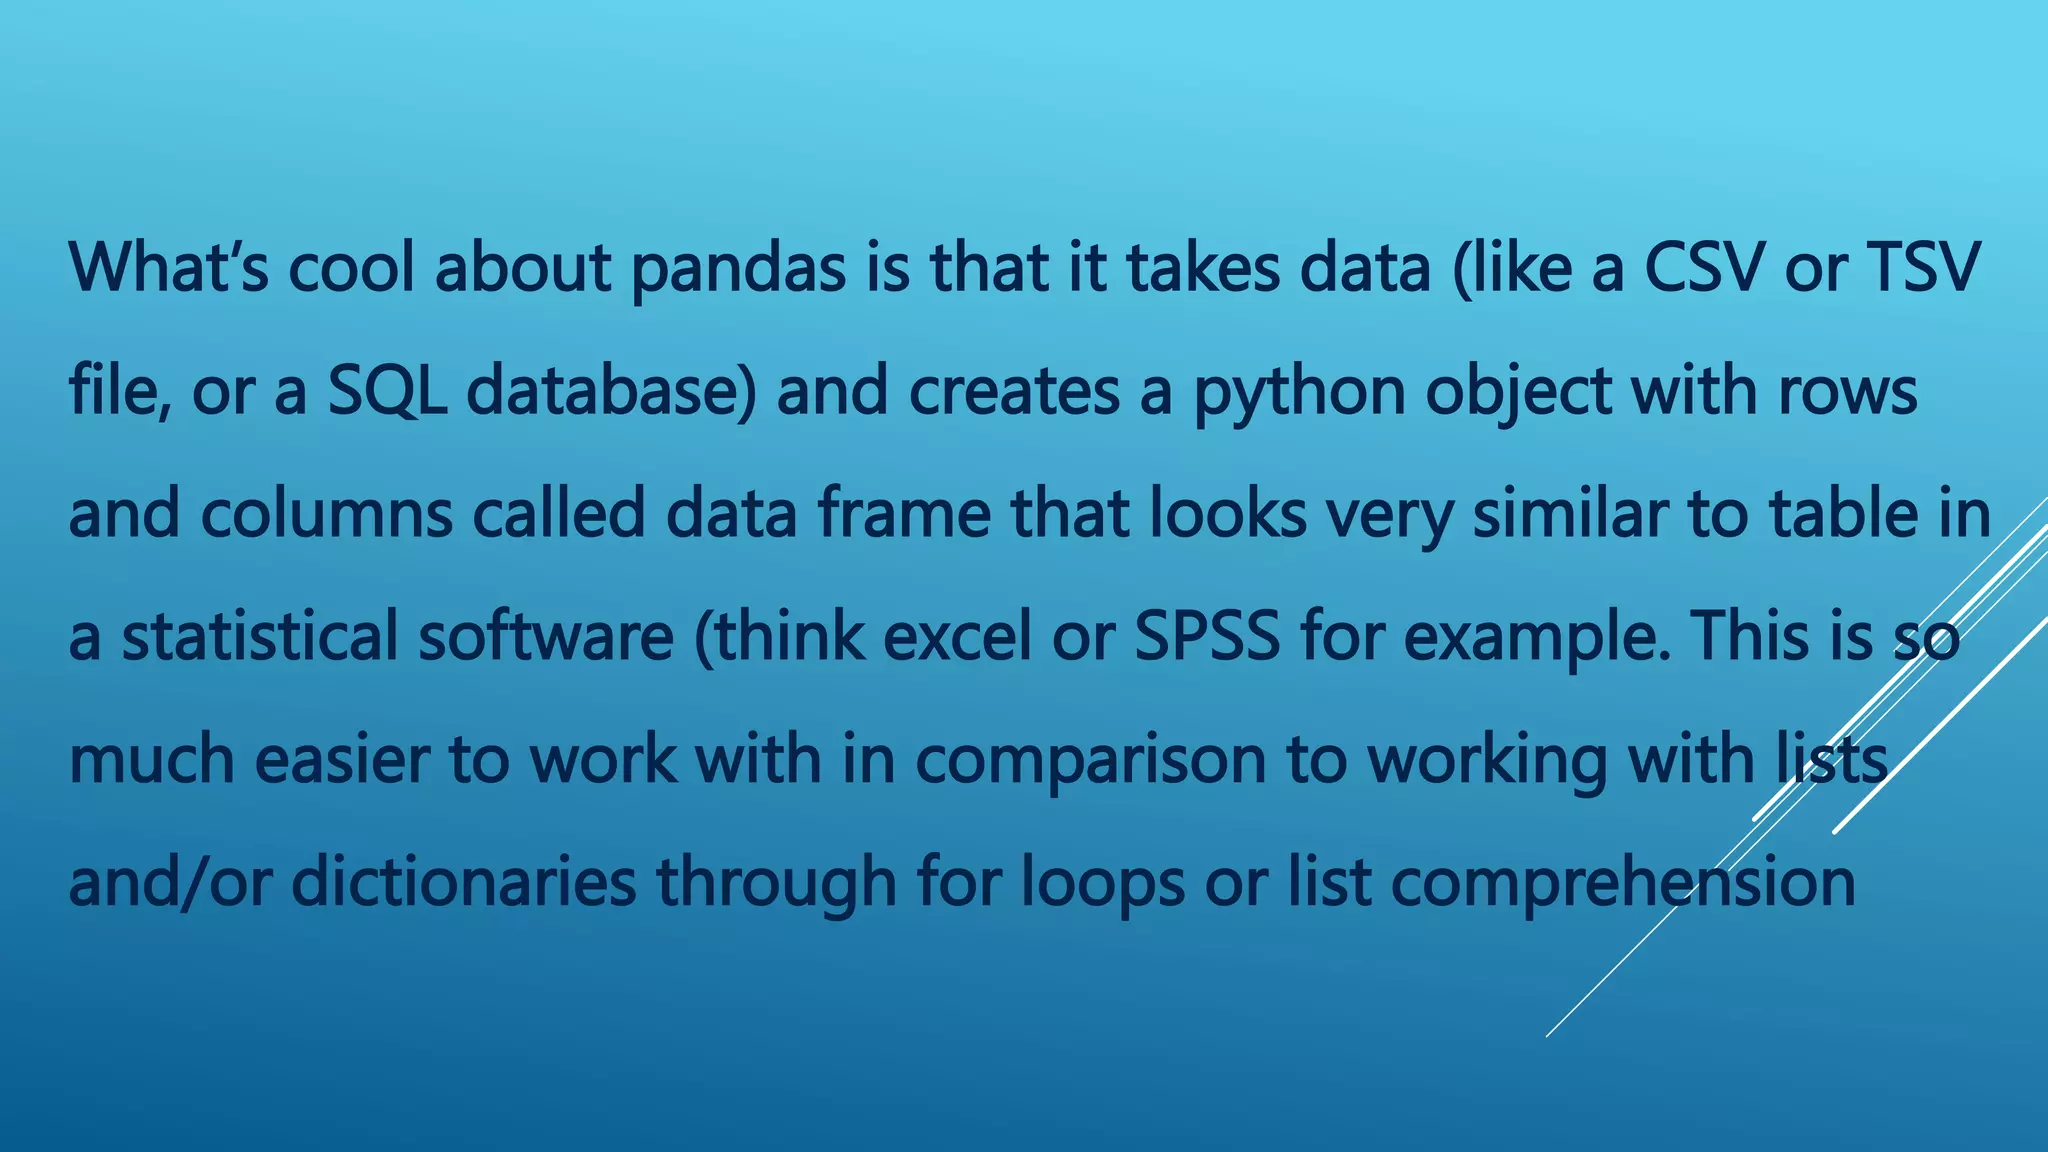
Pandas is a Python library used for data manipulation and analysis. It allows users to load, prepare, manipulate, model and analyze data stored in DataFrames, which are similar to tables with rows and columns. DataFrames make it easier to work with data compared to lists and dictionaries. Key features of pandas include fast operations on DataFrames, tools for loading data from different sources, and handling of missing data.


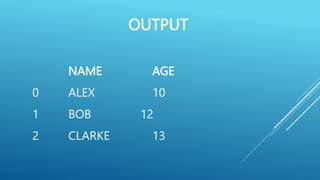
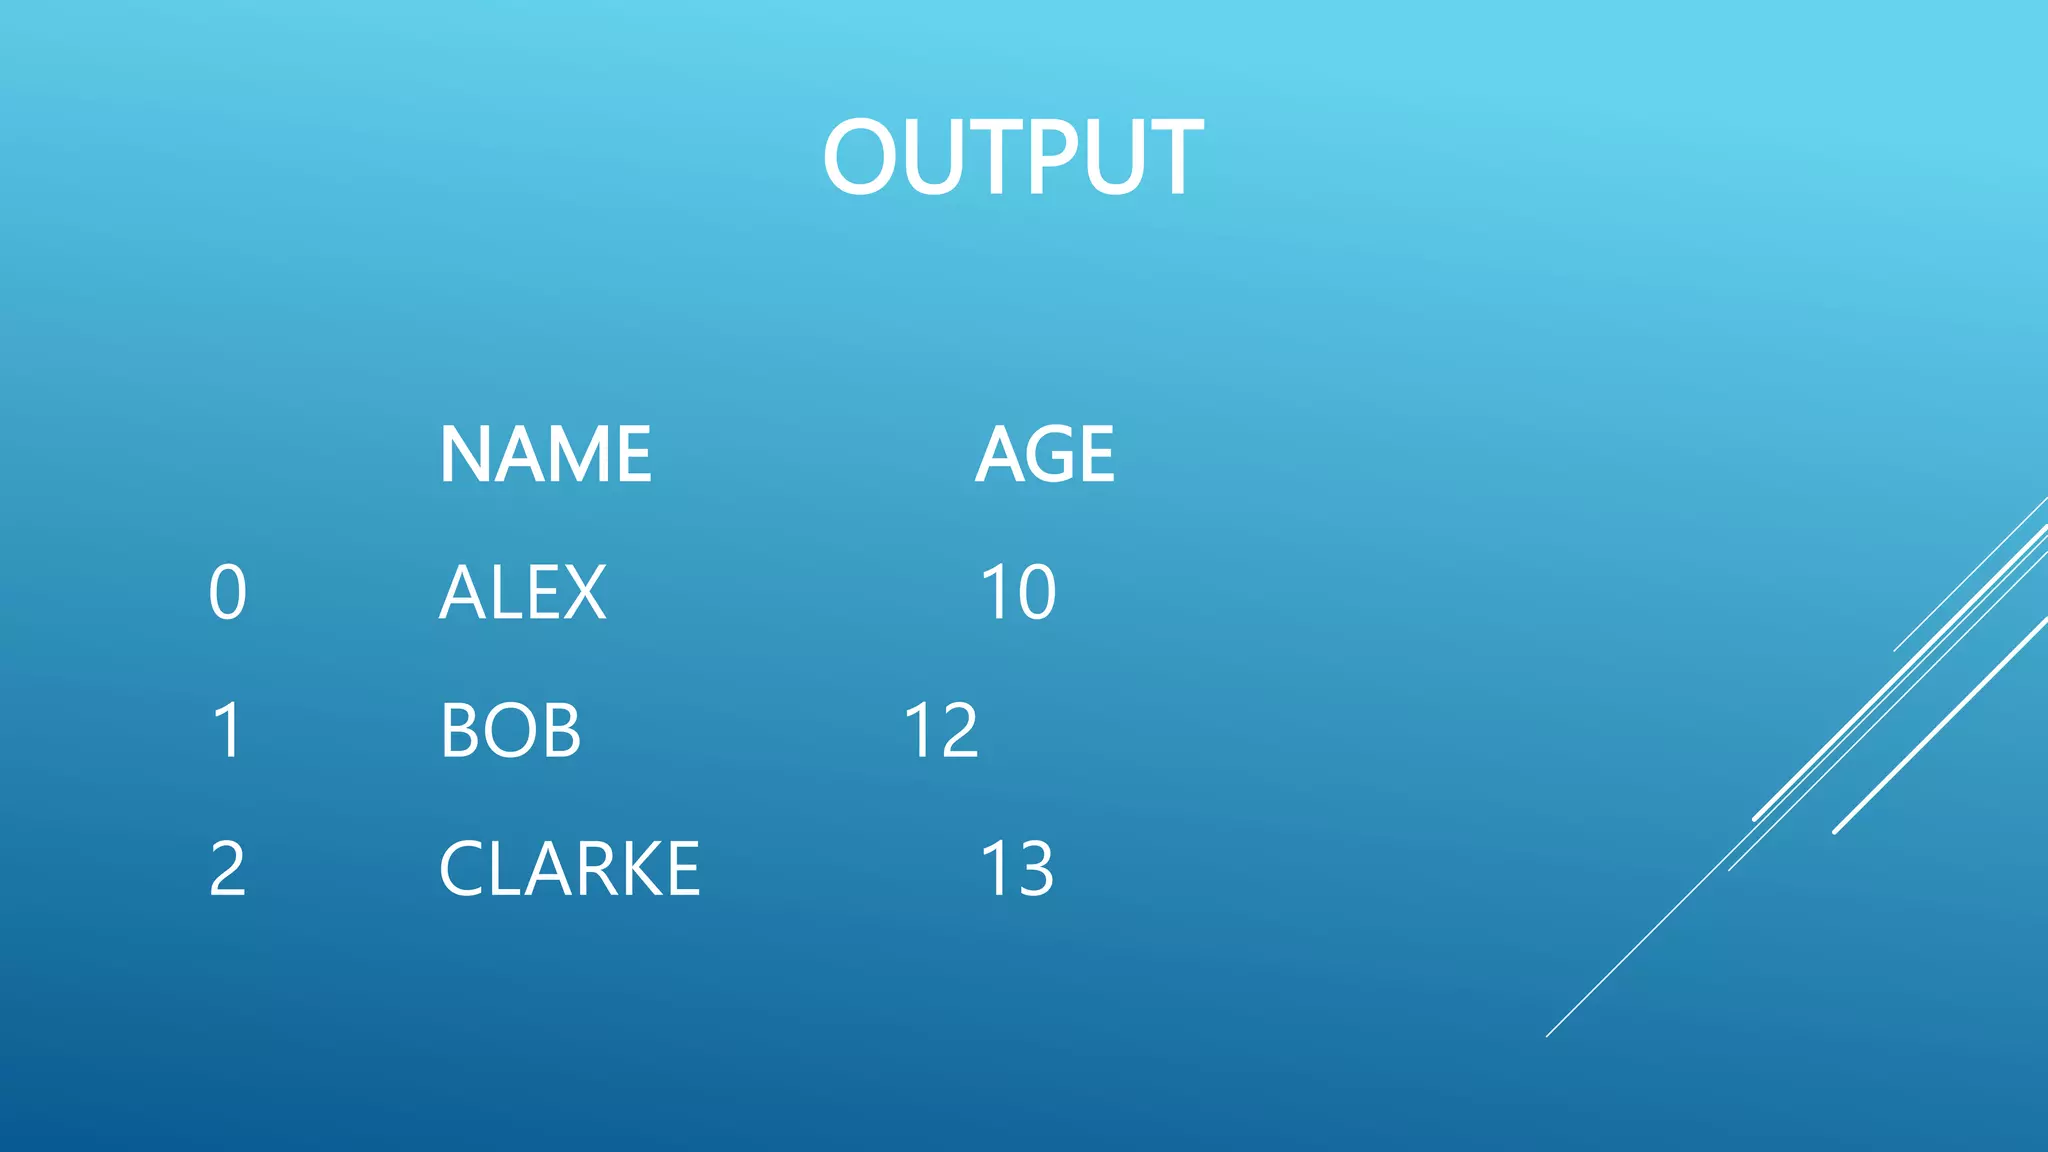
![import pandas as pd
data = [ [ ‘Alex’,10], [‘Bob’,12],[‘Clarke’,13] ]
df = pd.DataFrame (data, columns = [‘Name’ , ‘Age ‘])
print ( df )](https://image.slidesharecdn.com/pythonpandas-230712154907-1d5d0405/85/PYTHON-PANDAS-pptx-11-320.jpg)
![# Create a DataFrame from Dictionary
import pandas as pd
data = { ‘Name ‘ : [ ‘Tom’,’Jack’,’Steve’,’Ricky’], ‘Age’ : [28,34,29,42] }
df = pd.DataFrame (data)
print ( df )](https://image.slidesharecdn.com/pythonpandas-230712154907-1d5d0405/85/PYTHON-PANDAS-pptx-13-320.jpg)

![# Create an indexed DataFrame
import pandas as pd
data = { ‘Name ‘ : [ ‘Tom’,’Jack’,’Steve’,’Ricky’], ‘Age’ : [28,34,29,42] }
df = pd.DataFrame (data, index = [‘rank 1’, ‘rank 2’, ‘rank 3’, ‘rank
4’ ])
print ( df )](https://image.slidesharecdn.com/pythonpandas-230712154907-1d5d0405/85/PYTHON-PANDAS-pptx-15-320.jpg)

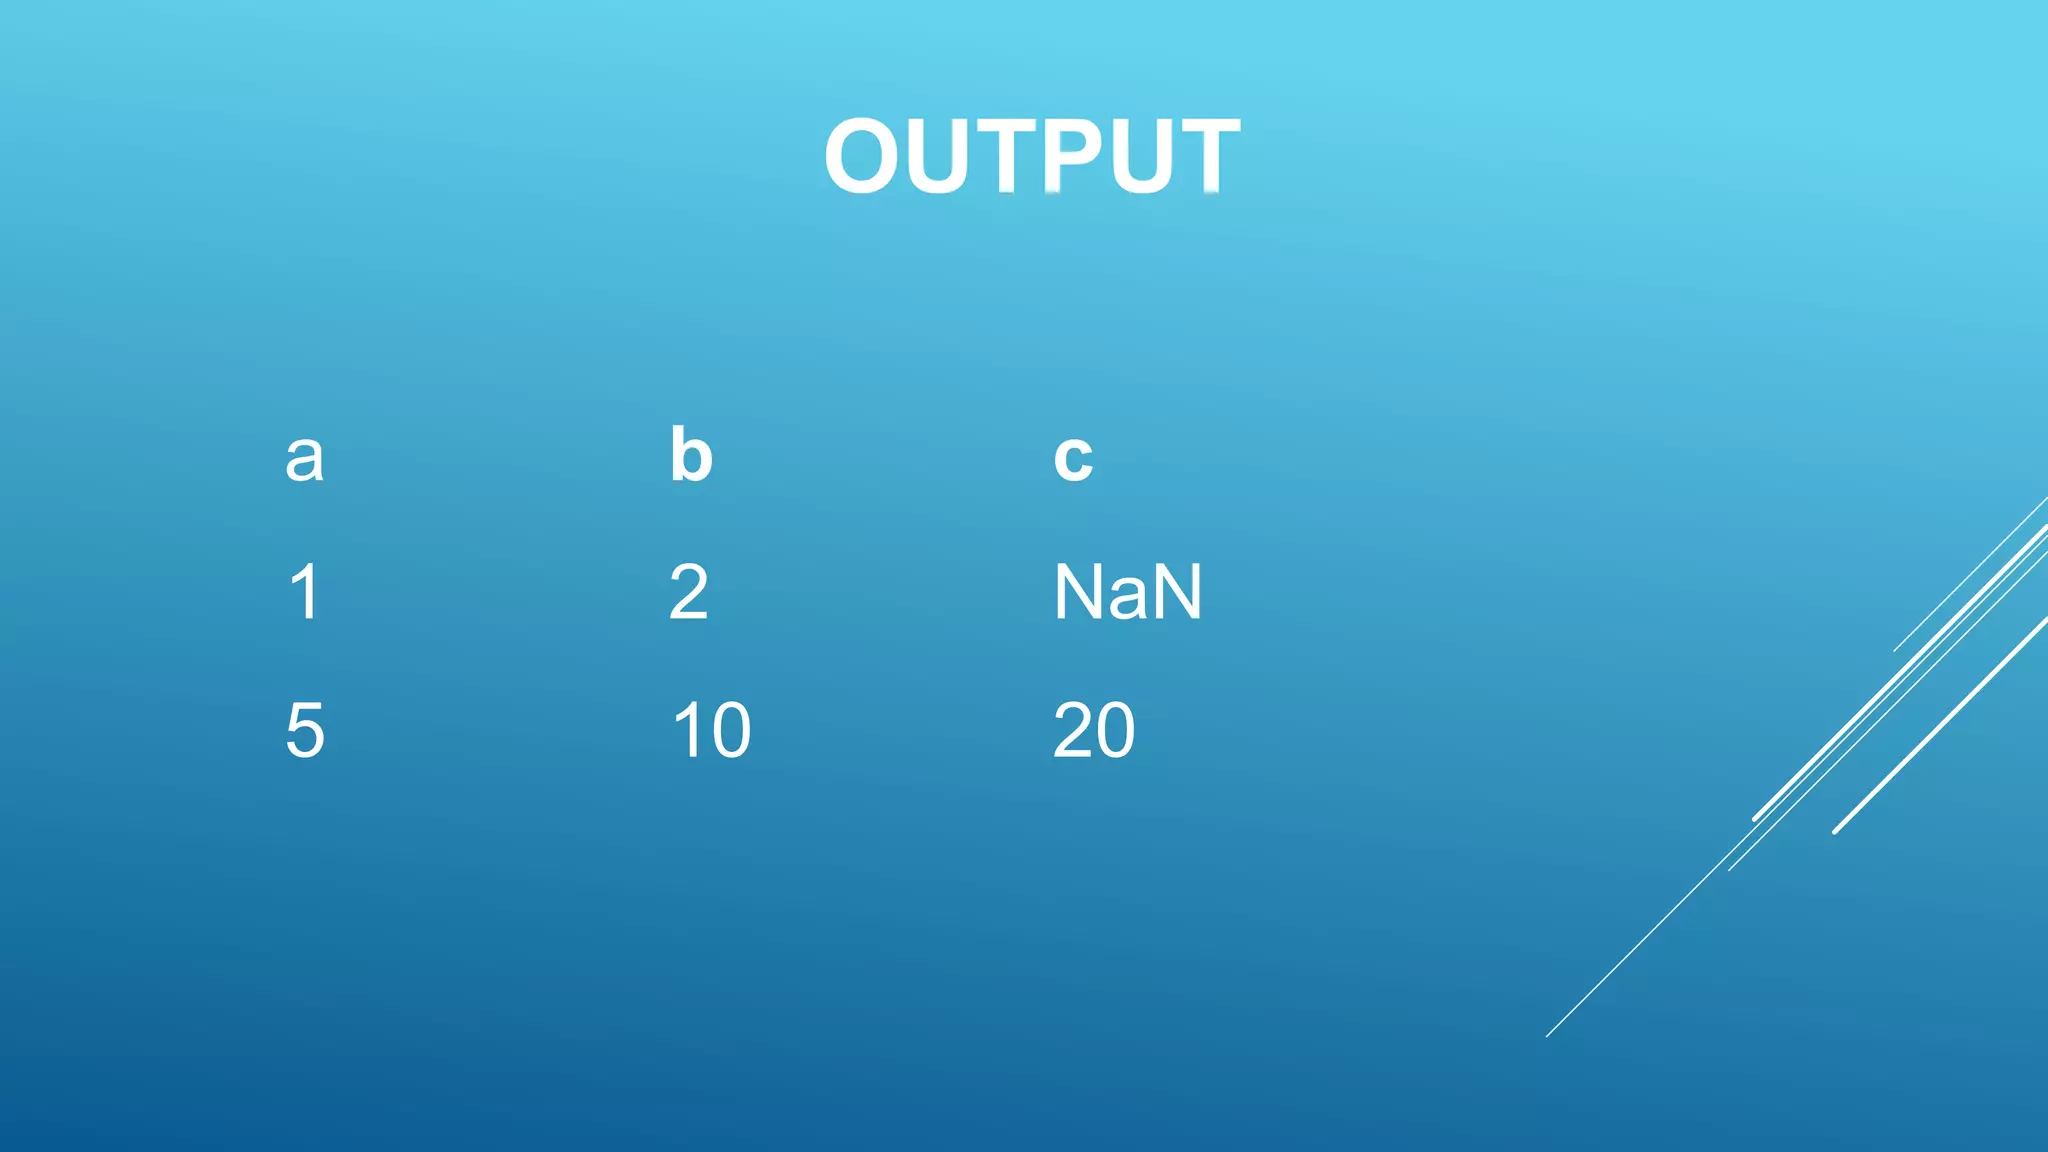
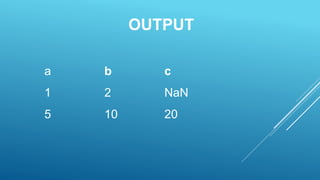
![# Create a DataFrame from List of Dictionaries
import pandas as pd
data = [ { ‘a’ :1 , ‘b’ : 2 } , { ‘a’ : 5 , ‘b’ : 10 , ‘c’ : 20 } ]
df = pd.DataFrame (data)
print ( df )](https://image.slidesharecdn.com/pythonpandas-230712154907-1d5d0405/85/PYTHON-PANDAS-pptx-17-320.jpg)


![import pandas as pd
data = [ [ ‘Alex’,10], [‘Bob’,12],[‘Clarke’,13] ]
df = pd.DataFrame (data, columns = [‘Name’ , ‘Age ‘])
print ( df )](https://image.slidesharecdn.com/pythonpandas-230712154907-1d5d0405/75/PYTHON-PANDAS-pptx-11-2048.jpg)
![# Create a DataFrame from Dictionary
import pandas as pd
data = { ‘Name ‘ : [ ‘Tom’,’Jack’,’Steve’,’Ricky’], ‘Age’ : [28,34,29,42] }
df = pd.DataFrame (data)
print ( df )](https://image.slidesharecdn.com/pythonpandas-230712154907-1d5d0405/75/PYTHON-PANDAS-pptx-13-2048.jpg)

![# Create an indexed DataFrame
import pandas as pd
data = { ‘Name ‘ : [ ‘Tom’,’Jack’,’Steve’,’Ricky’], ‘Age’ : [28,34,29,42] }
df = pd.DataFrame (data, index = [‘rank 1’, ‘rank 2’, ‘rank 3’, ‘rank
4’ ])
print ( df )](https://image.slidesharecdn.com/pythonpandas-230712154907-1d5d0405/75/PYTHON-PANDAS-pptx-15-2048.jpg)

![# Create a DataFrame from List of Dictionaries
import pandas as pd
data = [ { ‘a’ :1 , ‘b’ : 2 } , { ‘a’ : 5 , ‘b’ : 10 , ‘c’ : 20 } ]
df = pd.DataFrame (data)
print ( df )](https://image.slidesharecdn.com/pythonpandas-230712154907-1d5d0405/75/PYTHON-PANDAS-pptx-17-2048.jpg)