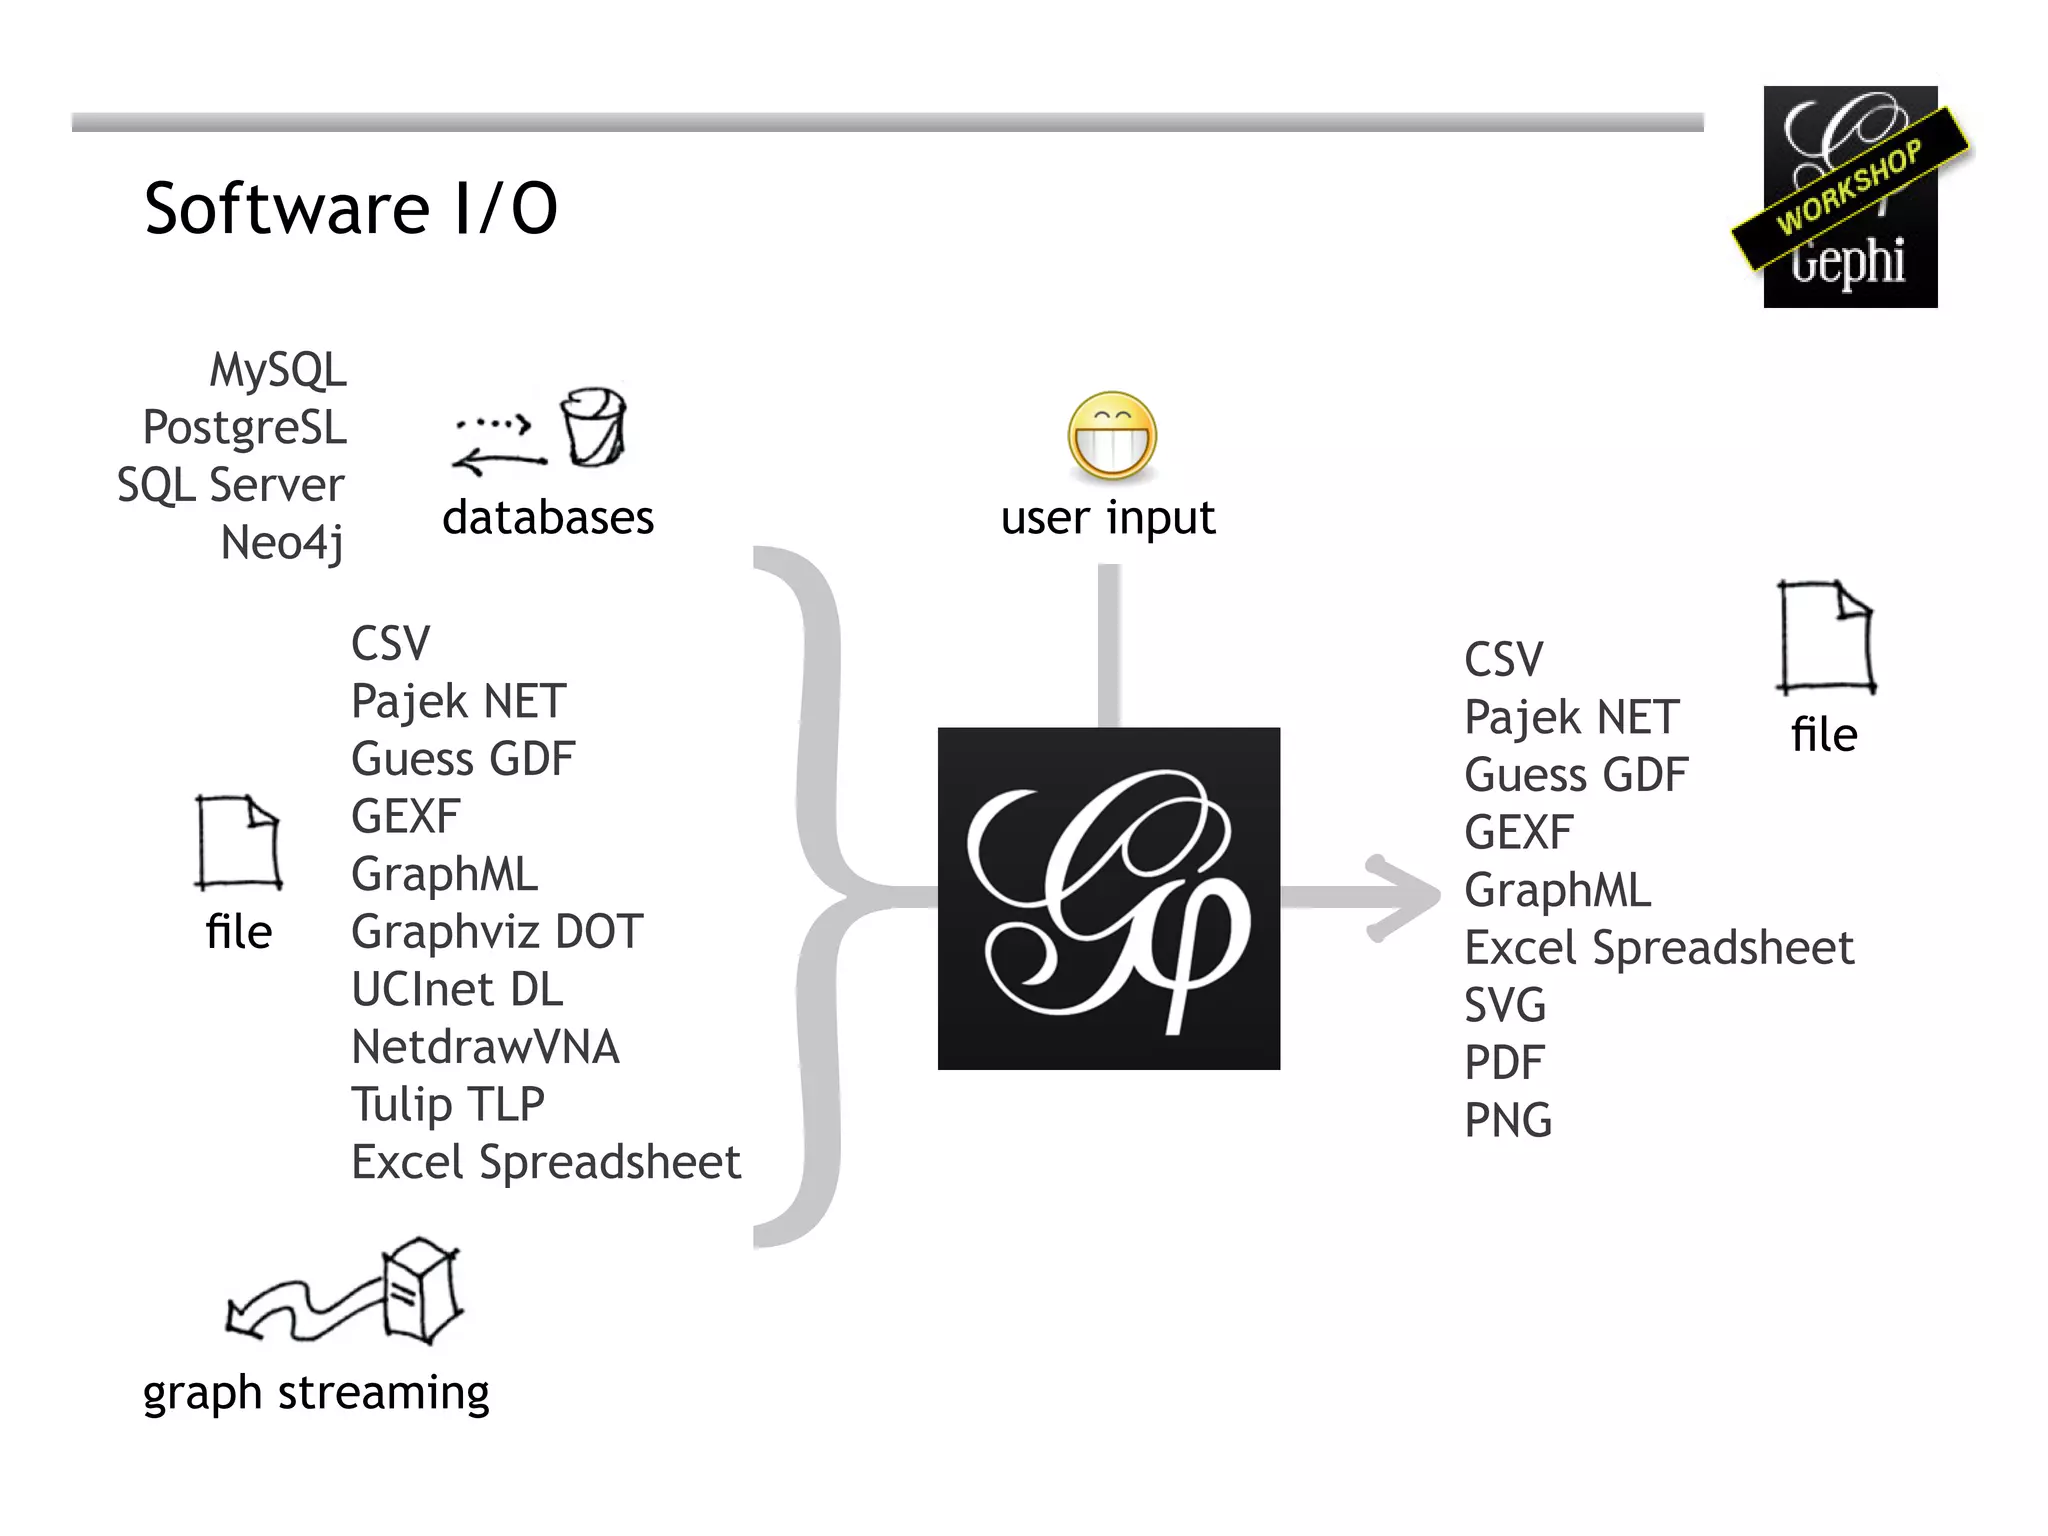
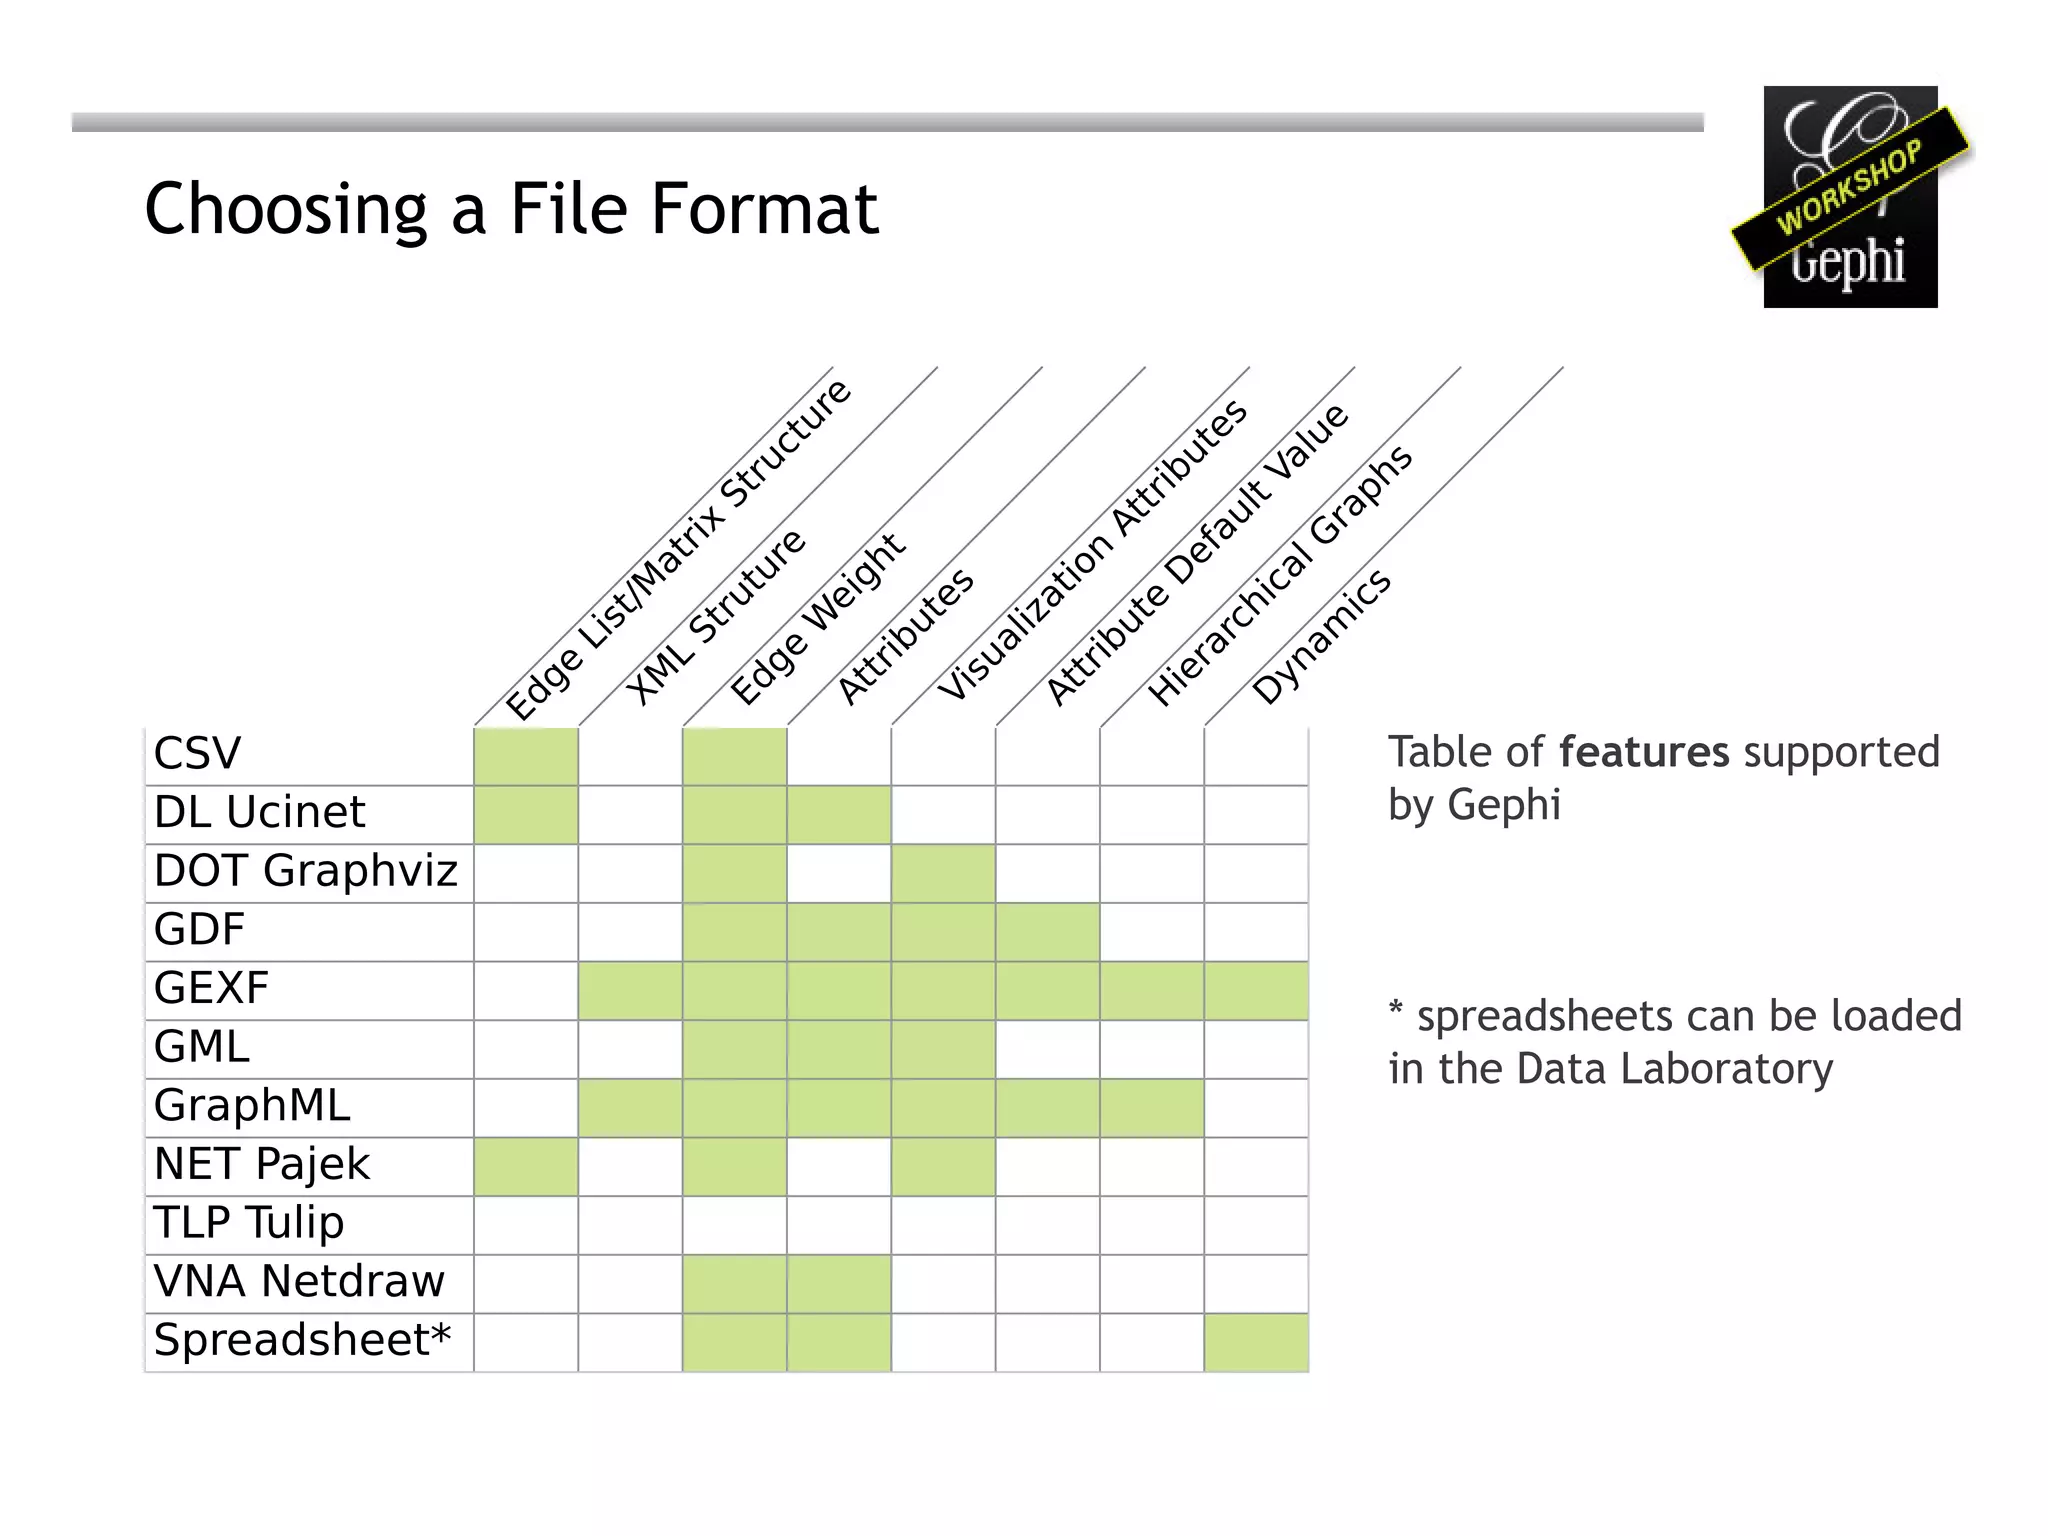
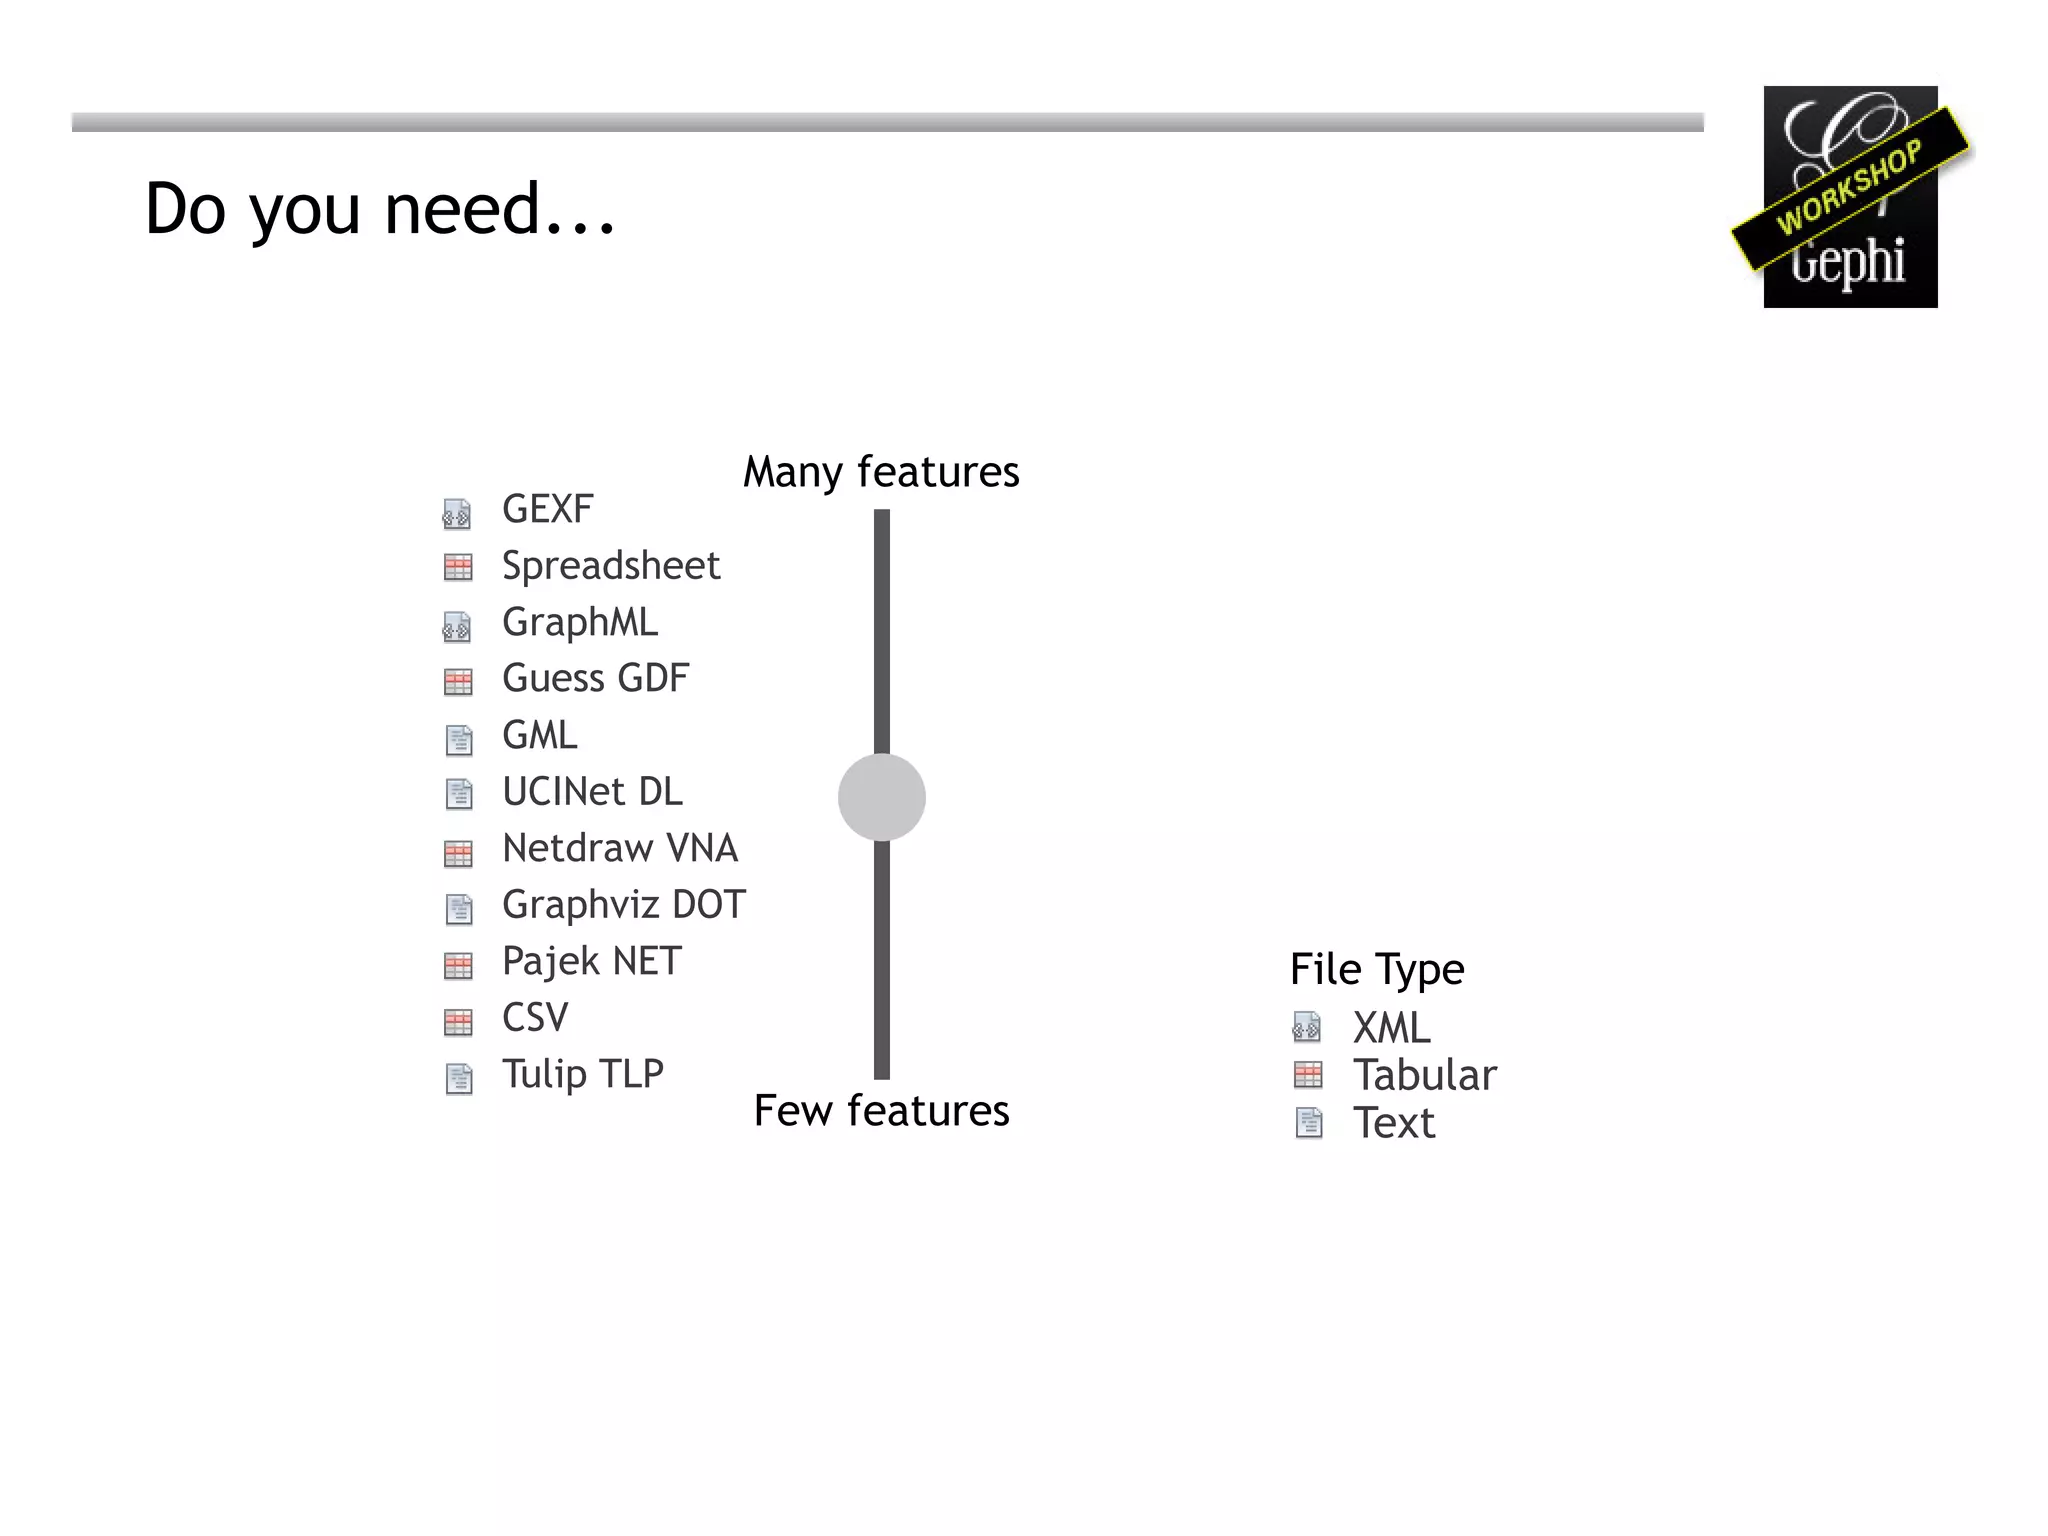
Download as PDF, PPTX
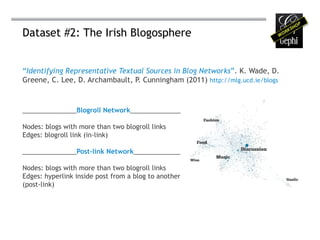
![Requirements
Bring your own laptop with Java and Gephi installed.
Gephi should be updated (menu Help > Check for Updates).
Bring a mouse with a wheel.
Bring a dataset of your own if you want, verify if it loads well in Gephi.[1]
[1] http://gephi.org/users/supported-graph-formats/](https://image.slidesharecdn.com/gephi-icwsm-tutorial-110717064641-phpapp02/85/SP1-Exploratory-Network-Analysis-with-Gephi-4-320.jpg)
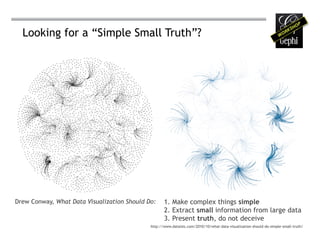


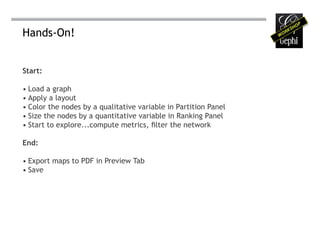

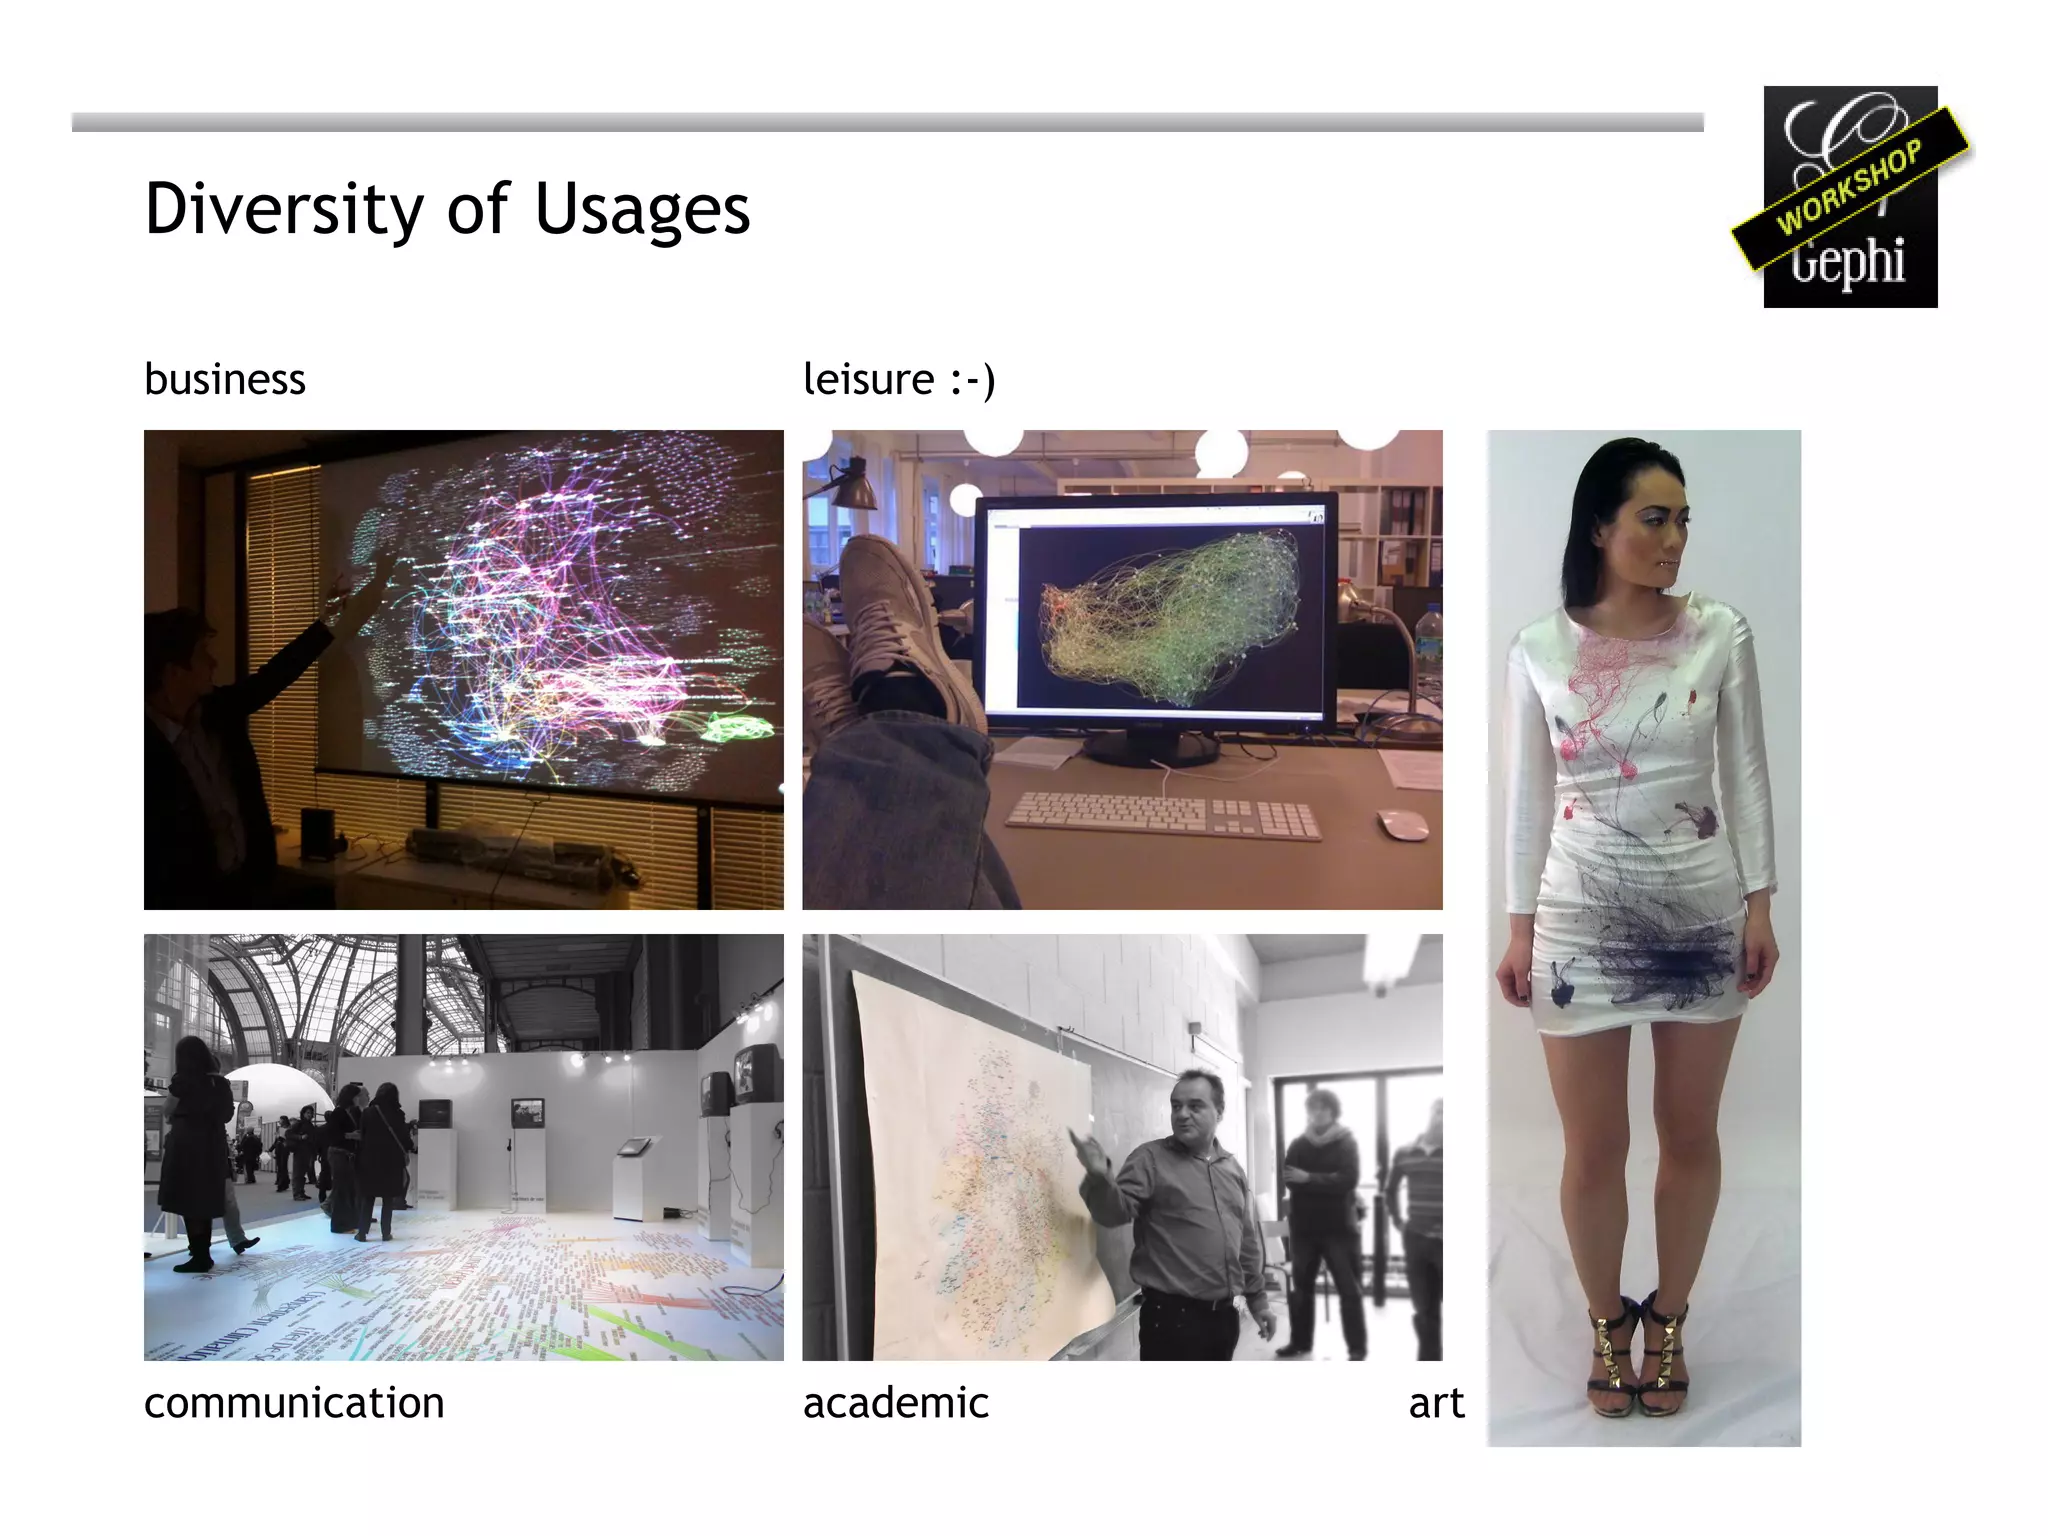
![Credits
[slide 11] images from Drew Conway
http://www.dataists.com/2010/10/what-data-visualization-should-do-simple-small-truth/
[slide 22 top left] Benoît Vidal at MFG Labs
[slide 22 bottom center] Franck Ghitalla at UTC
[slide 22 right] Studies in MA Digital Fashion at LCF by Peter Jeun Ho Tsang
http://jeunhotsang.com/blog/2010/12/07/prototype/
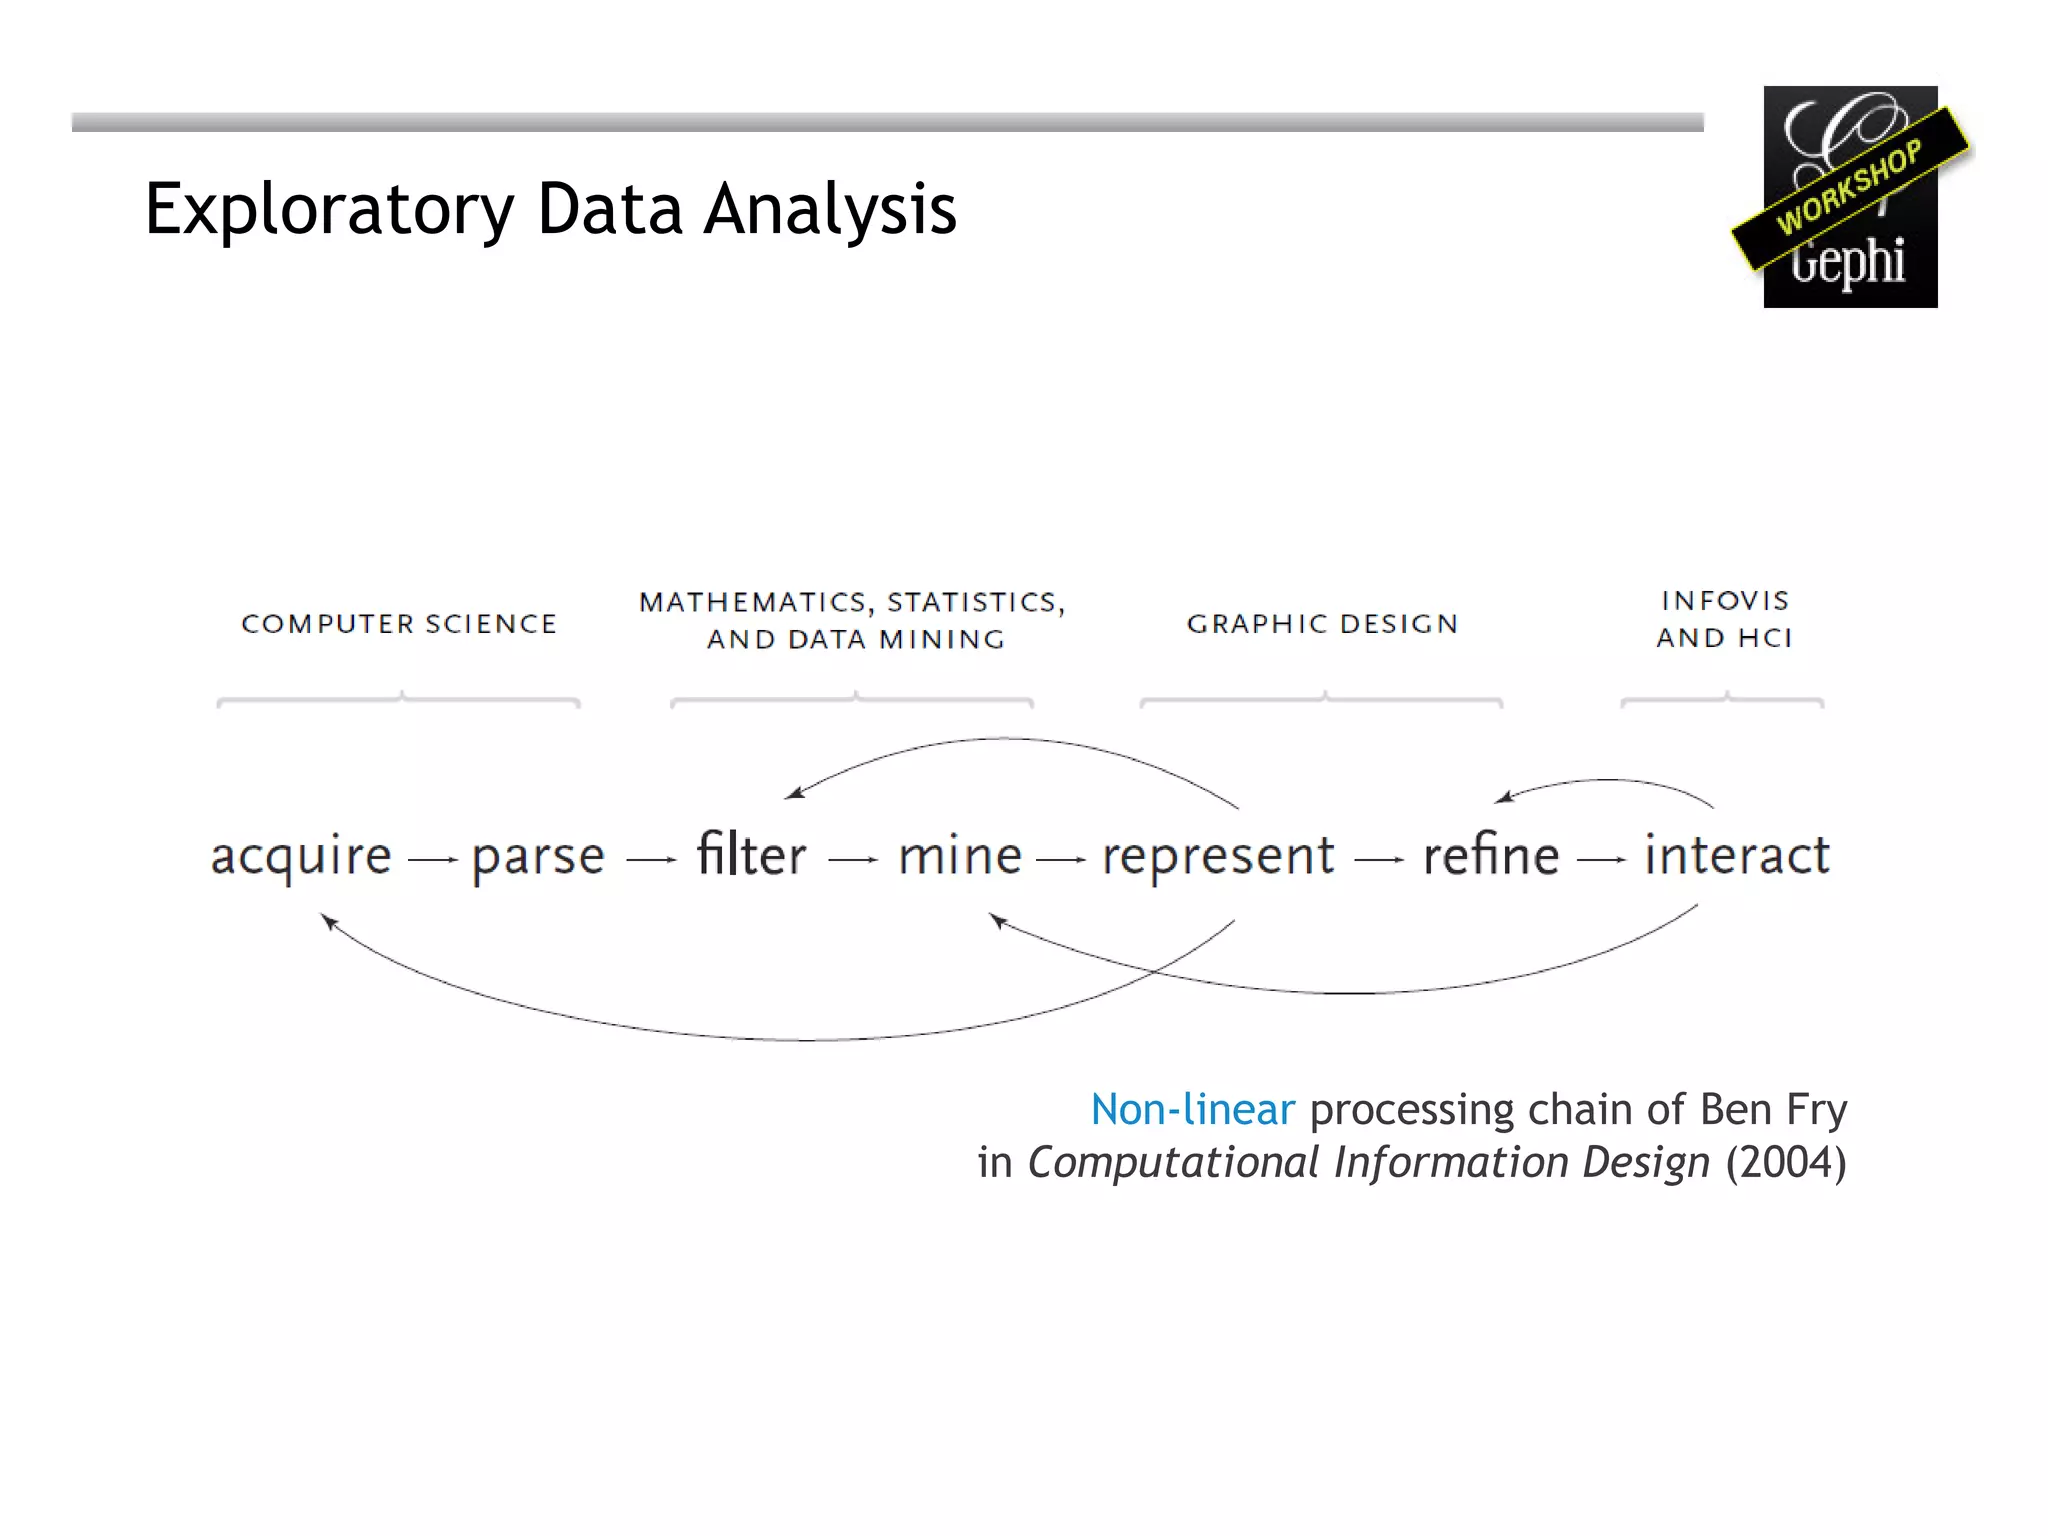
[slide 27] sketches from Ben Fry, Computational Information Design
Special Thanks to Franck Ghitalla and Mathieu Jacomy
for their insightful discussions.](https://image.slidesharecdn.com/gephi-icwsm-tutorial-110717064641-phpapp02/85/SP1-Exploratory-Network-Analysis-with-Gephi-43-320.jpg)
![Requirements
Bring your own laptop with Java and Gephi installed.
Gephi should be updated (menu Help > Check for Updates).
Bring a mouse with a wheel.
Bring a dataset of your own if you want, verify if it loads well in Gephi.[1]
[1] http://gephi.org/users/supported-graph-formats/](https://image.slidesharecdn.com/gephi-icwsm-tutorial-110717064641-phpapp02/75/SP1-Exploratory-Network-Analysis-with-Gephi-4-2048.jpg)


![Credits
[slide 11] images from Drew Conway
http://www.dataists.com/2010/10/what-data-visualization-should-do-simple-small-truth/
[slide 22 top left] Benoît Vidal at MFG Labs
[slide 22 bottom center] Franck Ghitalla at UTC
[slide 22 right] Studies in MA Digital Fashion at LCF by Peter Jeun Ho Tsang
http://jeunhotsang.com/blog/2010/12/07/prototype/
[slide 27] sketches from Ben Fry, Computational Information Design
Special Thanks to Franck Ghitalla and Mathieu Jacomy
for their insightful discussions.](https://image.slidesharecdn.com/gephi-icwsm-tutorial-110717064641-phpapp02/75/SP1-Exploratory-Network-Analysis-with-Gephi-43-2048.jpg)

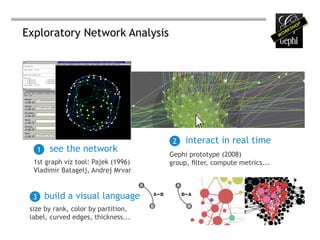
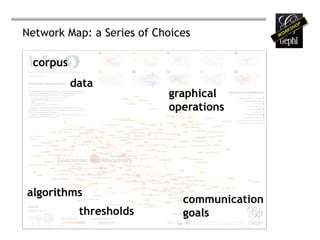
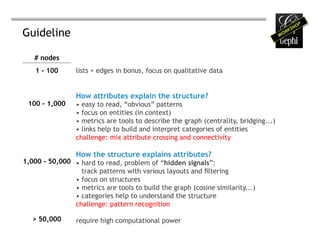
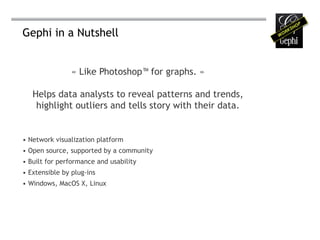
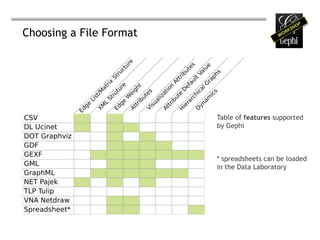
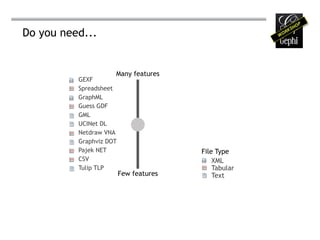
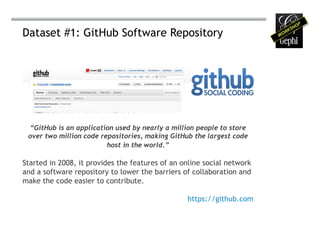
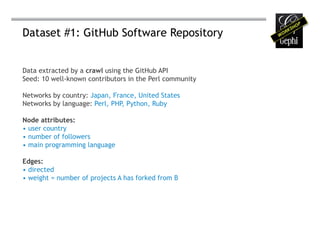
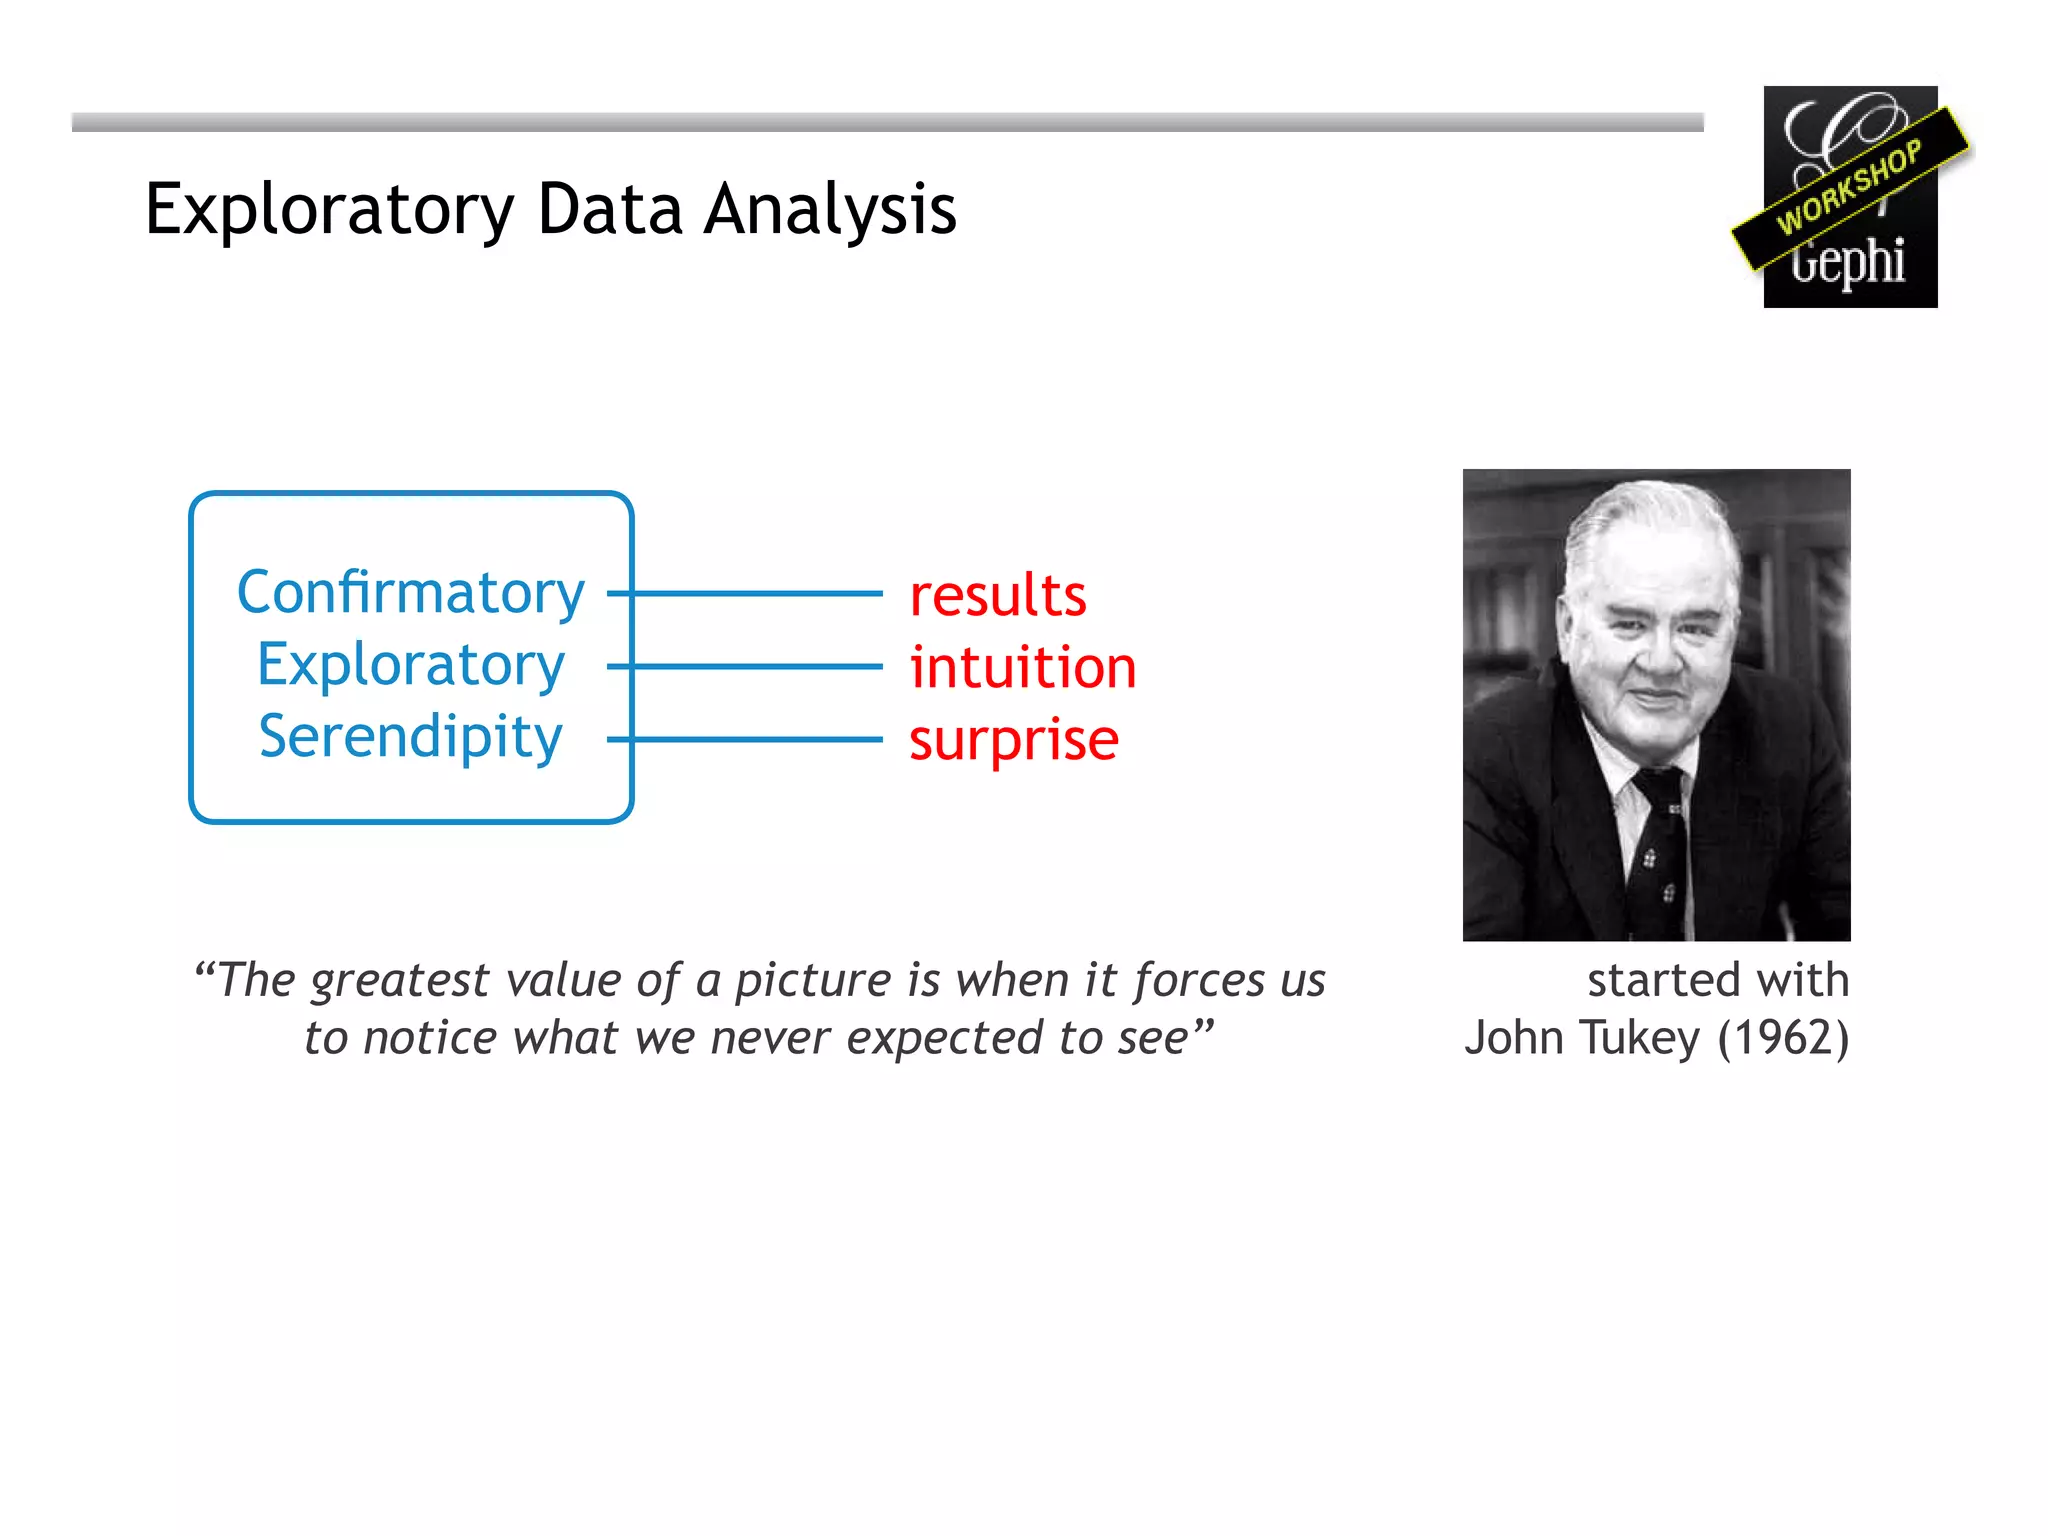
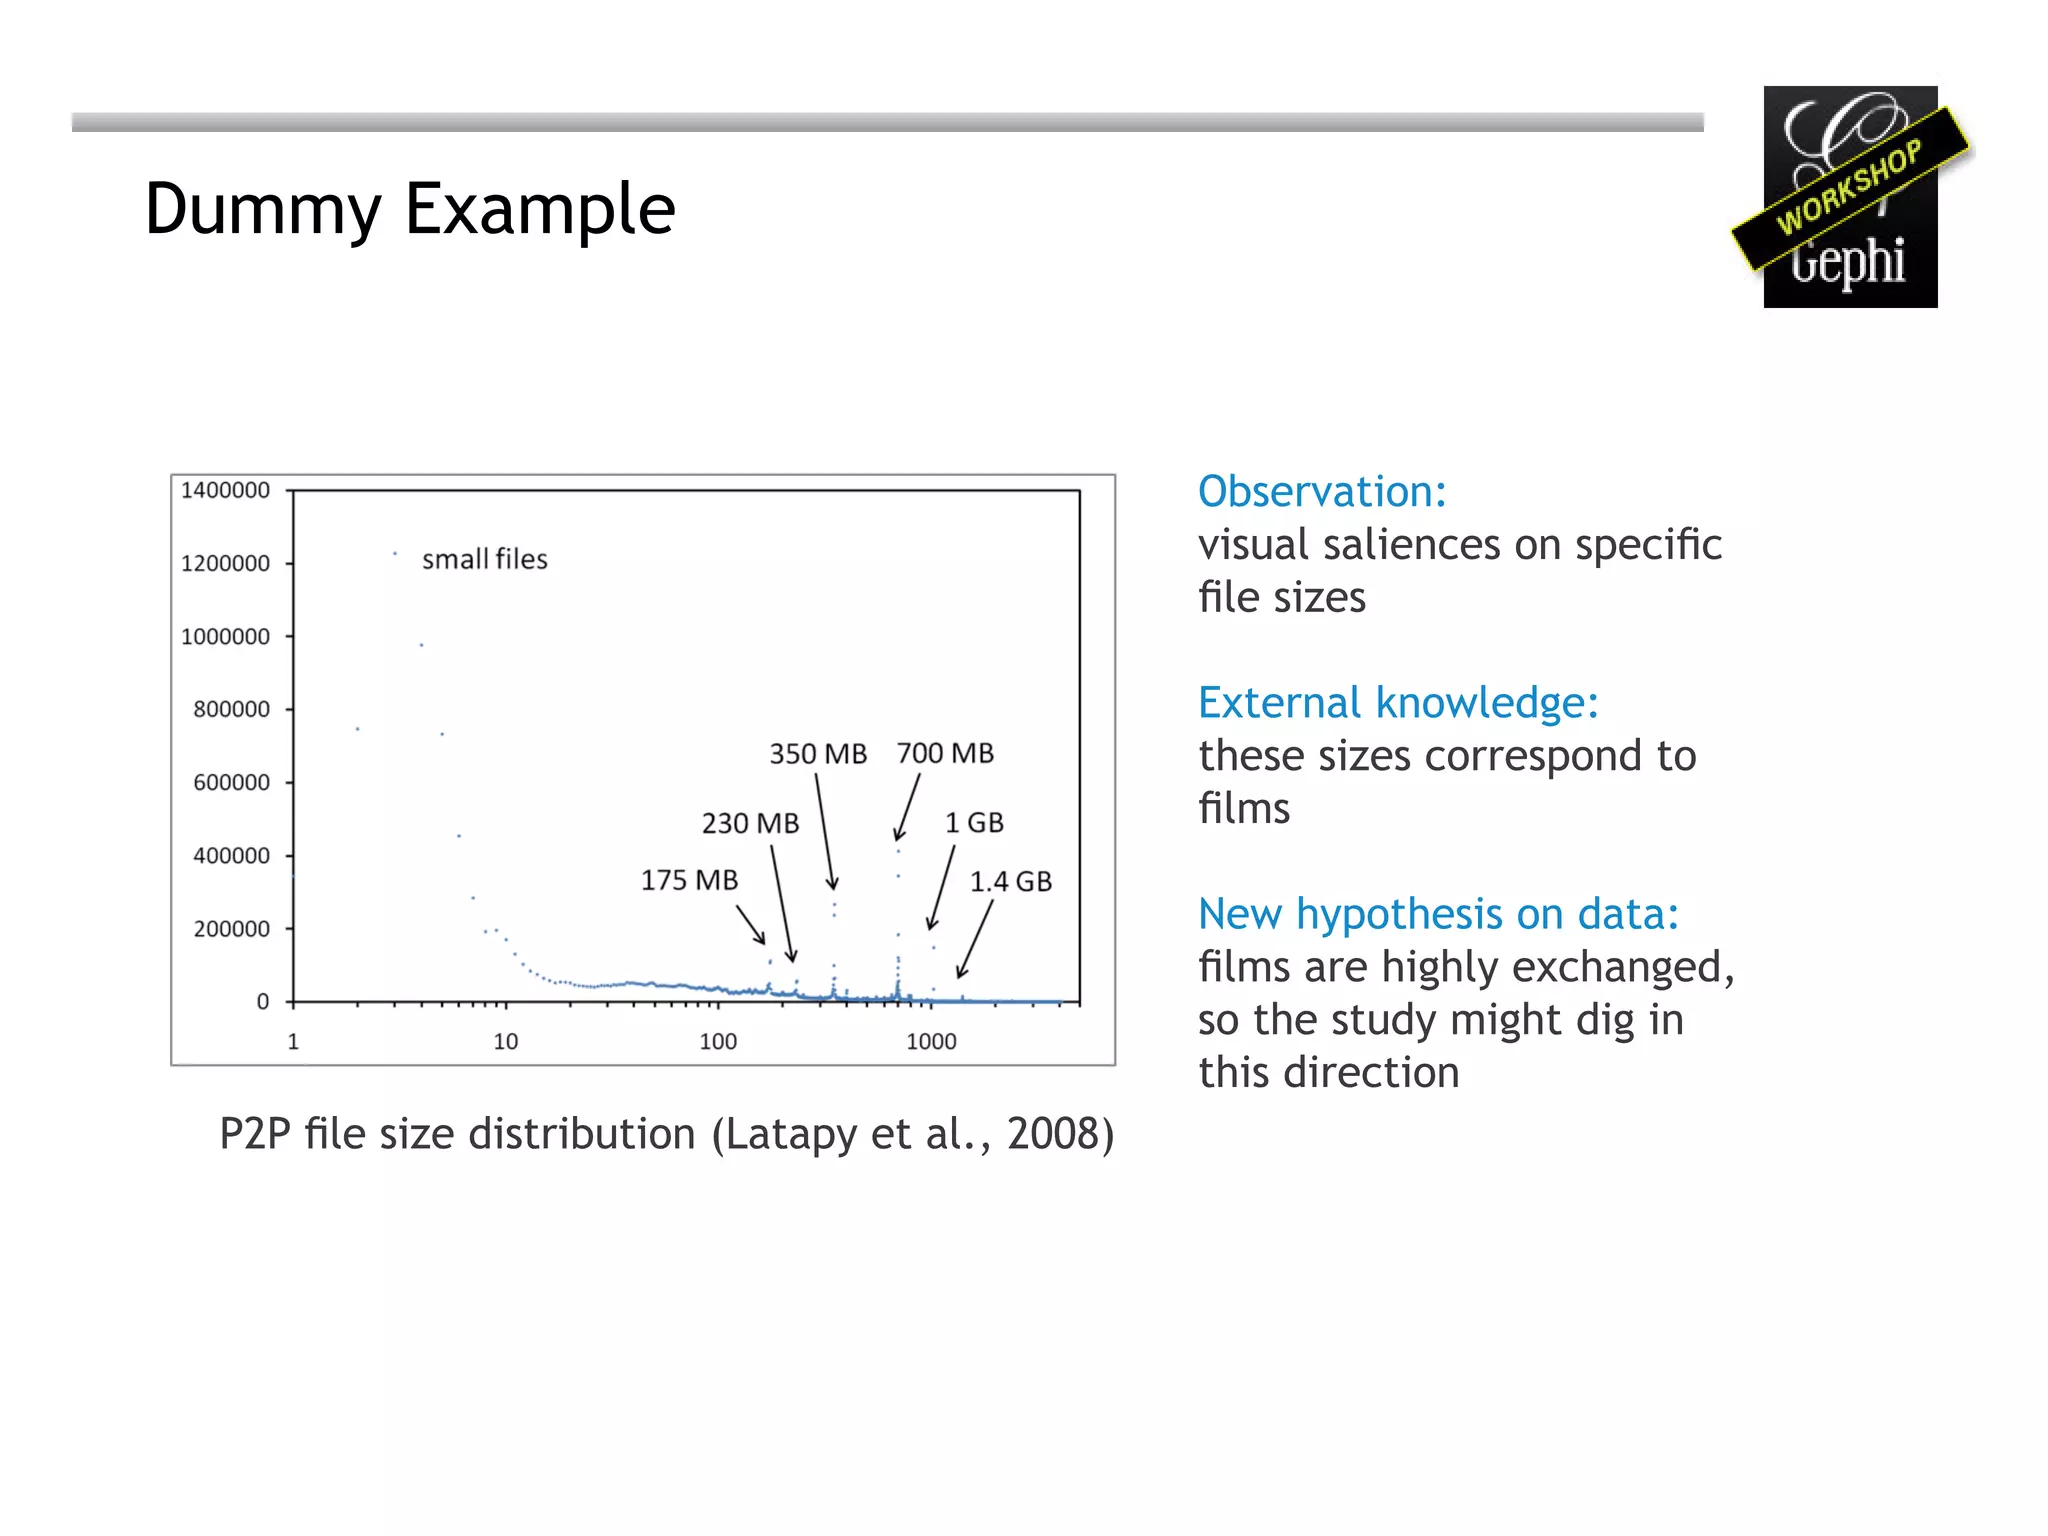
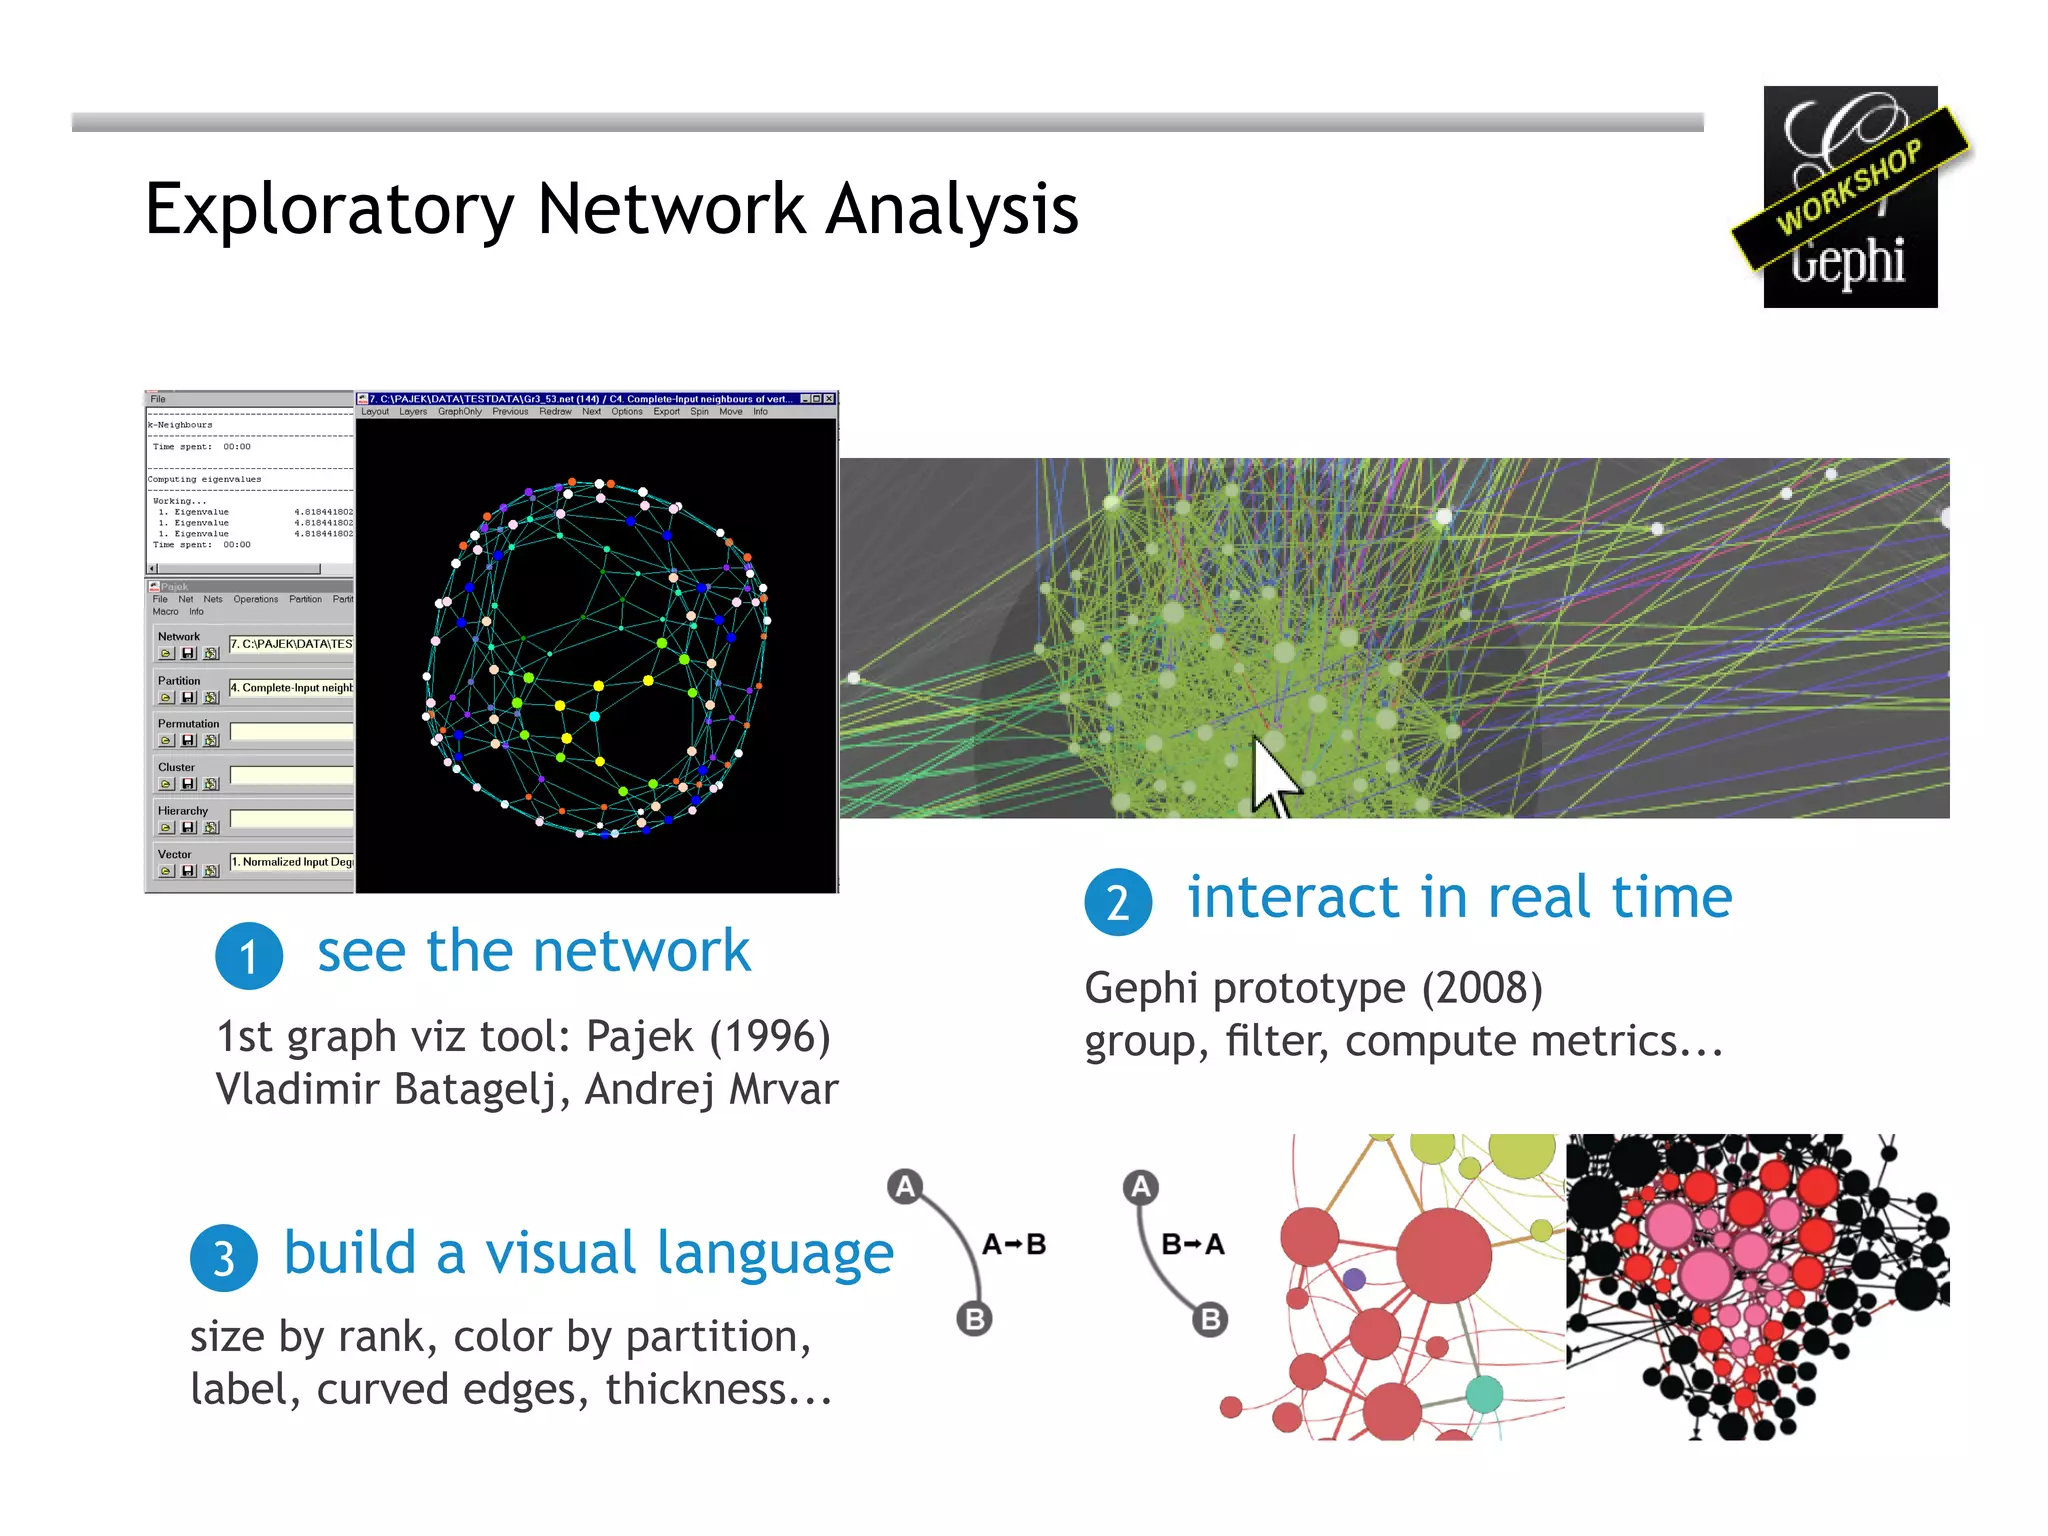
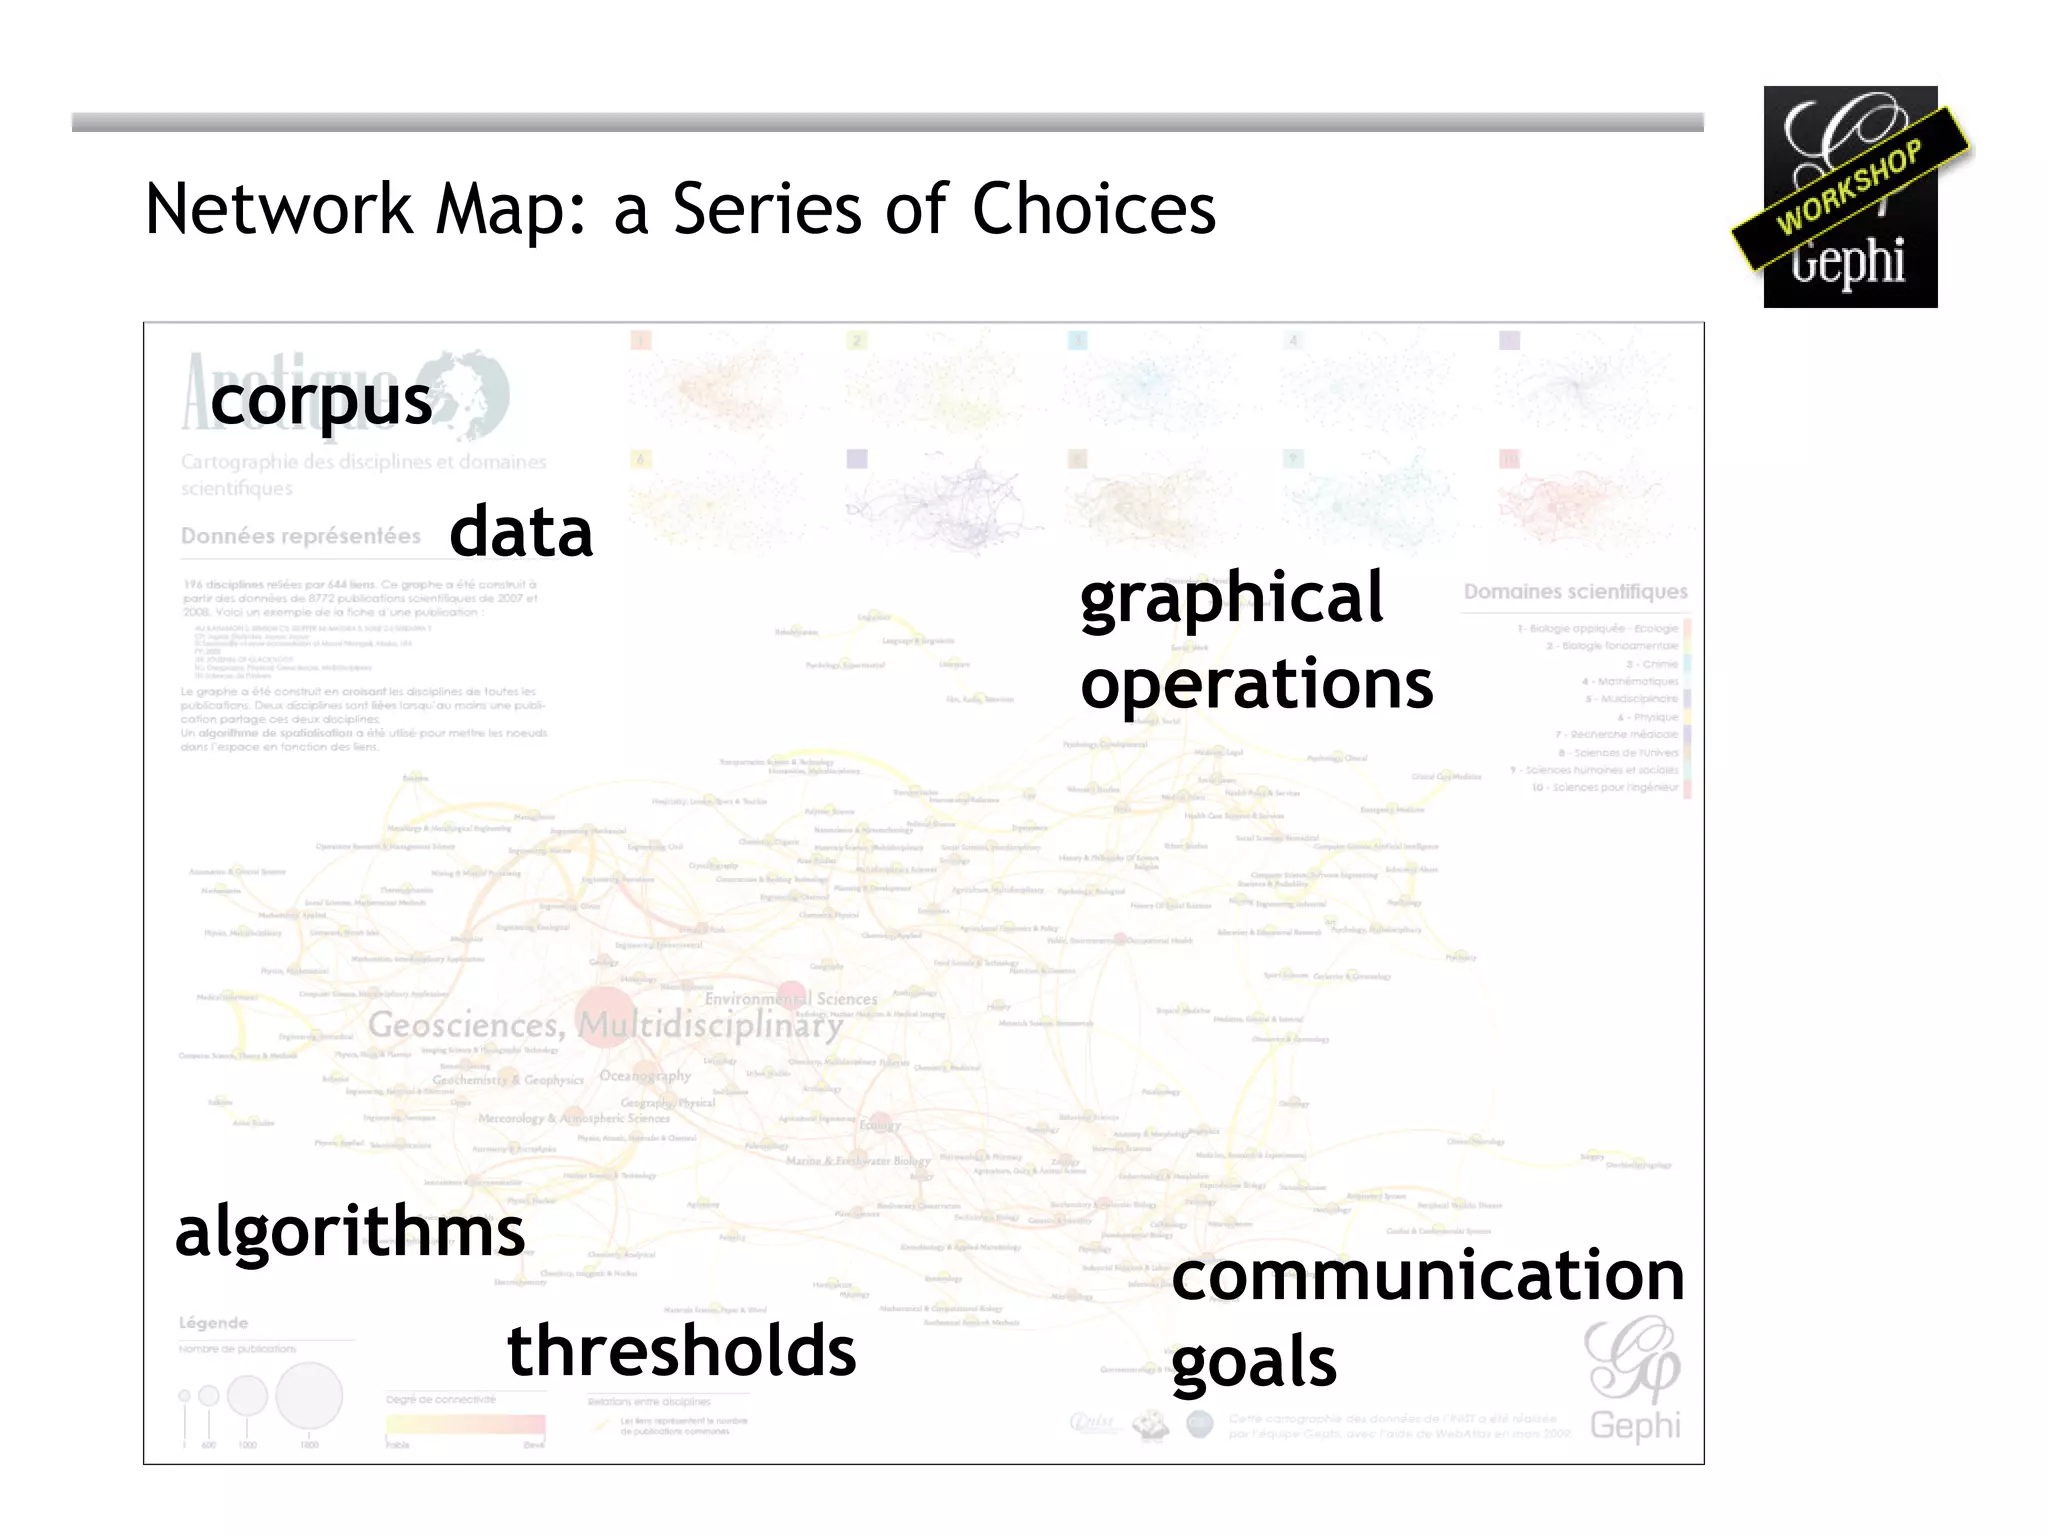
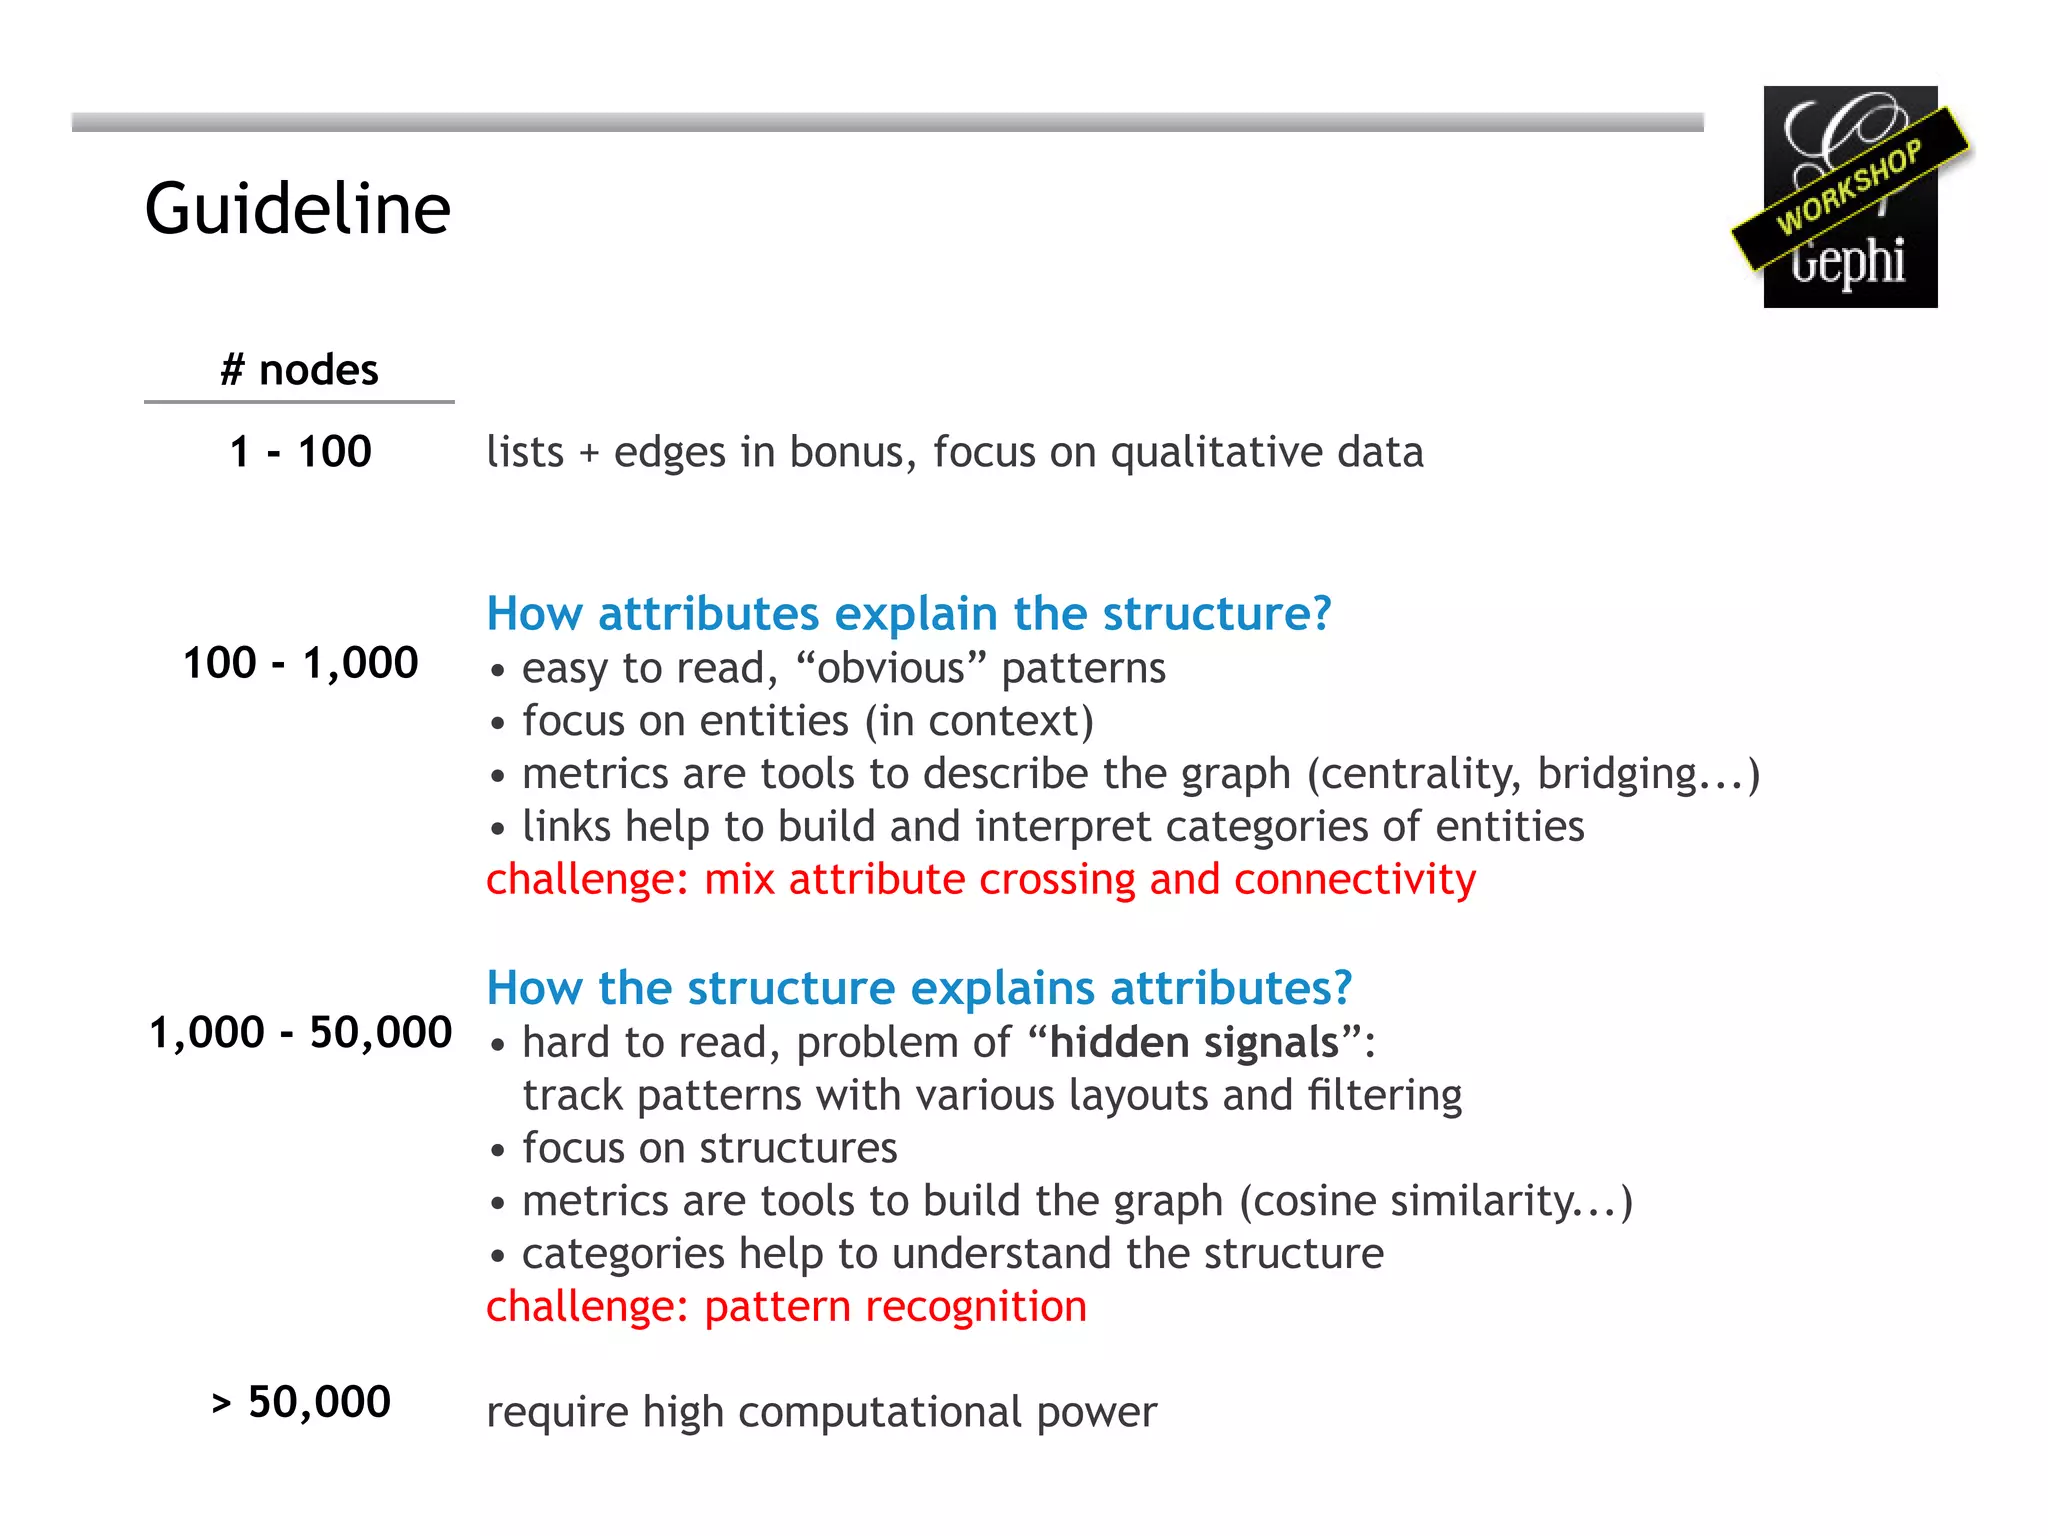
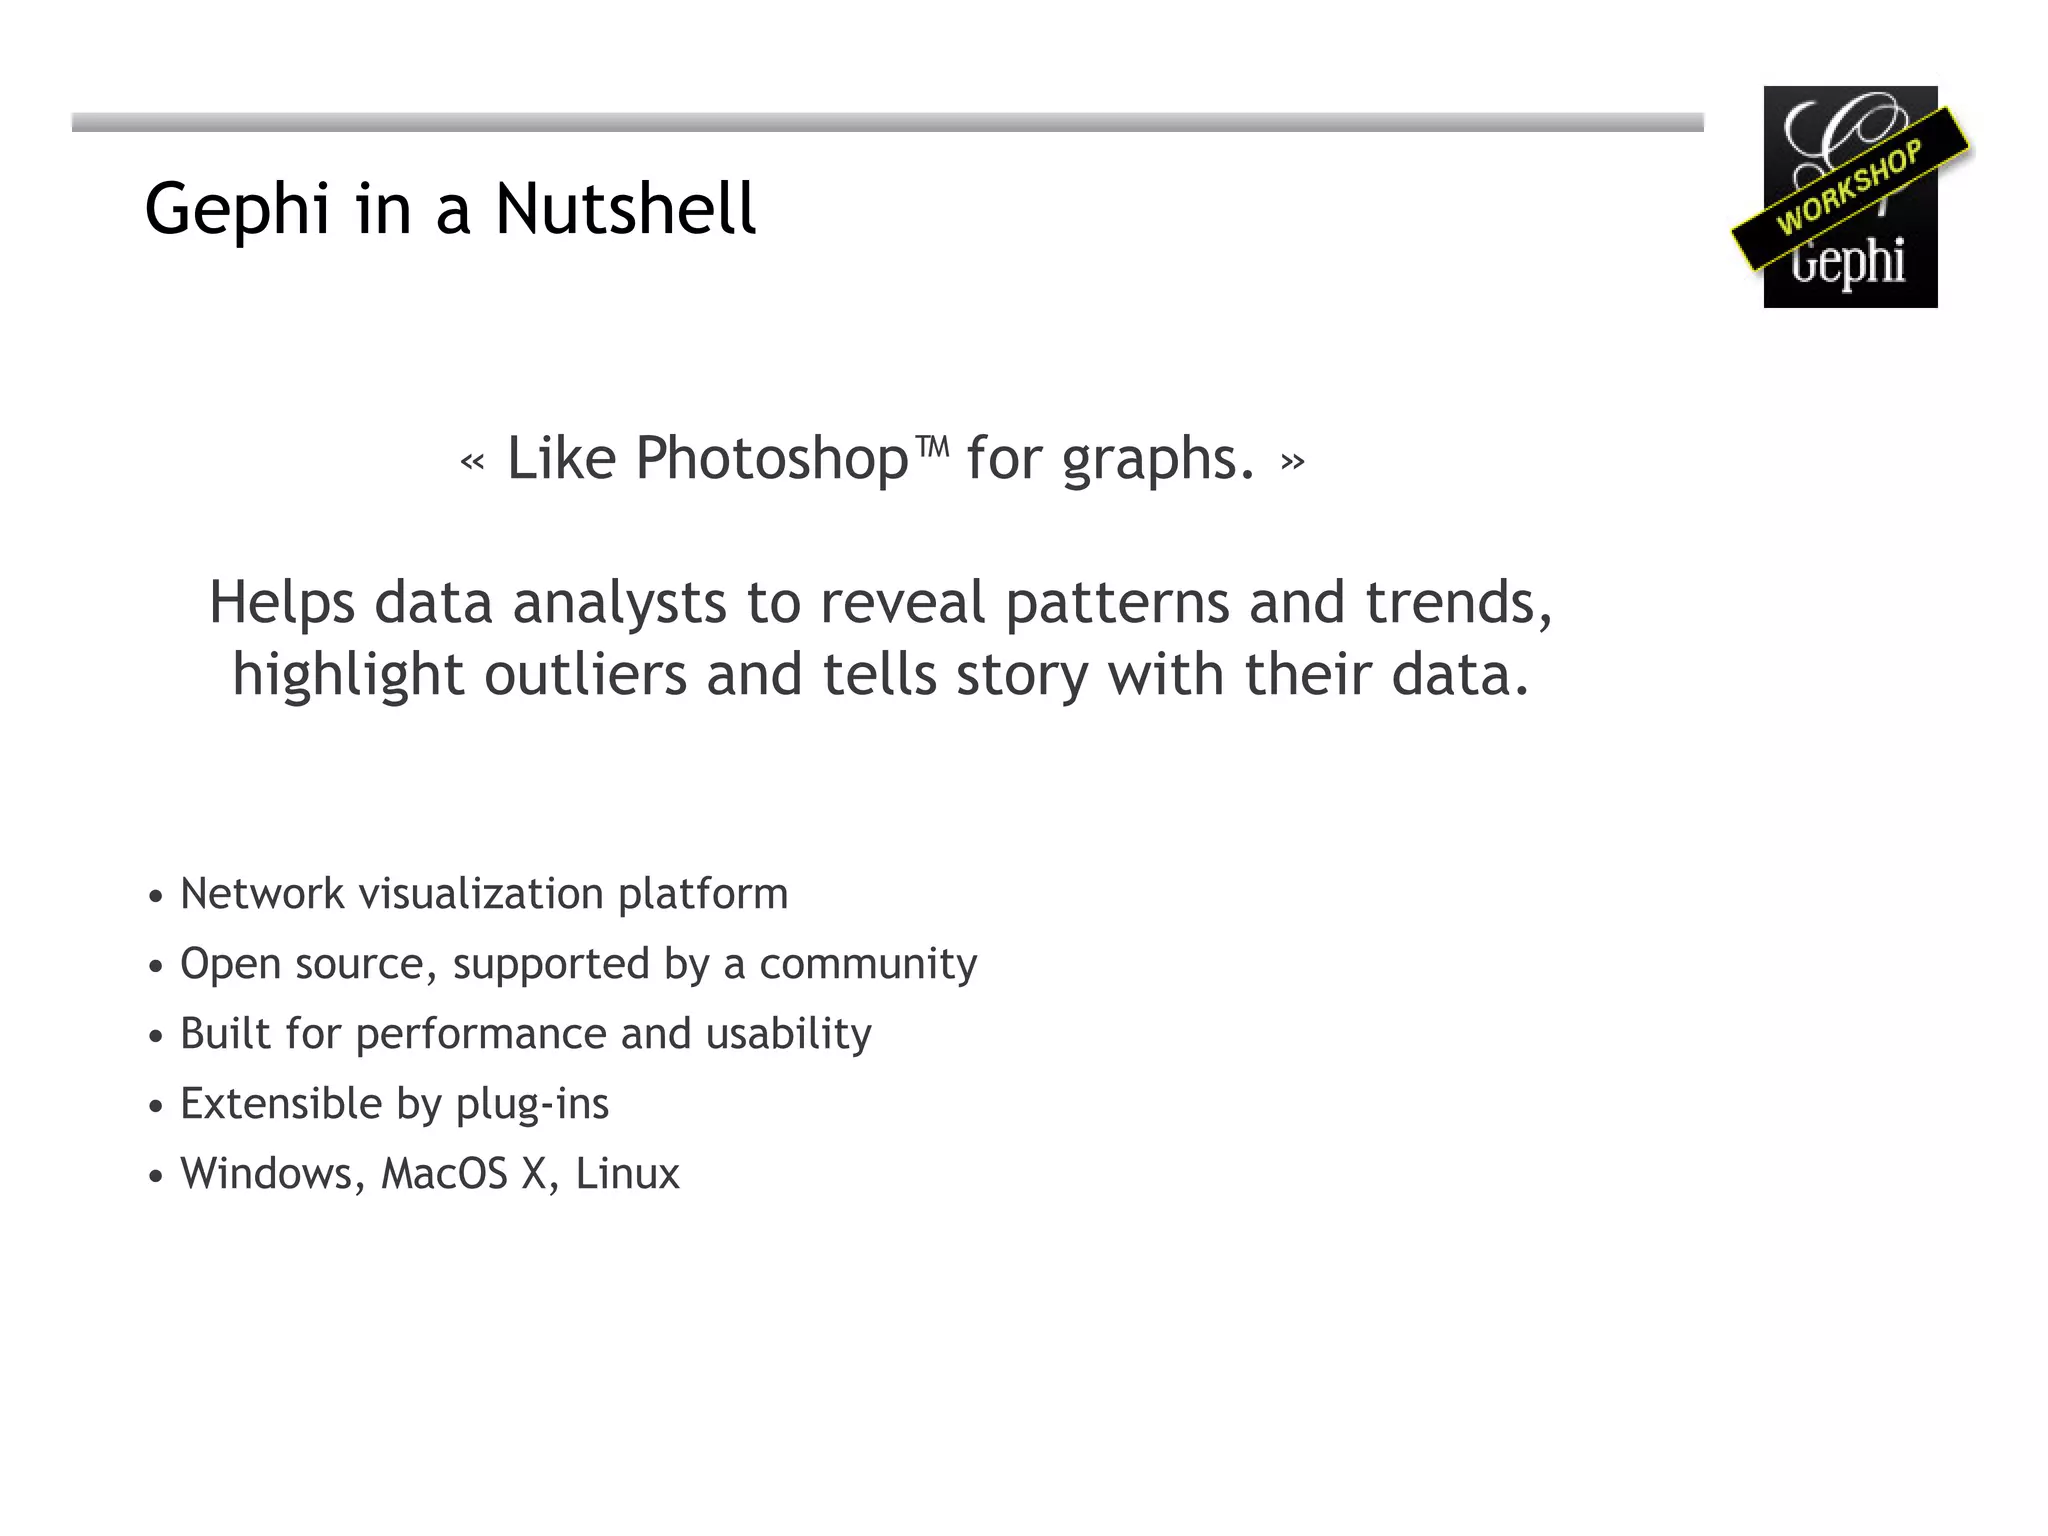
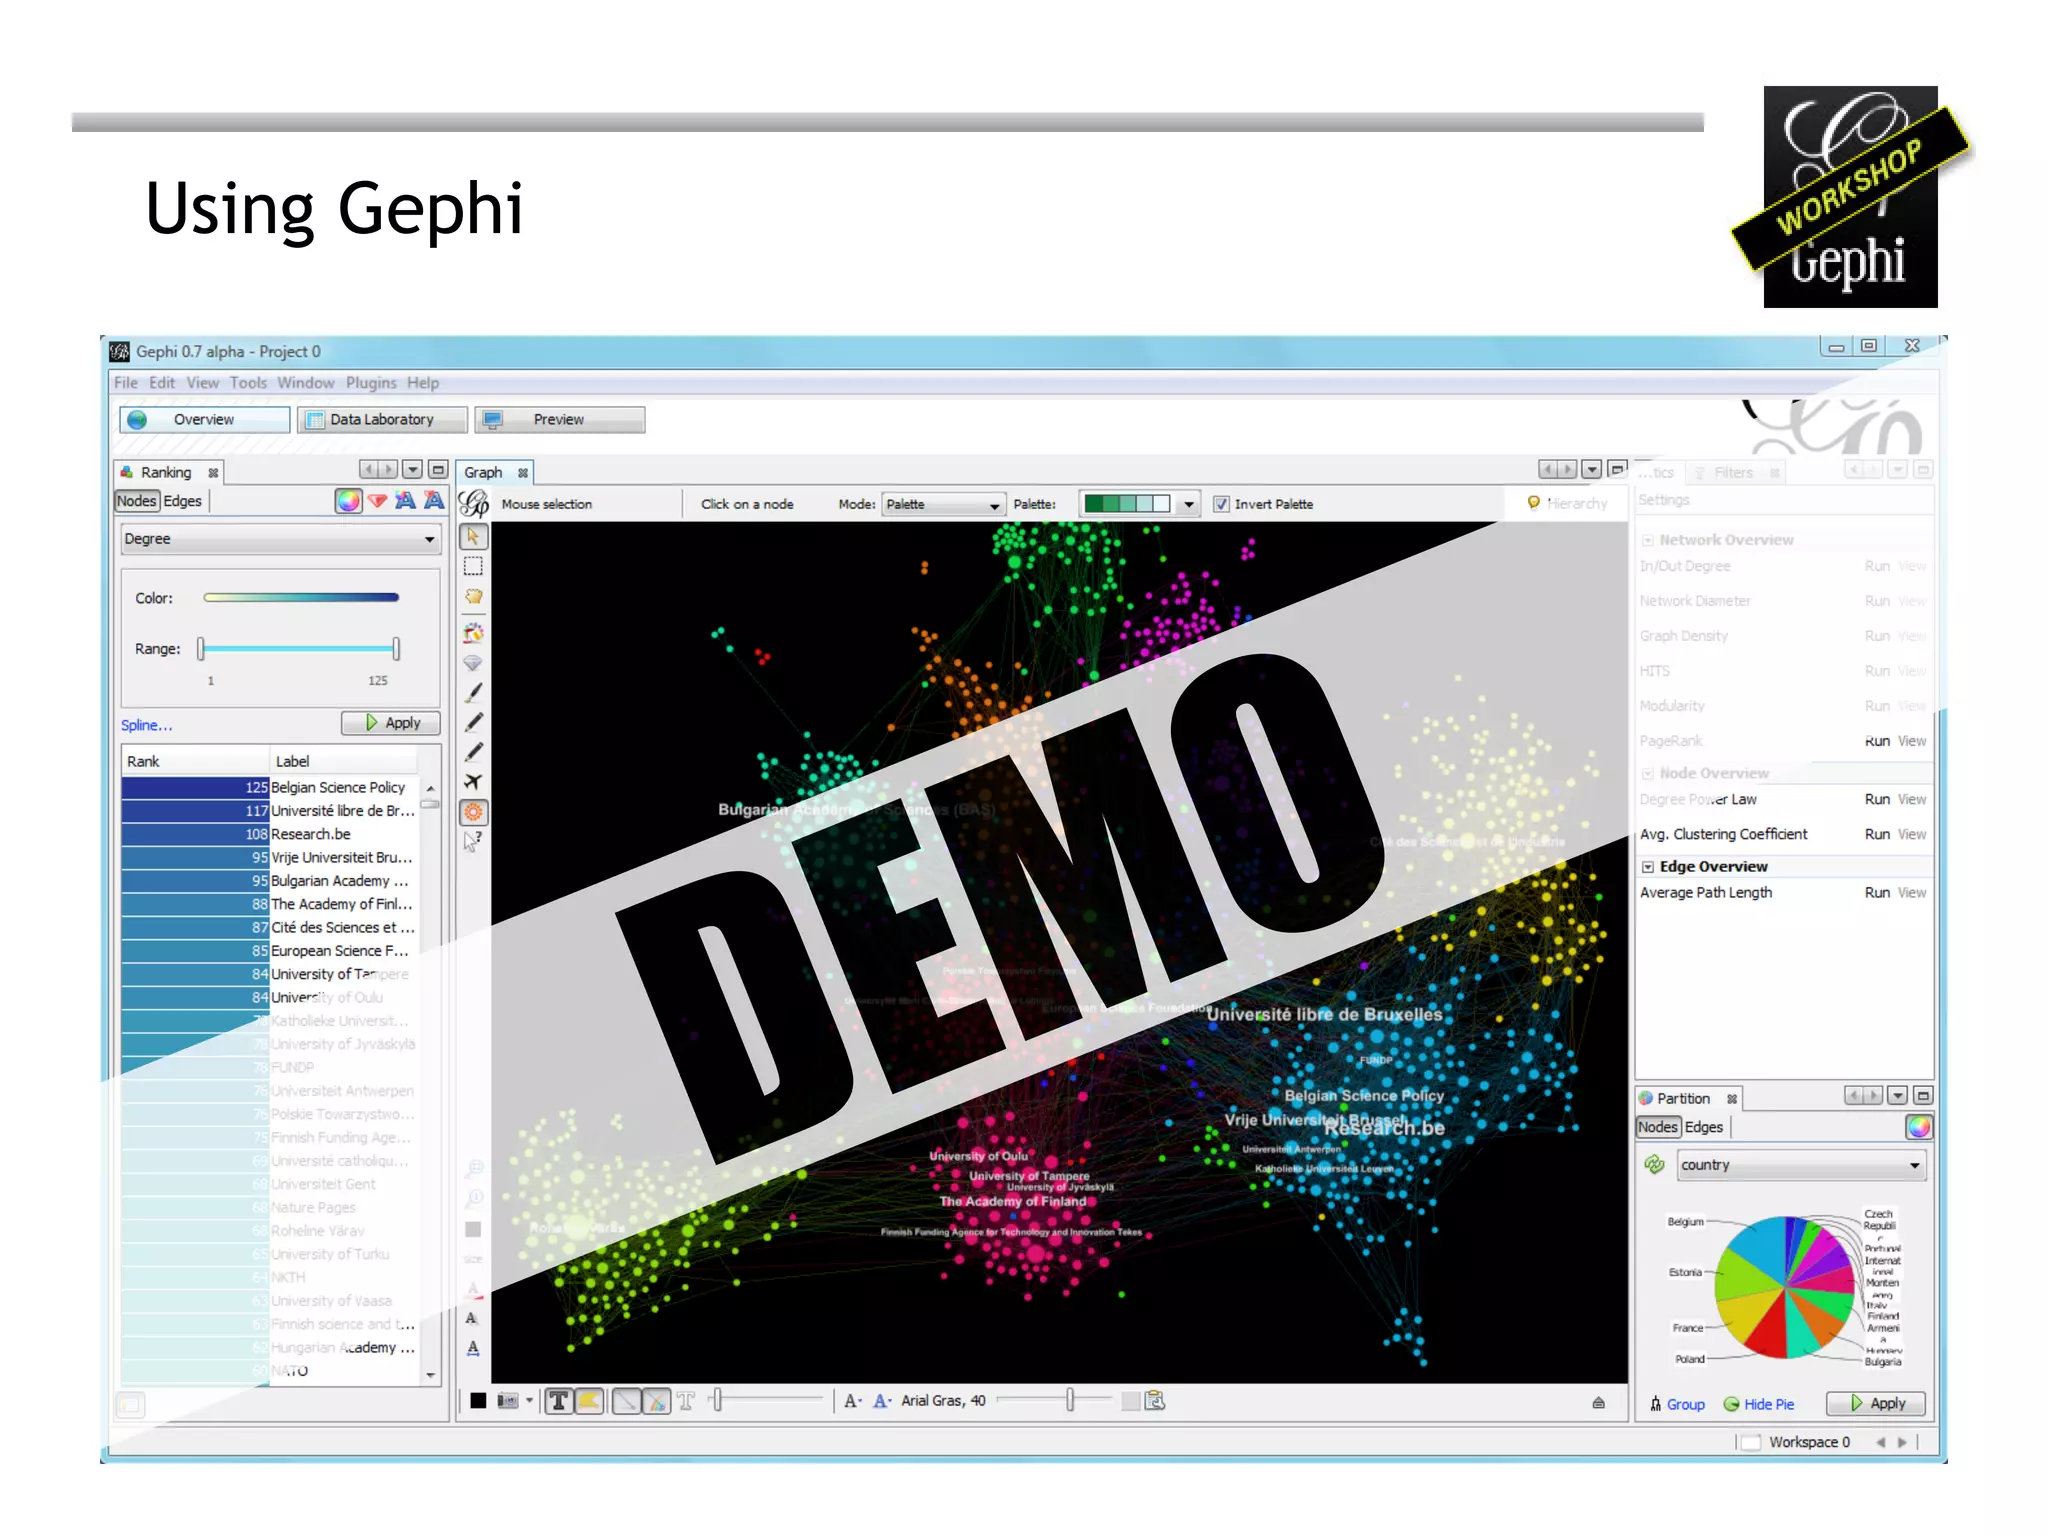
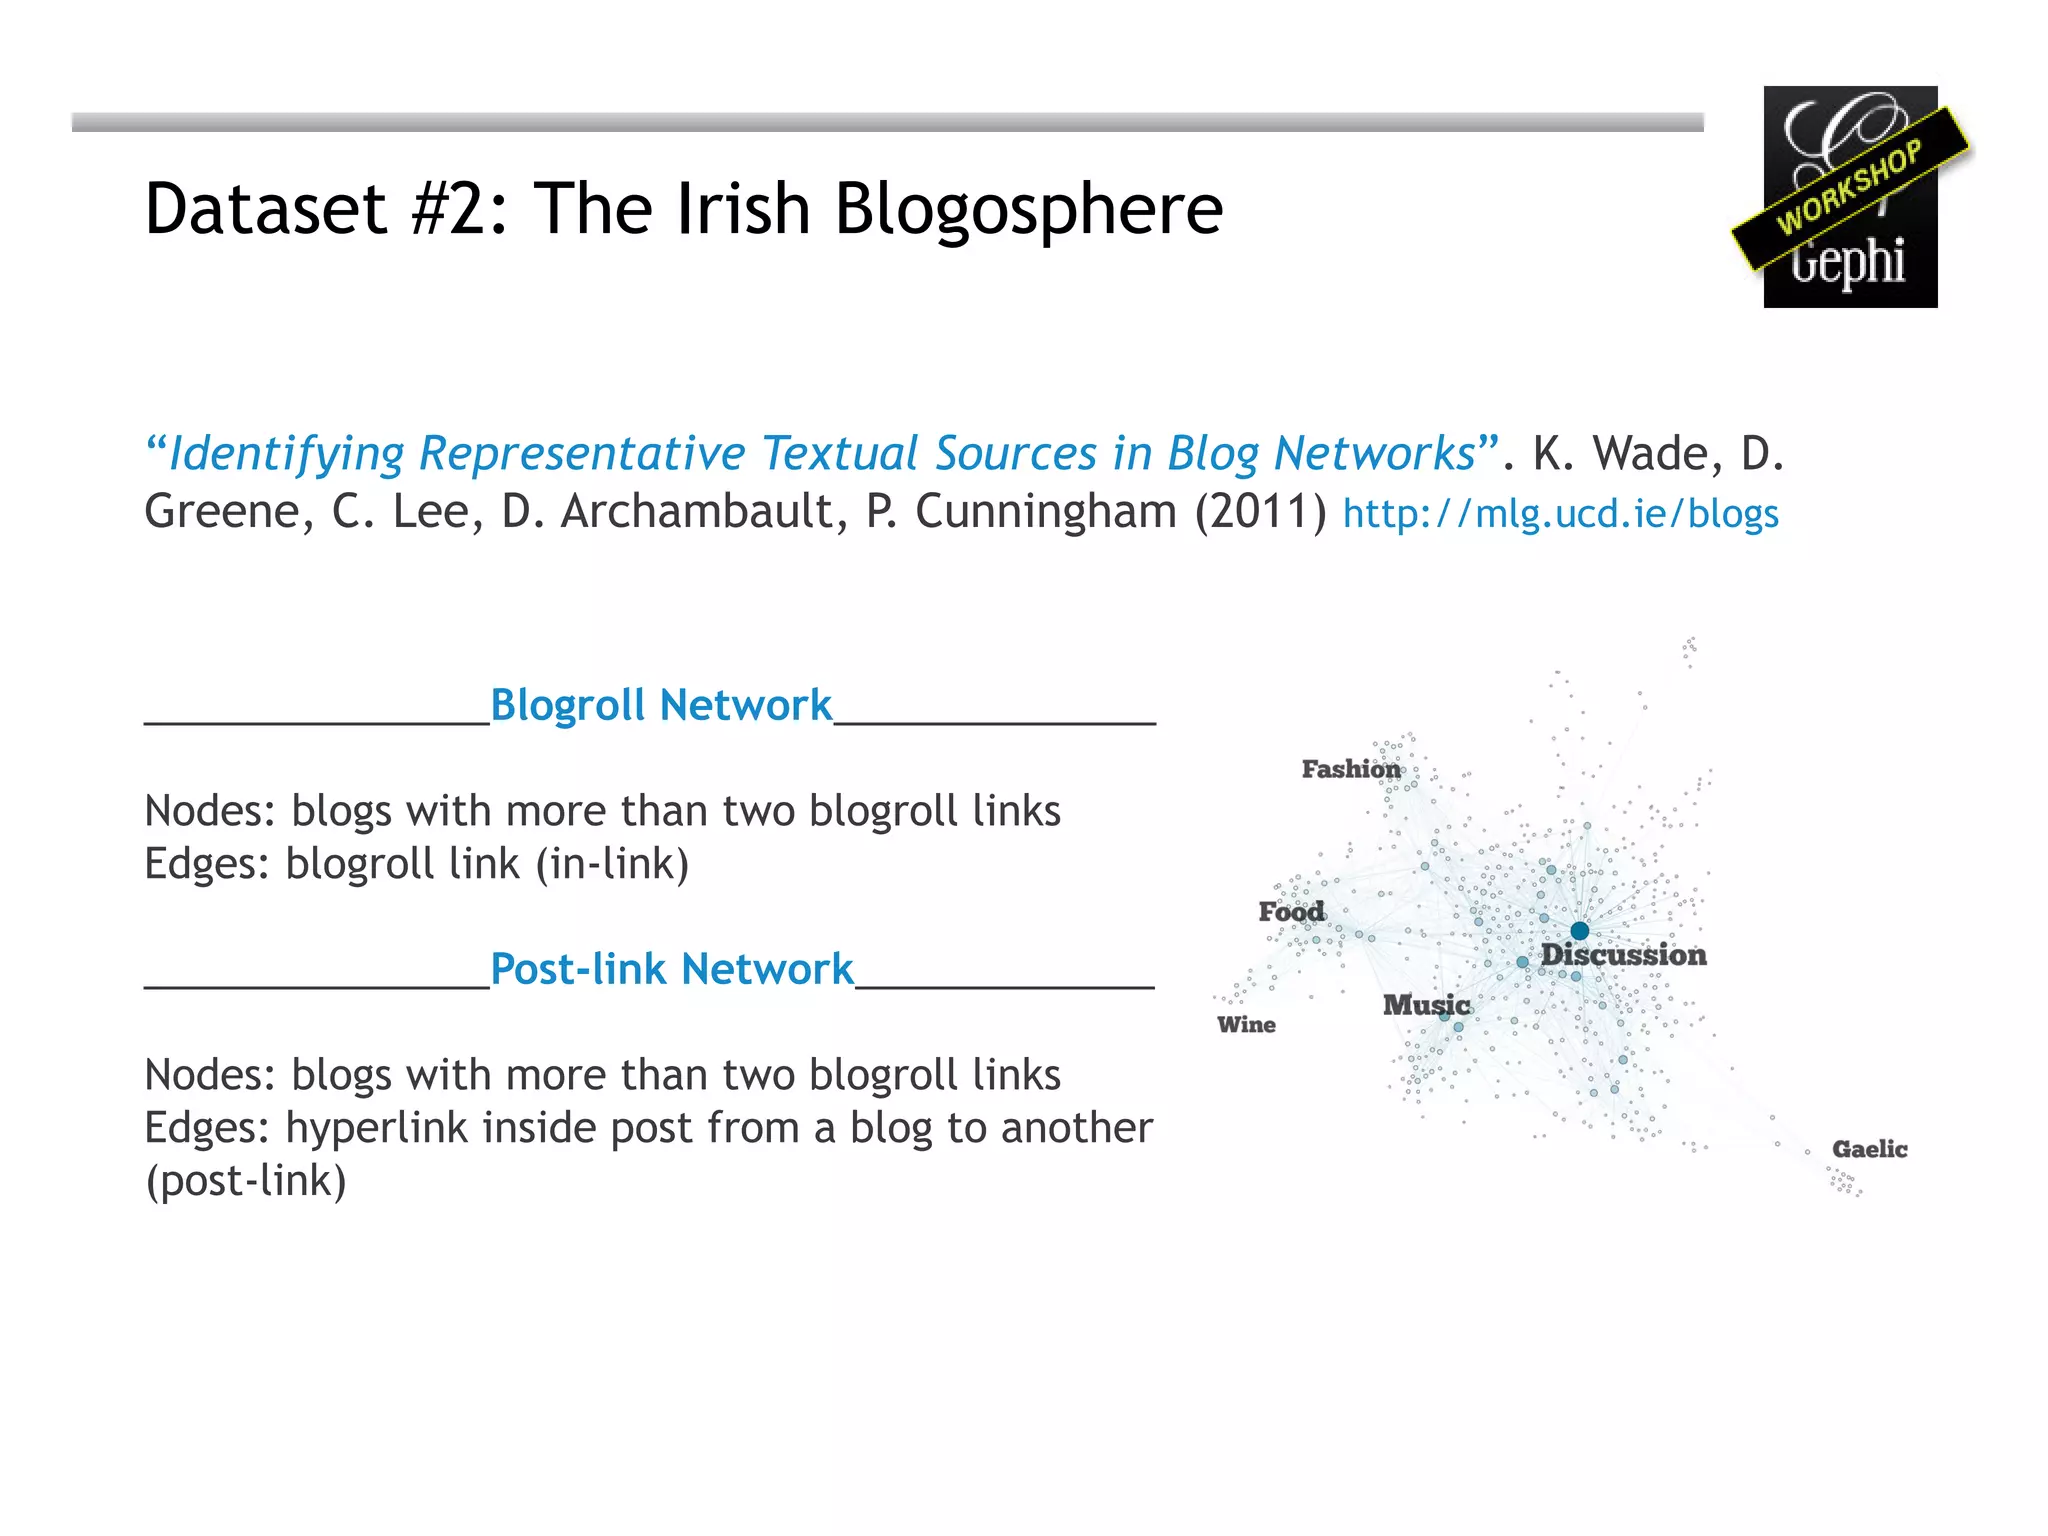
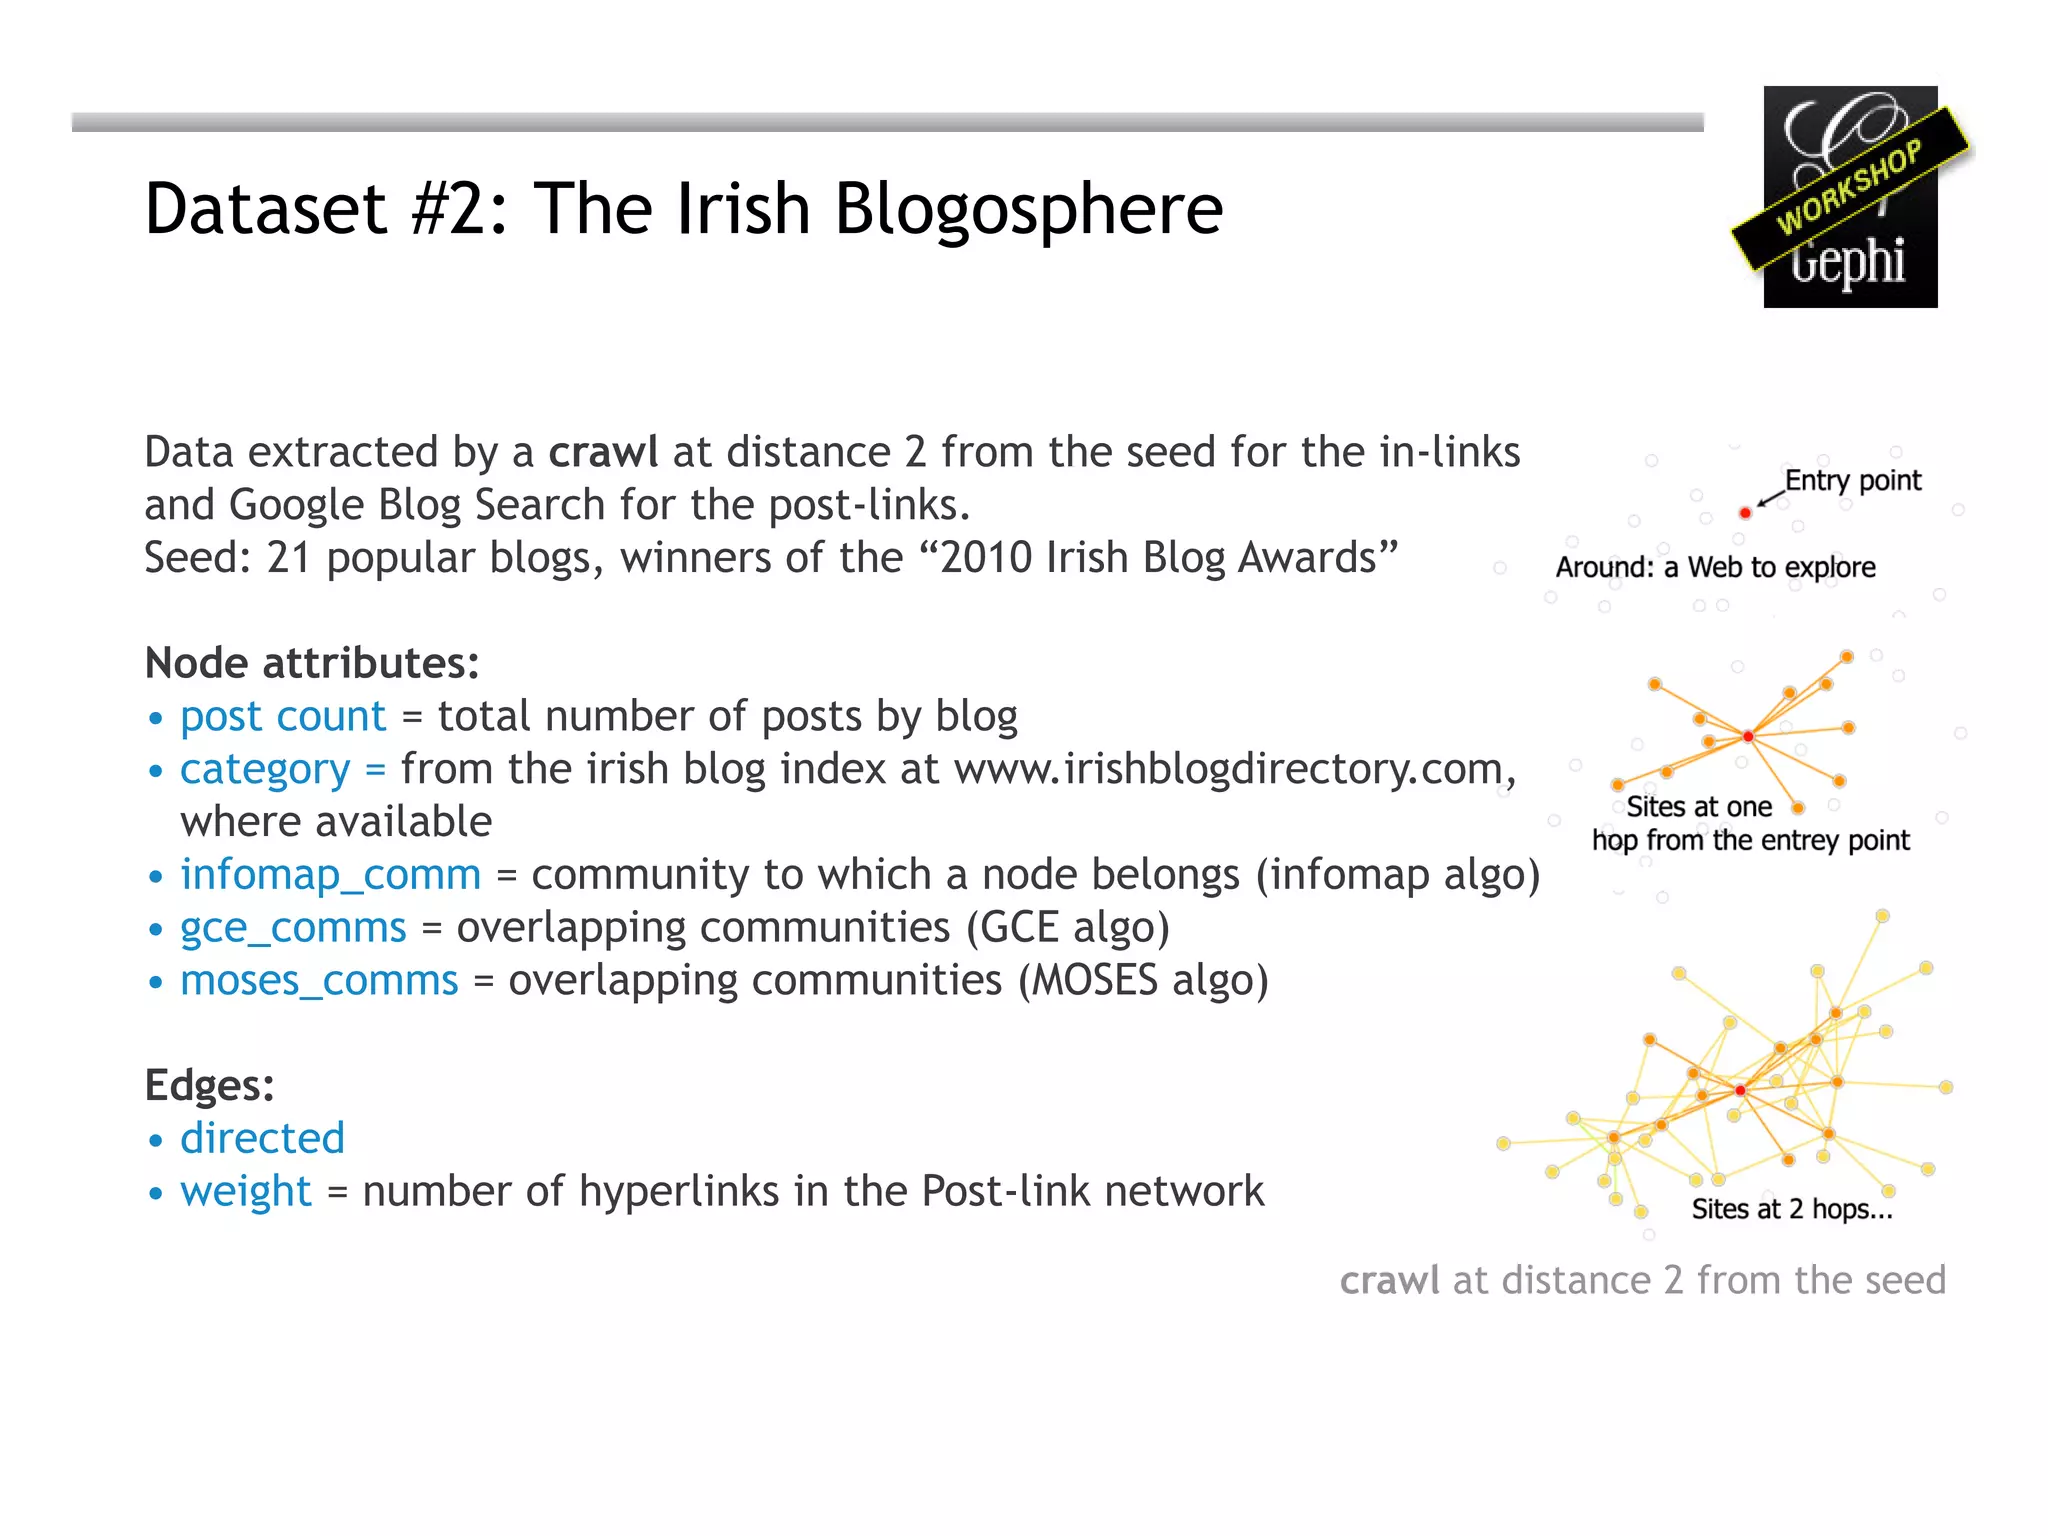
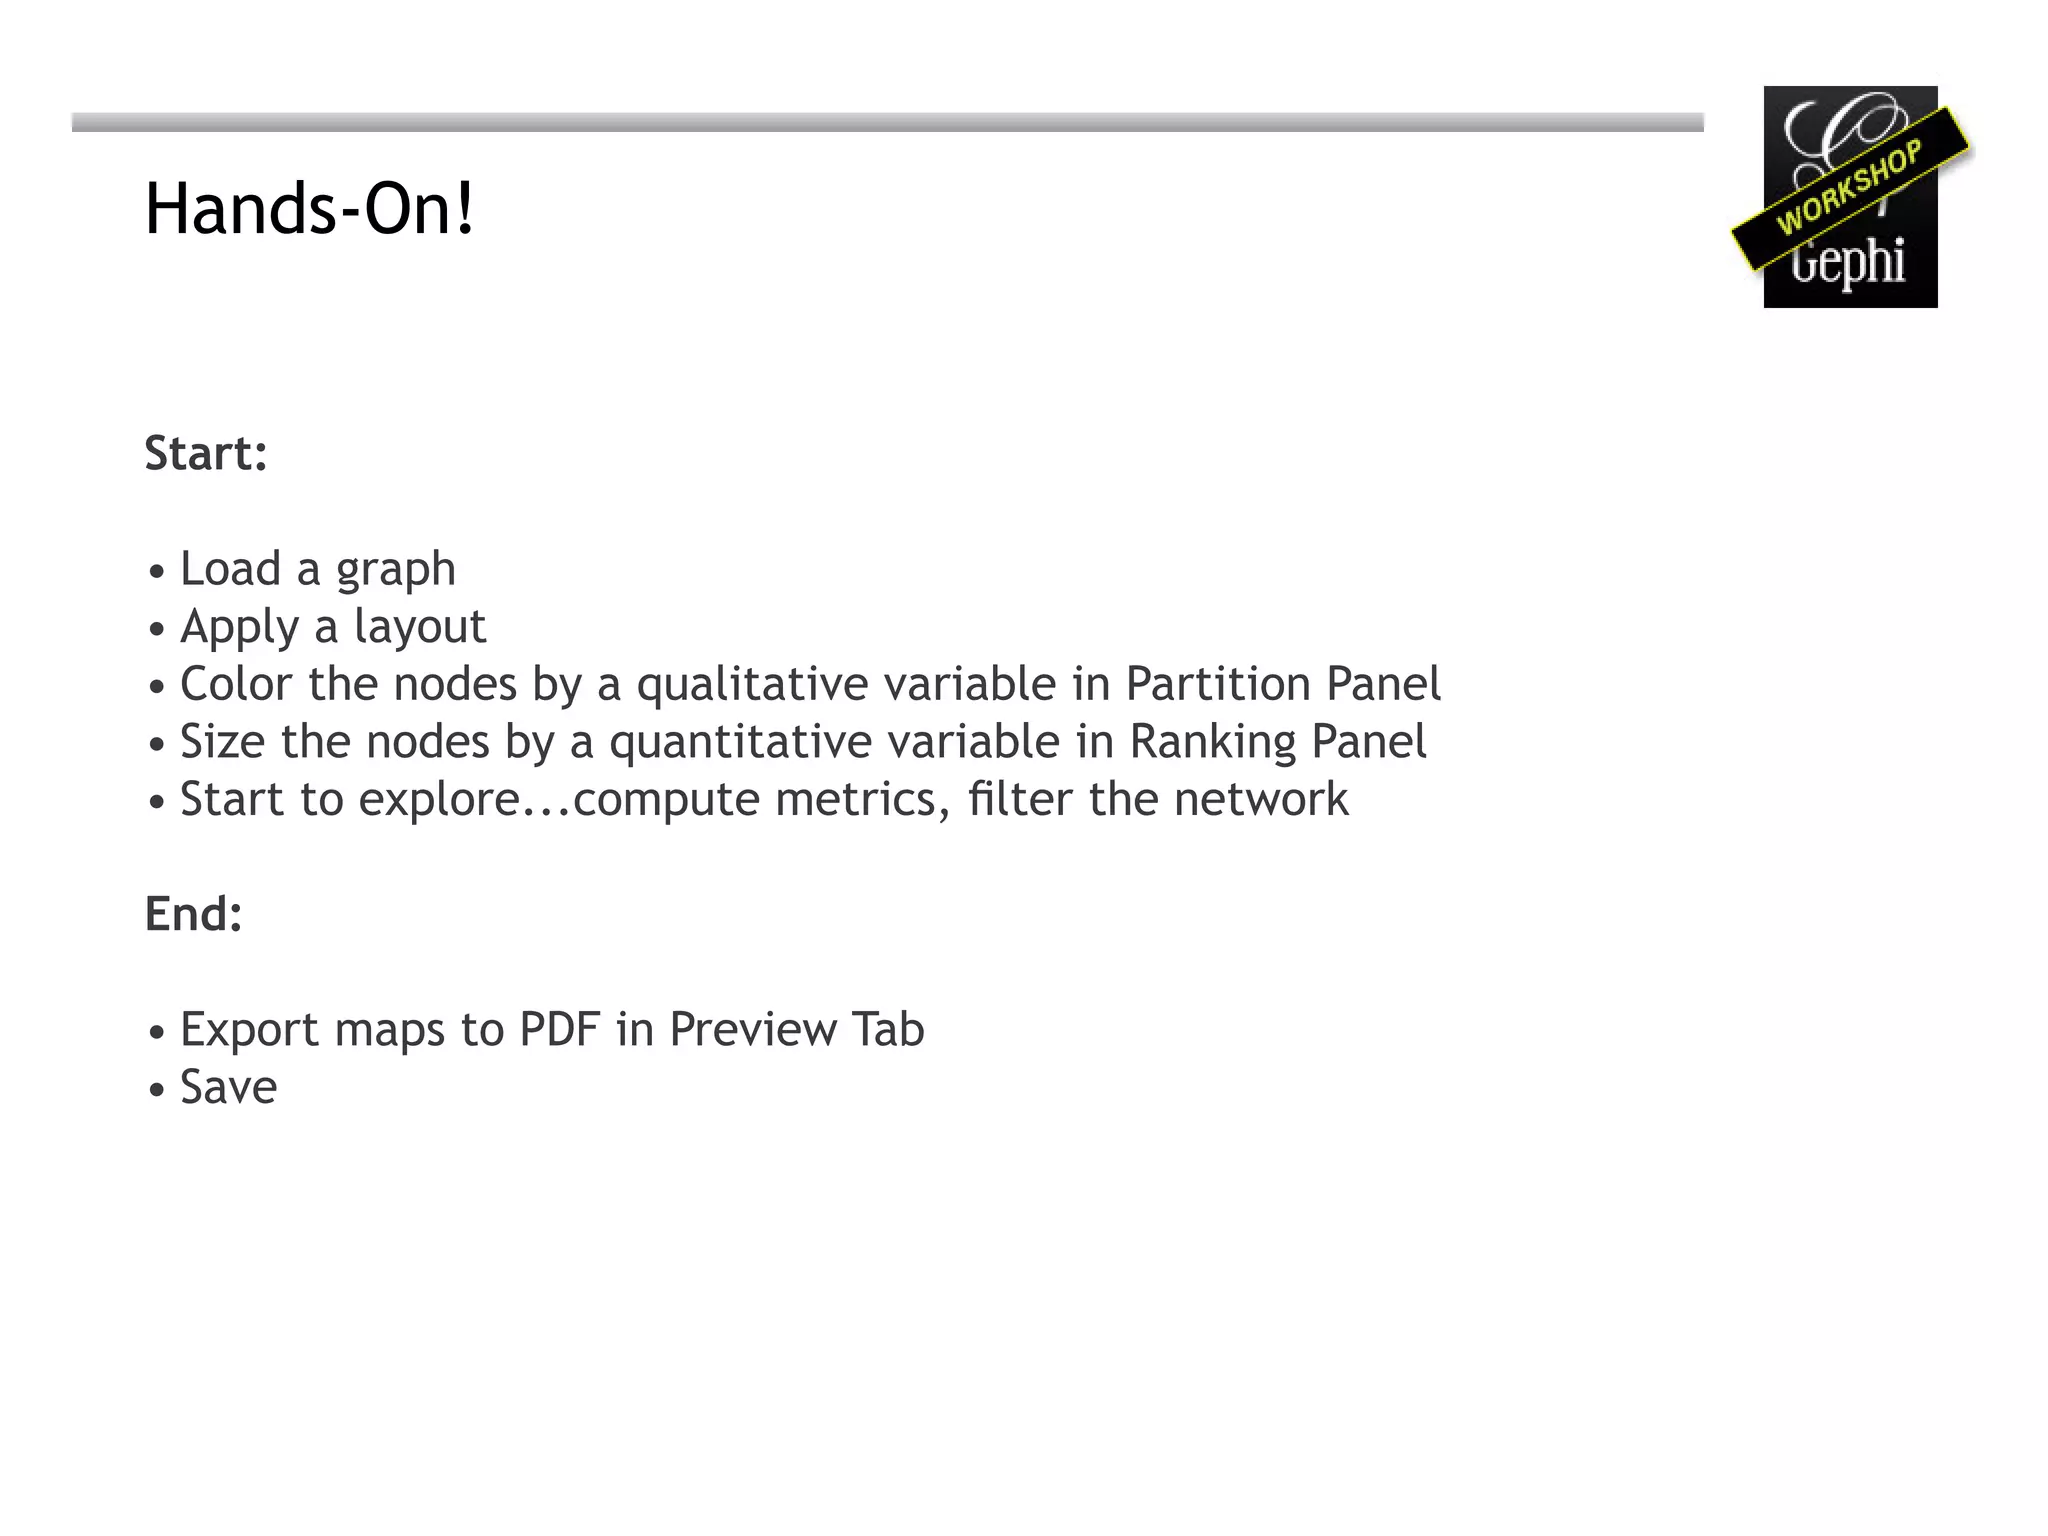
The document outlines a tutorial on exploratory network analysis using Gephi, an open-source software for graph visualization. Participants will learn to import data, manipulate structures, and discover patterns through hands-on activities with real datasets. The tutorial culminates in a presentation of findings and a Q&A session, emphasizing the software's role in aiding data analysts in their exploratory tasks.


![UiPath Automation Suite Installation (Hands-On) [2/3]](https://cdn.slidesharecdn.com/ss_thumbnails/automationsuitecommunitysession2-251015095633-a6d862f1-thumbnail.jpg?width=600ounds&width=560&fit=bounds)


