KEMBAR78
Study of R Programming | PDF
International Research Journal of Engineering and Technology (IRJET) e-ISSN: 2395 -0056
Volume: 04 Issue: 06 | June -2017 www.irjet.net p-ISSN: 2395-0072
© 2017, IRJET | Impact Factor value: 5.181 | ISO 9001:2008 Certified Journal | Page 2901
STUDY OF R PROGRAMMING
Tejas Rajeshirke1, Ceena Joseph Thundiyal2, Nishi Tiku3
1 Student, Dept. of Master of Computer Application, Vivekanand Education Society's Institute of Technology,
Maharashtra, India
3 Professor, Dept. of Master of Computer Application, Vivekanand Education Society's Institute of Technology,
Maharashtra, India
---------------------------------------------------------------------***---------------------------------------------------------------------
Abstract - R is an open-source environment and easy to
learn. R is very popular concepts which is used by many
companies to visualize & analyze their data. Data analysis is
the process of analyzing the part of statistics data for
learning purposes.Libraries or Packages are playing
important role in R programming language. It consists of
various statistical modelling algorithmandmachinelearning
concepts which enable users to make reproducible research
and create informative products.
Key Words: Data Analytics, Dataset, R , R Studio, R
Libraries.
1. INTRODUCTION
R tool is an implementation of S tool at Bell Labs. S was
created by John Chambers. R tool was created by Ross Ihaka
and Robert Gentleman at the University of Auckland, New
Zealand. It is currently developed bytheR developmentcore
team, in which John Chambers is also a part of it.
R is named after the first two authors. The project was
conceived in the year 1992, where the initial version was
released in the year 1995 and the beta version in the year
2000.
In this paper there are total six sections. The different
sections are as follows : section 1 represents About R, its
Advantages and Disadvantages , section 2 represents R
Environment , section 3 represents Applications of R,
section 4 represents R Libraries, section 5 represents
Comparision R and Python, section 6 represents Conclusion
and section 7 represents References used.
2. ABOUT R
R is free open source which uses integrated development
environment (IDE) as R Studio.
It is easy to learn and most powerful data analytics
programming language.
It creates the most beautiful and unique data visualizations
so that more than 70% of companies in US uses this
software.
It compiles the code and runs on a variety of UNIX platforms
and similar systems like Windows and MacOS.
Console: It is work area where actual scripts get
implemented.
2.1 Advantages:
R tool is available for anyone to use as it is a fee software.
It does not have any license restrictions, hence can be run
anywhere.
It can import tools from many other softerwares.
It produces graphics in pdf,jpg, png and svg fomats.
R has 4800 packages which are available from multiplae
repositories.
There is an active user groups where any query that is been
put up is responded within a short span of time.
2.2 Disadvantages:
R give a very less thought on memory management. Almost
utilises all the disk space.
R tool is best suitd for people with data oriented problems
and not for programmers.
R cannot be used as a back-end server for calculations.
It is less secure
3. R ENVIRONMENT
R environment is suitable for computing statistics &
computer graphics. It is integration pack of software facility
which includes Manipulation of data, calculation of data &
data in graphical format.
R environments is area where we can store objects,
variables, functions.
International Research Journal of Engineering and Technology (IRJET) e-ISSN: 2395 -0056
Volume: 04 Issue: 06 | June -2017 www.irjet.net p-ISSN: 2395-0072
© 2017, IRJET | Impact Factor value: 5.181 | ISO 9001:2008 Certified Journal | Page 2902
Environment basics :
It involves basic properties of an environment where wecan
create our own environment.
Binding names to values:
It describes the rules that names should follow as well as
shows some variations on binding a name to a value.
Explicit environment :
Environments have referencesemanticsbecauseofthis they
are also useful data structures in their own right..
4.R LIBRARIES
R LIBRARIES
4.1 Pre Modeling Stage:
ggplot2: this library is used to create elegant DataVisualizations
Using the Grammar of Graphics. Based on the concept of ``The
Grammar of Graphics'' according to our data 'ggplot2' map
variables to aesthetics and it takes care of the details.
Plyr: this library is used in Data transformation where
several operations are performed like data Splitting,
Applying & combining of data.
RRF: RRF stands for “Regularized Random Forest”. This
library is based on Random Forest package whichisusedfor
Feature selection.
4.2 Modeling Stage:
car: This package is used in Continues Regression which is
Companion to Applied Regression.
Forecast: Forecasting FunctionsareusedforTimeSeriesand
Linear Models.
Carat: This package is generally used for classification and
Regression training.
4.3 Post Modeling Stage:
Comparison: This library is used to calculate and evaluate
ratios from multivariate continuous observations.
ACD: This library is used for Categorical data analysis with
complete or missing responses.
PROC: PROC is used to visualize and analyze ROC curvesinR
and S+. It is used to compare receiver operating
characteristic (ROC curves).
4.4 Other Libraries:
RCPP: It helps to improve performance. It providesseamless
integration in between R and C++ by offering R functions as
well as C++ classes.
5. COMPARISON OF R & PYTHON
Today there are many choices for a data analysts to choose
language for data analysis as apart from R programming
language there are many other languages like Python, SAS
(Statistical Analysis System ), MATLAB (matrix laboratory),
SPSS (Statistical Package for the Social Sciences), SQL
(Structured Query Language), Java, Scala, Excel, Julia etc. As
per popularity among these languages R and Python are
most popular for data analysis. So in this paper let us check
out differences between R & Python.
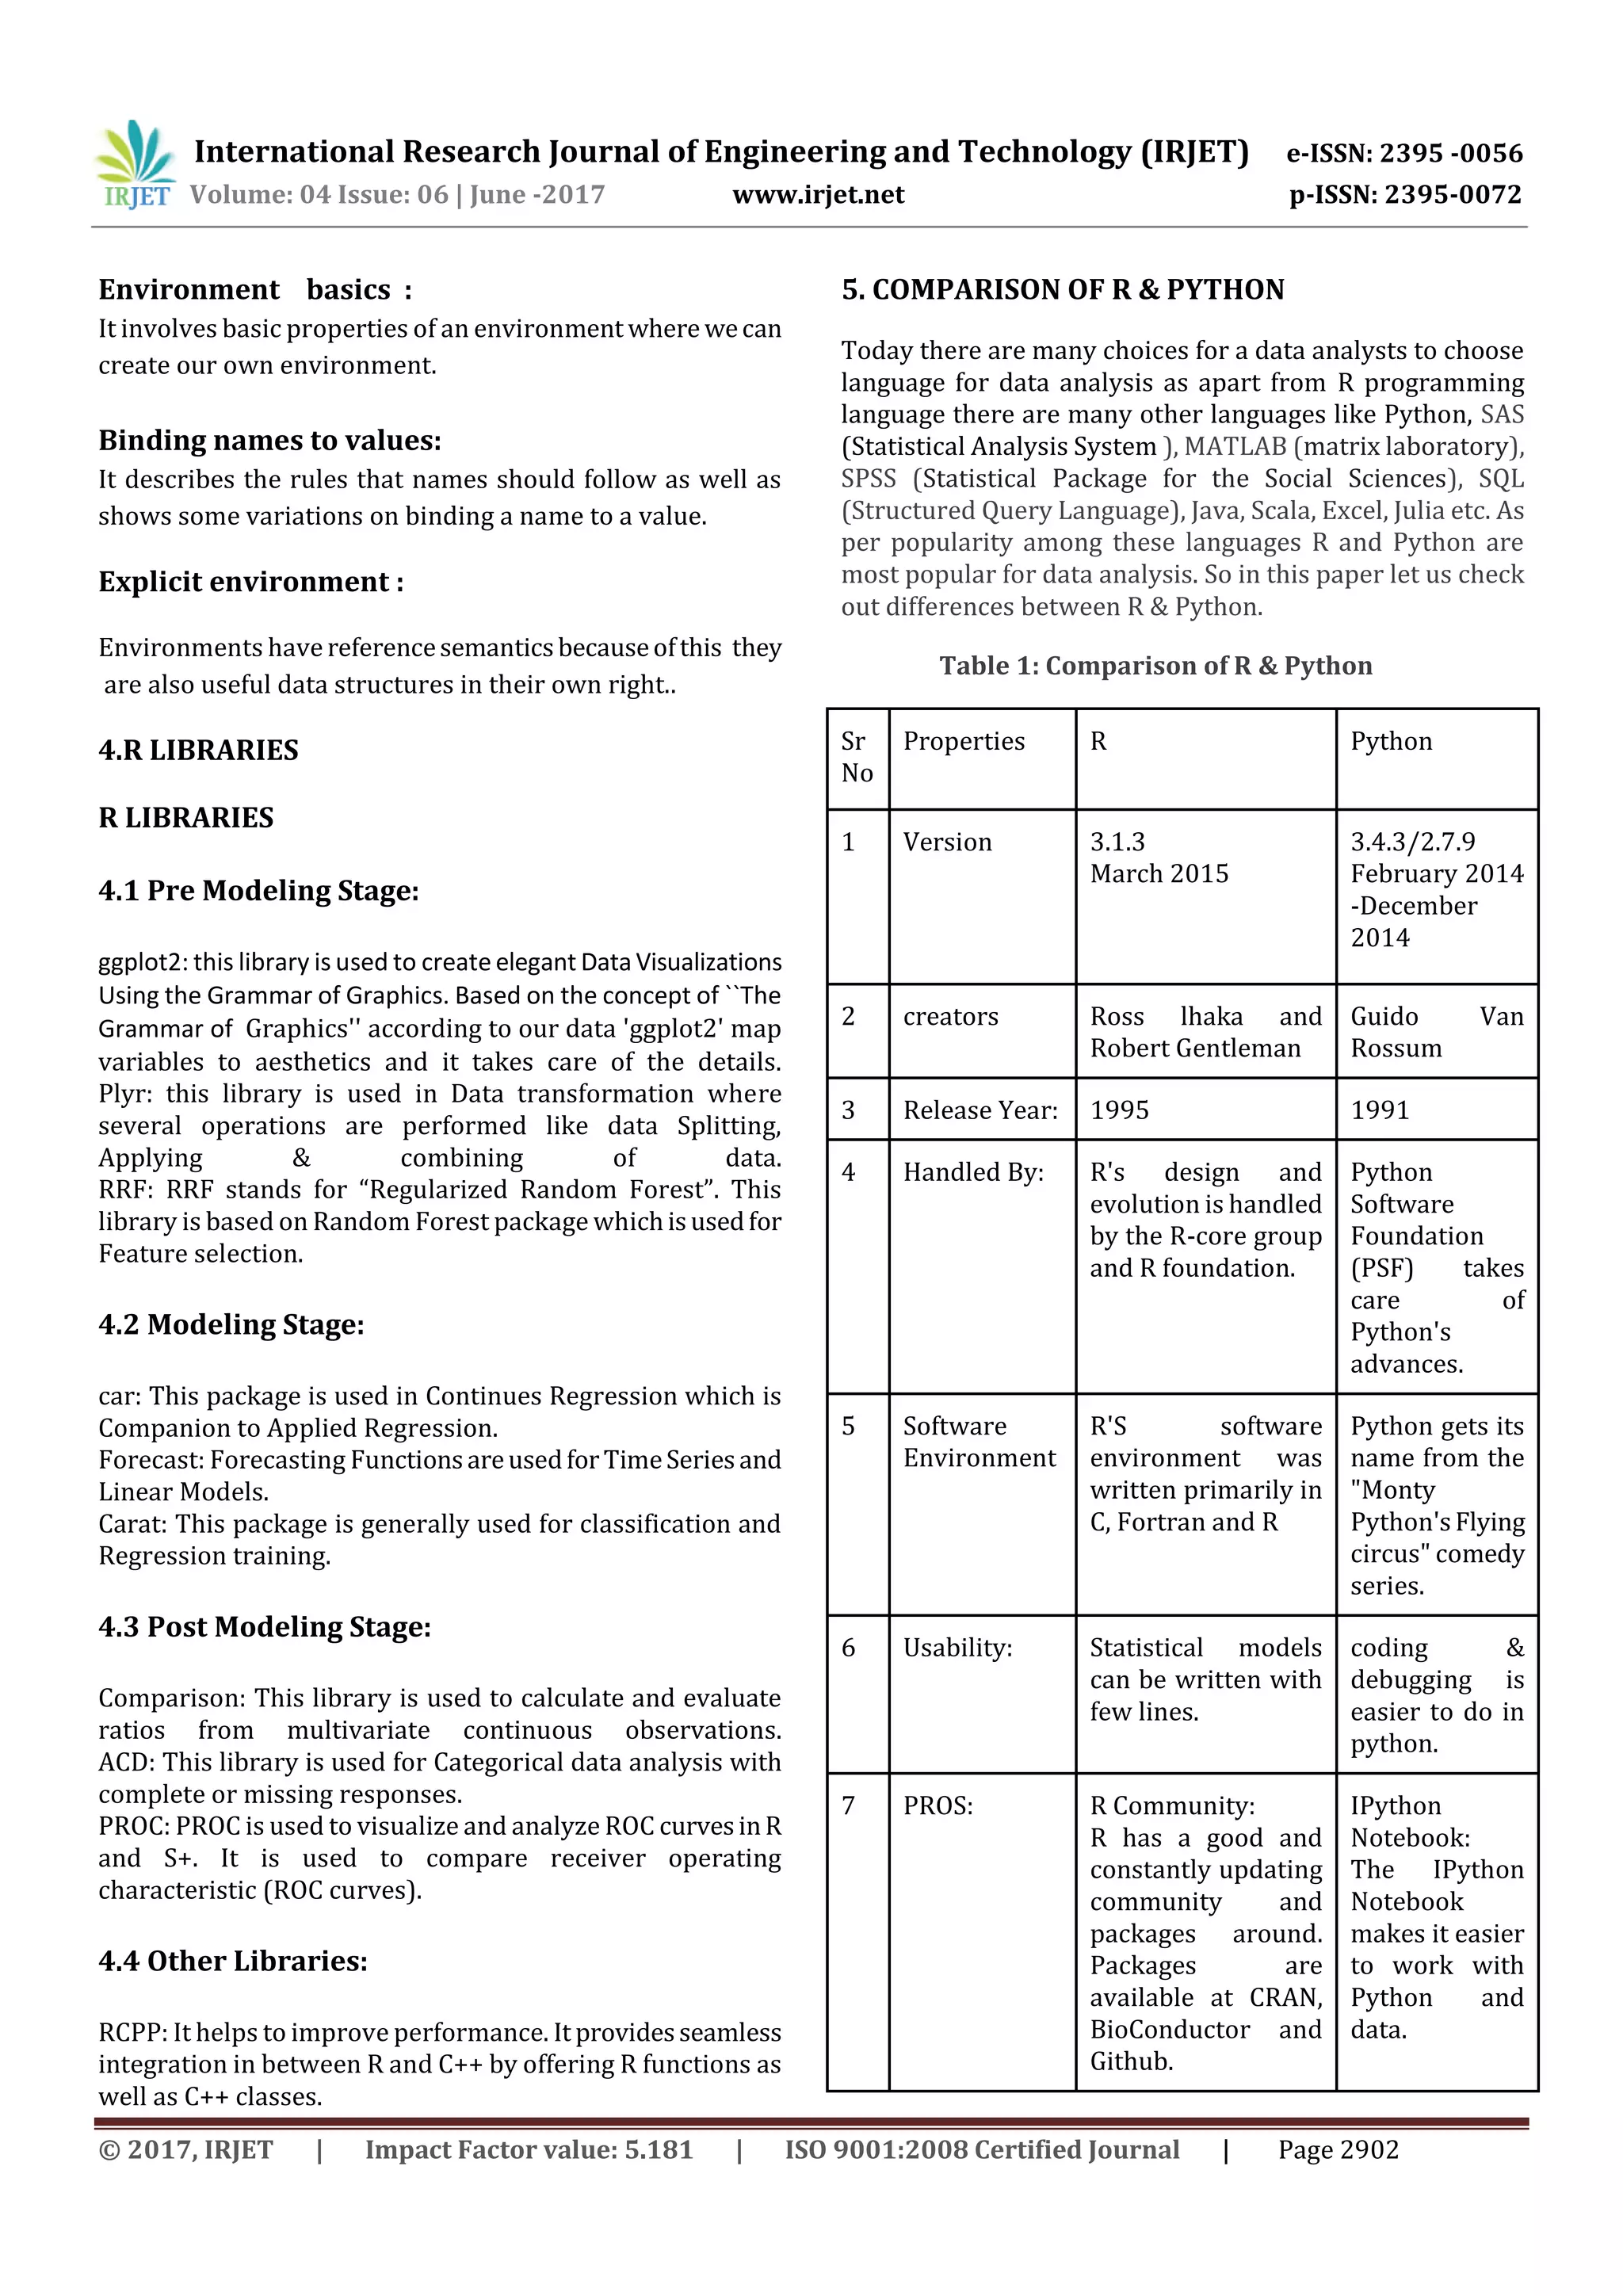
Table 1: Comparison of R & Python
Sr
No
Properties R Python
1 Version 3.1.3
March 2015
3.4.3/2.7.9
February 2014
-December
2014
2 creators Ross lhaka and
Robert Gentleman
Guido Van
Rossum
3 Release Year: 1995 1991
4 Handled By: R's design and
evolution is handled
by the R-core group
and R foundation.
Python
Software
Foundation
(PSF) takes
care of
Python's
advances.
5 Software
Environment
R'S software
environment was
written primarily in
C, Fortran and R
Python gets its
name from the
"Monty
Python'sFlying
circus" comedy
series.
6 Usability: Statistical models
can be written with
few lines.
coding &
debugging is
easier to do in
python.
7 PROS: R Community:
R has a good and
constantly updating
community and
packages around.
Packages are
available at CRAN,
BioConductor and
Github.
IPython
Notebook:
The IPython
Notebook
makes it easier
to work with
Python and
data.
International Research Journal of Engineering and Technology (IRJET) e-ISSN: 2395 -0056
Volume: 04 Issue: 06 | June -2017 www.irjet.net p-ISSN: 2395-0072
© 2017, IRJET | Impact Factor value: 5.181 | ISO 9001:2008 Certified Journal | Page 2903
8. CONS: R is slow
R will follow a lot of
codes to minimize
the data structuring
and all.
Python is a
challenger toR.
It Does not
offer much
package
strength than
R.
6. CONCLUSION
R is very popular language and easy to learn which
offers graphics & statistics techniques. Libraries plays
main role in R Studio and environment. CRAN allow
you to browse packages by topics which we want and
also it offers set of tools where we can automatically
install package of areas of interest. Due to multiple
features in R, it has numerous applications and used in
every field today.
7. REFERENCES
[1] https://www.analyticsvidhya.com/
[2] https://www.kaggle.com/
[3] https://www.r-project.org/
[4] https://discuss.analyticsvidhya.com/t/download-the-
complete-list-of-powerful-r-libraries-for-data-analysis/2624
[5] http://www.inside-r.org/why-use-r
[6] http://blog.revolutionanalytics.com/
[7] http://adv-r.had.co.nz/Environments.html
[8] https://www.datacamp.com/community/tutorials/r-or-
python-for-data-analysis#gs._vEf4Ac
[9] https://www.r-bloggers.com/environments-in-r/

Study of R Programming

  • 1.
    International Research Journalof Engineering and Technology (IRJET) e-ISSN: 2395 -0056 Volume: 04 Issue: 06 | June -2017 www.irjet.net p-ISSN: 2395-0072 © 2017, IRJET | Impact Factor value: 5.181 | ISO 9001:2008 Certified Journal | Page 2901 STUDY OF R PROGRAMMING Tejas Rajeshirke1, Ceena Joseph Thundiyal2, Nishi Tiku3 1 Student, Dept. of Master of Computer Application, Vivekanand Education Society's Institute of Technology, Maharashtra, India 3 Professor, Dept. of Master of Computer Application, Vivekanand Education Society's Institute of Technology, Maharashtra, India ---------------------------------------------------------------------***--------------------------------------------------------------------- Abstract - R is an open-source environment and easy to learn. R is very popular concepts which is used by many companies to visualize & analyze their data. Data analysis is the process of analyzing the part of statistics data for learning purposes.Libraries or Packages are playing important role in R programming language. It consists of various statistical modelling algorithmandmachinelearning concepts which enable users to make reproducible research and create informative products. Key Words: Data Analytics, Dataset, R , R Studio, R Libraries. 1. INTRODUCTION R tool is an implementation of S tool at Bell Labs. S was created by John Chambers. R tool was created by Ross Ihaka and Robert Gentleman at the University of Auckland, New Zealand. It is currently developed bytheR developmentcore team, in which John Chambers is also a part of it. R is named after the first two authors. The project was conceived in the year 1992, where the initial version was released in the year 1995 and the beta version in the year 2000. In this paper there are total six sections. The different sections are as follows : section 1 represents About R, its Advantages and Disadvantages , section 2 represents R Environment , section 3 represents Applications of R, section 4 represents R Libraries, section 5 represents Comparision R and Python, section 6 represents Conclusion and section 7 represents References used. 2. ABOUT R R is free open source which uses integrated development environment (IDE) as R Studio. It is easy to learn and most powerful data analytics programming language. It creates the most beautiful and unique data visualizations so that more than 70% of companies in US uses this software. It compiles the code and runs on a variety of UNIX platforms and similar systems like Windows and MacOS. Console: It is work area where actual scripts get implemented. 2.1 Advantages: R tool is available for anyone to use as it is a fee software. It does not have any license restrictions, hence can be run anywhere. It can import tools from many other softerwares. It produces graphics in pdf,jpg, png and svg fomats. R has 4800 packages which are available from multiplae repositories. There is an active user groups where any query that is been put up is responded within a short span of time. 2.2 Disadvantages: R give a very less thought on memory management. Almost utilises all the disk space. R tool is best suitd for people with data oriented problems and not for programmers. R cannot be used as a back-end server for calculations. It is less secure 3. R ENVIRONMENT R environment is suitable for computing statistics & computer graphics. It is integration pack of software facility which includes Manipulation of data, calculation of data & data in graphical format. R environments is area where we can store objects, variables, functions.
  • 2.
    International Research Journalof Engineering and Technology (IRJET) e-ISSN: 2395 -0056 Volume: 04 Issue: 06 | June -2017 www.irjet.net p-ISSN: 2395-0072 © 2017, IRJET | Impact Factor value: 5.181 | ISO 9001:2008 Certified Journal | Page 2902 Environment basics : It involves basic properties of an environment where wecan create our own environment. Binding names to values: It describes the rules that names should follow as well as shows some variations on binding a name to a value. Explicit environment : Environments have referencesemanticsbecauseofthis they are also useful data structures in their own right.. 4.R LIBRARIES R LIBRARIES 4.1 Pre Modeling Stage: ggplot2: this library is used to create elegant DataVisualizations Using the Grammar of Graphics. Based on the concept of ``The Grammar of Graphics'' according to our data 'ggplot2' map variables to aesthetics and it takes care of the details. Plyr: this library is used in Data transformation where several operations are performed like data Splitting, Applying & combining of data. RRF: RRF stands for “Regularized Random Forest”. This library is based on Random Forest package whichisusedfor Feature selection. 4.2 Modeling Stage: car: This package is used in Continues Regression which is Companion to Applied Regression. Forecast: Forecasting FunctionsareusedforTimeSeriesand Linear Models. Carat: This package is generally used for classification and Regression training. 4.3 Post Modeling Stage: Comparison: This library is used to calculate and evaluate ratios from multivariate continuous observations. ACD: This library is used for Categorical data analysis with complete or missing responses. PROC: PROC is used to visualize and analyze ROC curvesinR and S+. It is used to compare receiver operating characteristic (ROC curves). 4.4 Other Libraries: RCPP: It helps to improve performance. It providesseamless integration in between R and C++ by offering R functions as well as C++ classes. 5. COMPARISON OF R & PYTHON Today there are many choices for a data analysts to choose language for data analysis as apart from R programming language there are many other languages like Python, SAS (Statistical Analysis System ), MATLAB (matrix laboratory), SPSS (Statistical Package for the Social Sciences), SQL (Structured Query Language), Java, Scala, Excel, Julia etc. As per popularity among these languages R and Python are most popular for data analysis. So in this paper let us check out differences between R & Python. Table 1: Comparison of R & Python Sr No Properties R Python 1 Version 3.1.3 March 2015 3.4.3/2.7.9 February 2014 -December 2014 2 creators Ross lhaka and Robert Gentleman Guido Van Rossum 3 Release Year: 1995 1991 4 Handled By: R's design and evolution is handled by the R-core group and R foundation. Python Software Foundation (PSF) takes care of Python's advances. 5 Software Environment R'S software environment was written primarily in C, Fortran and R Python gets its name from the "Monty Python'sFlying circus" comedy series. 6 Usability: Statistical models can be written with few lines. coding & debugging is easier to do in python. 7 PROS: R Community: R has a good and constantly updating community and packages around. Packages are available at CRAN, BioConductor and Github. IPython Notebook: The IPython Notebook makes it easier to work with Python and data.
  • 3.
    International Research Journalof Engineering and Technology (IRJET) e-ISSN: 2395 -0056 Volume: 04 Issue: 06 | June -2017 www.irjet.net p-ISSN: 2395-0072 © 2017, IRJET | Impact Factor value: 5.181 | ISO 9001:2008 Certified Journal | Page 2903 8. CONS: R is slow R will follow a lot of codes to minimize the data structuring and all. Python is a challenger toR. It Does not offer much package strength than R. 6. CONCLUSION R is very popular language and easy to learn which offers graphics & statistics techniques. Libraries plays main role in R Studio and environment. CRAN allow you to browse packages by topics which we want and also it offers set of tools where we can automatically install package of areas of interest. Due to multiple features in R, it has numerous applications and used in every field today. 7. REFERENCES [1] https://www.analyticsvidhya.com/ [2] https://www.kaggle.com/ [3] https://www.r-project.org/ [4] https://discuss.analyticsvidhya.com/t/download-the- complete-list-of-powerful-r-libraries-for-data-analysis/2624 [5] http://www.inside-r.org/why-use-r [6] http://blog.revolutionanalytics.com/ [7] http://adv-r.had.co.nz/Environments.html [8] https://www.datacamp.com/community/tutorials/r-or- python-for-data-analysis#gs._vEf4Ac [9] https://www.r-bloggers.com/environments-in-r/