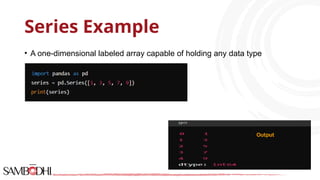
Download to read offline

![Panel Data Example
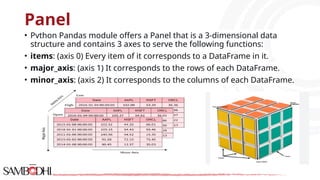
•A three-dimensional data structure designed for handling 3D data.
•As of Pandas version 1.0.0, Panels are deprecated and users are encouraged to use multi-index DataFrames
import numpy as np
panel = pd.Panel(np.random.rand(2, 3, 4), items=['Item1', 'Item2'], major_axis=['A', 'B', 'C'], minor_axis=['X1', 'X2', 'X3', 'X4'])
print(panel)](https://image.slidesharecdn.com/session9-240828134001-df104403/85/Basic-data-manipulation-with-pandas-pandas-10-320.jpg)


![Panel Data Example
•A three-dimensional data structure designed for handling 3D data.
•As of Pandas version 1.0.0, Panels are deprecated and users are encouraged to use multi-index DataFrames
import numpy as np
panel = pd.Panel(np.random.rand(2, 3, 4), items=['Item1', 'Item2'], major_axis=['A', 'B', 'C'], minor_axis=['X1', 'X2', 'X3', 'X4'])
print(panel)](https://image.slidesharecdn.com/session9-240828134001-df104403/75/Basic-data-manipulation-with-pandas-pandas-10-2048.jpg)


This document provides an introduction to Python for data science, focusing on the Pandas library, which is used for data manipulation and analysis. It covers fundamental concepts such as Series, DataFrame, and Panel data structures, including their creation, characteristics, and methods for statistical analysis. It also includes installation instructions for Pandas and explains how to manage data effectively within these structures.
An overview of the presentation focused on Python's application in Data Science.
Topics related to OOPS, Anaconda installation, Jupyter Notebook interface, and usage shortcuts.
Introduction to Pandas with agenda on Series, DataFrame, installation, and data manipulation techniques.
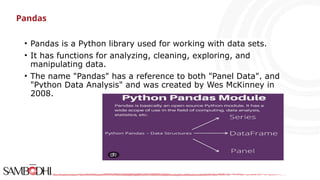
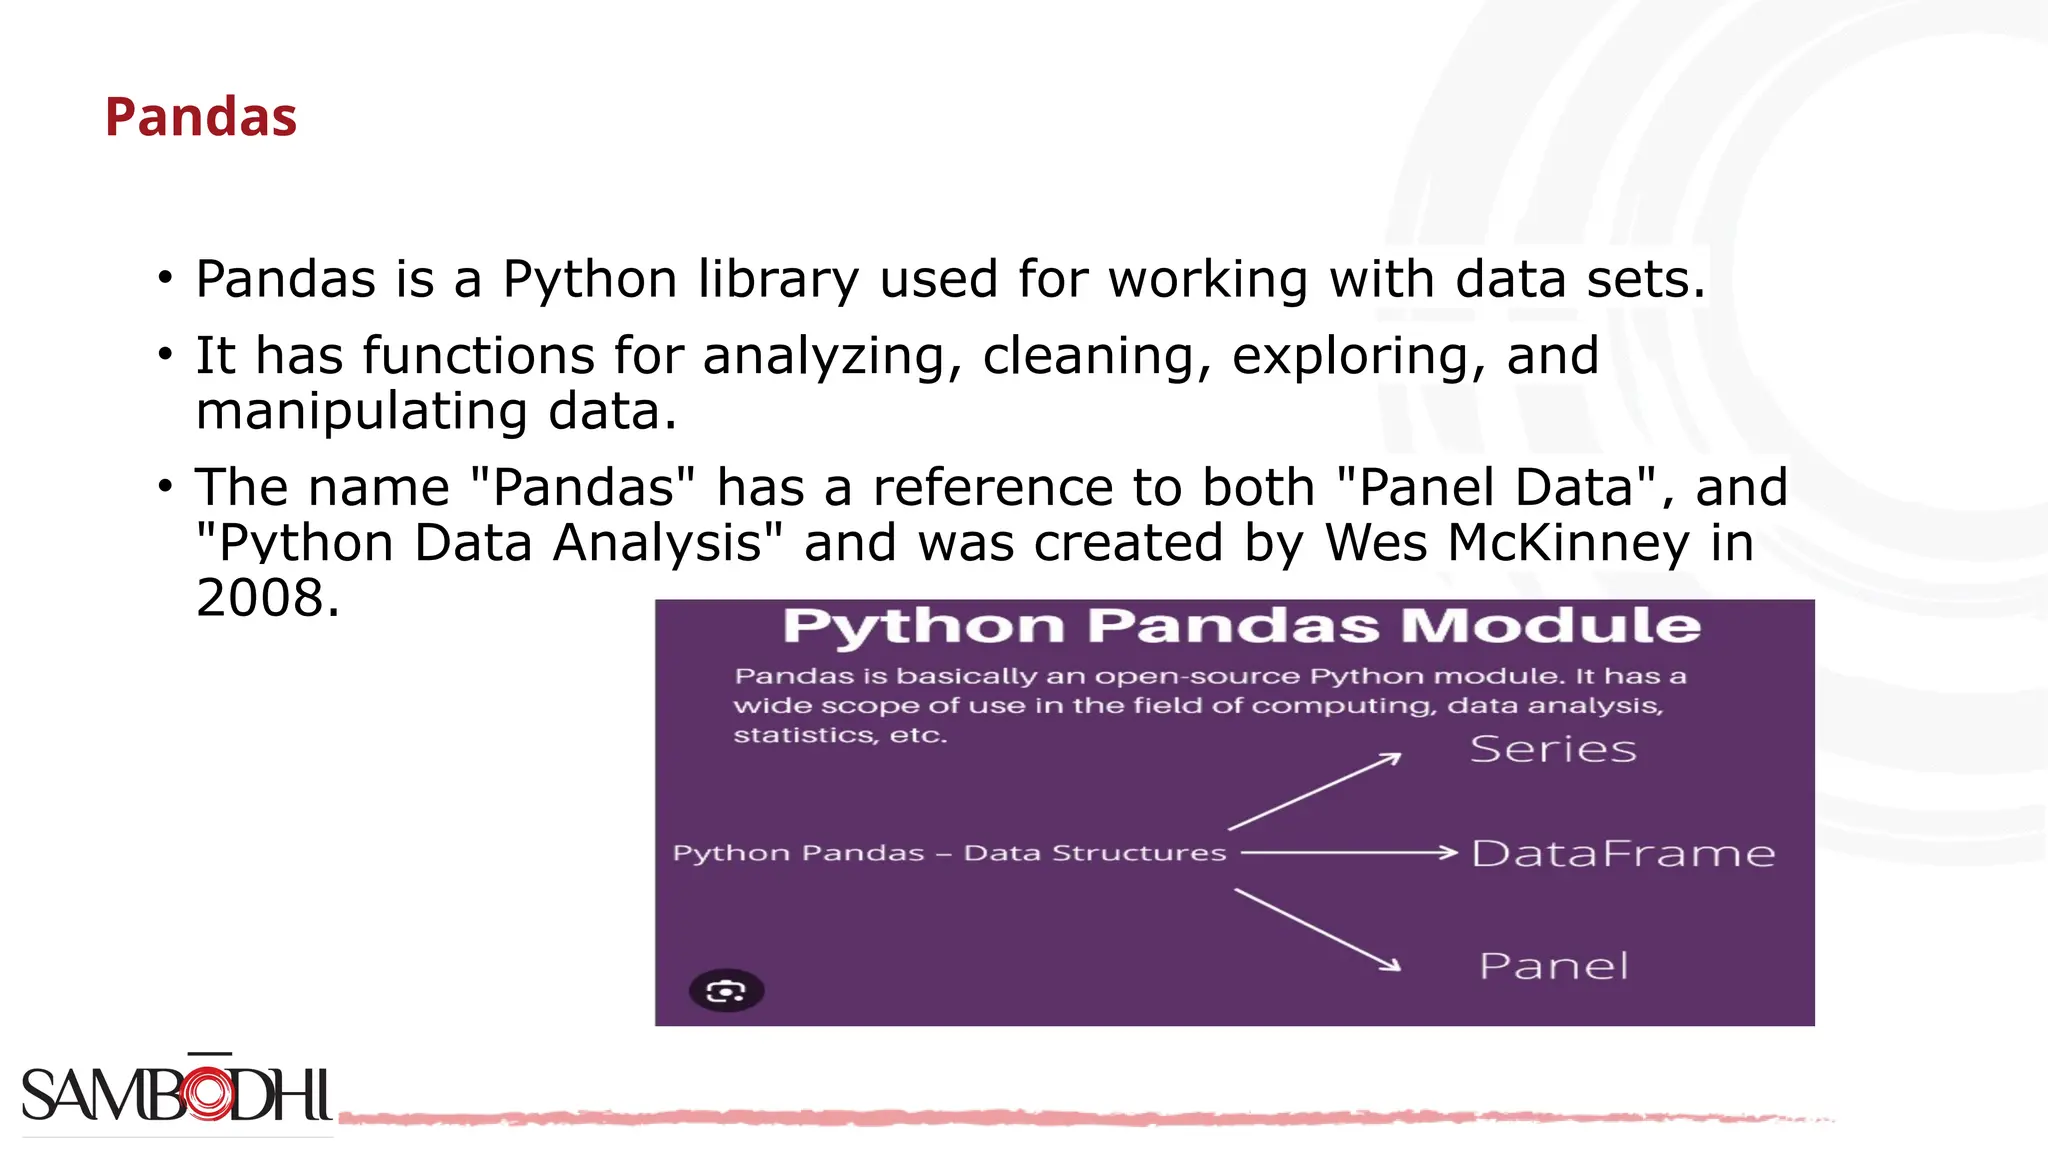
Pandas is a data manipulation library enabling analysis, cleaning, and exploration of datasets.
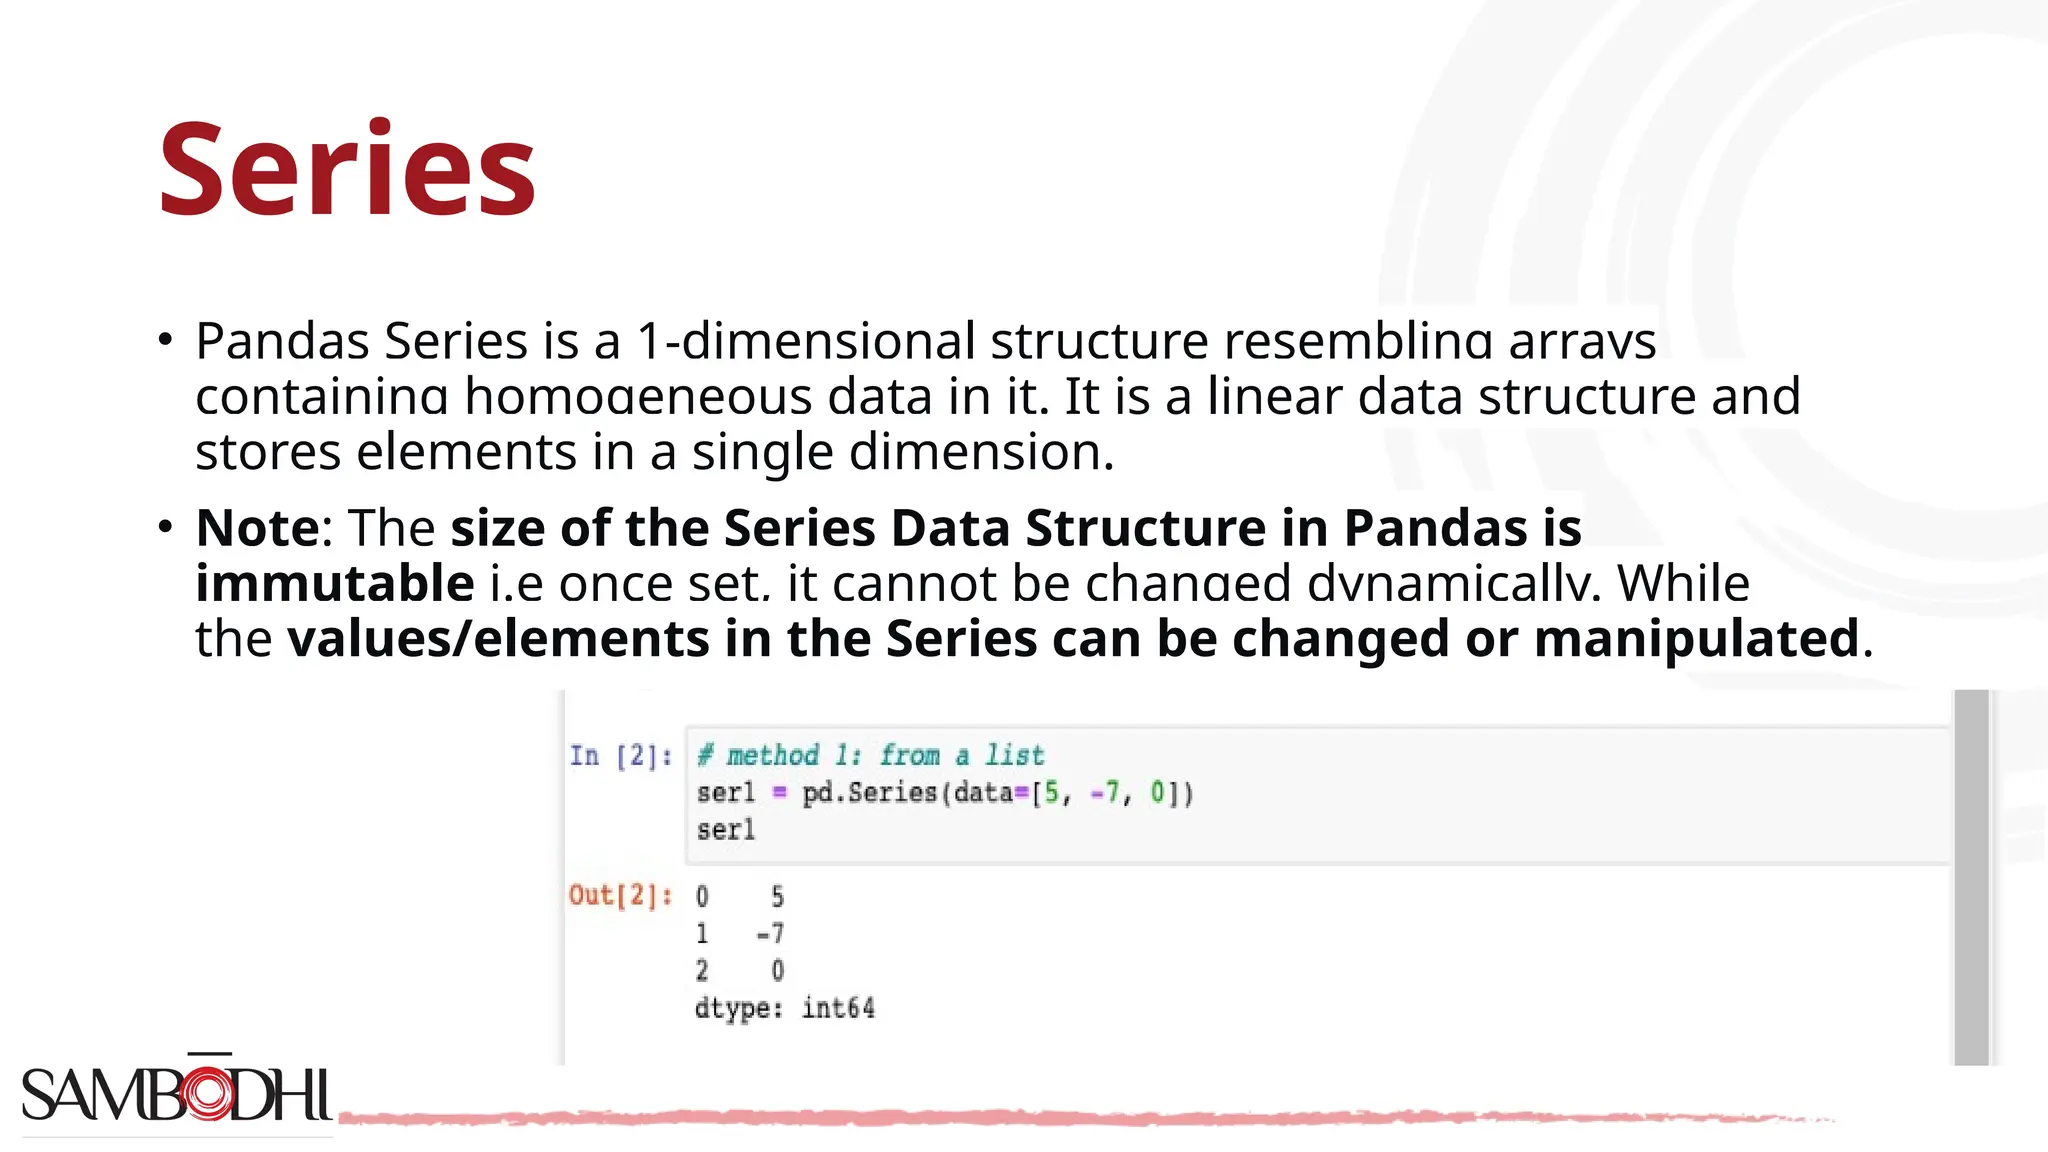
Description of Pandas Series as a 1D array-like structure for homogeneous data and its immutability.
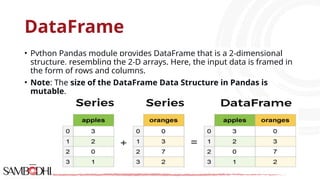
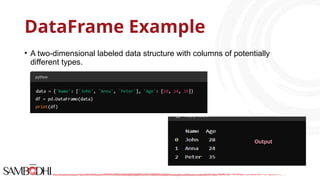
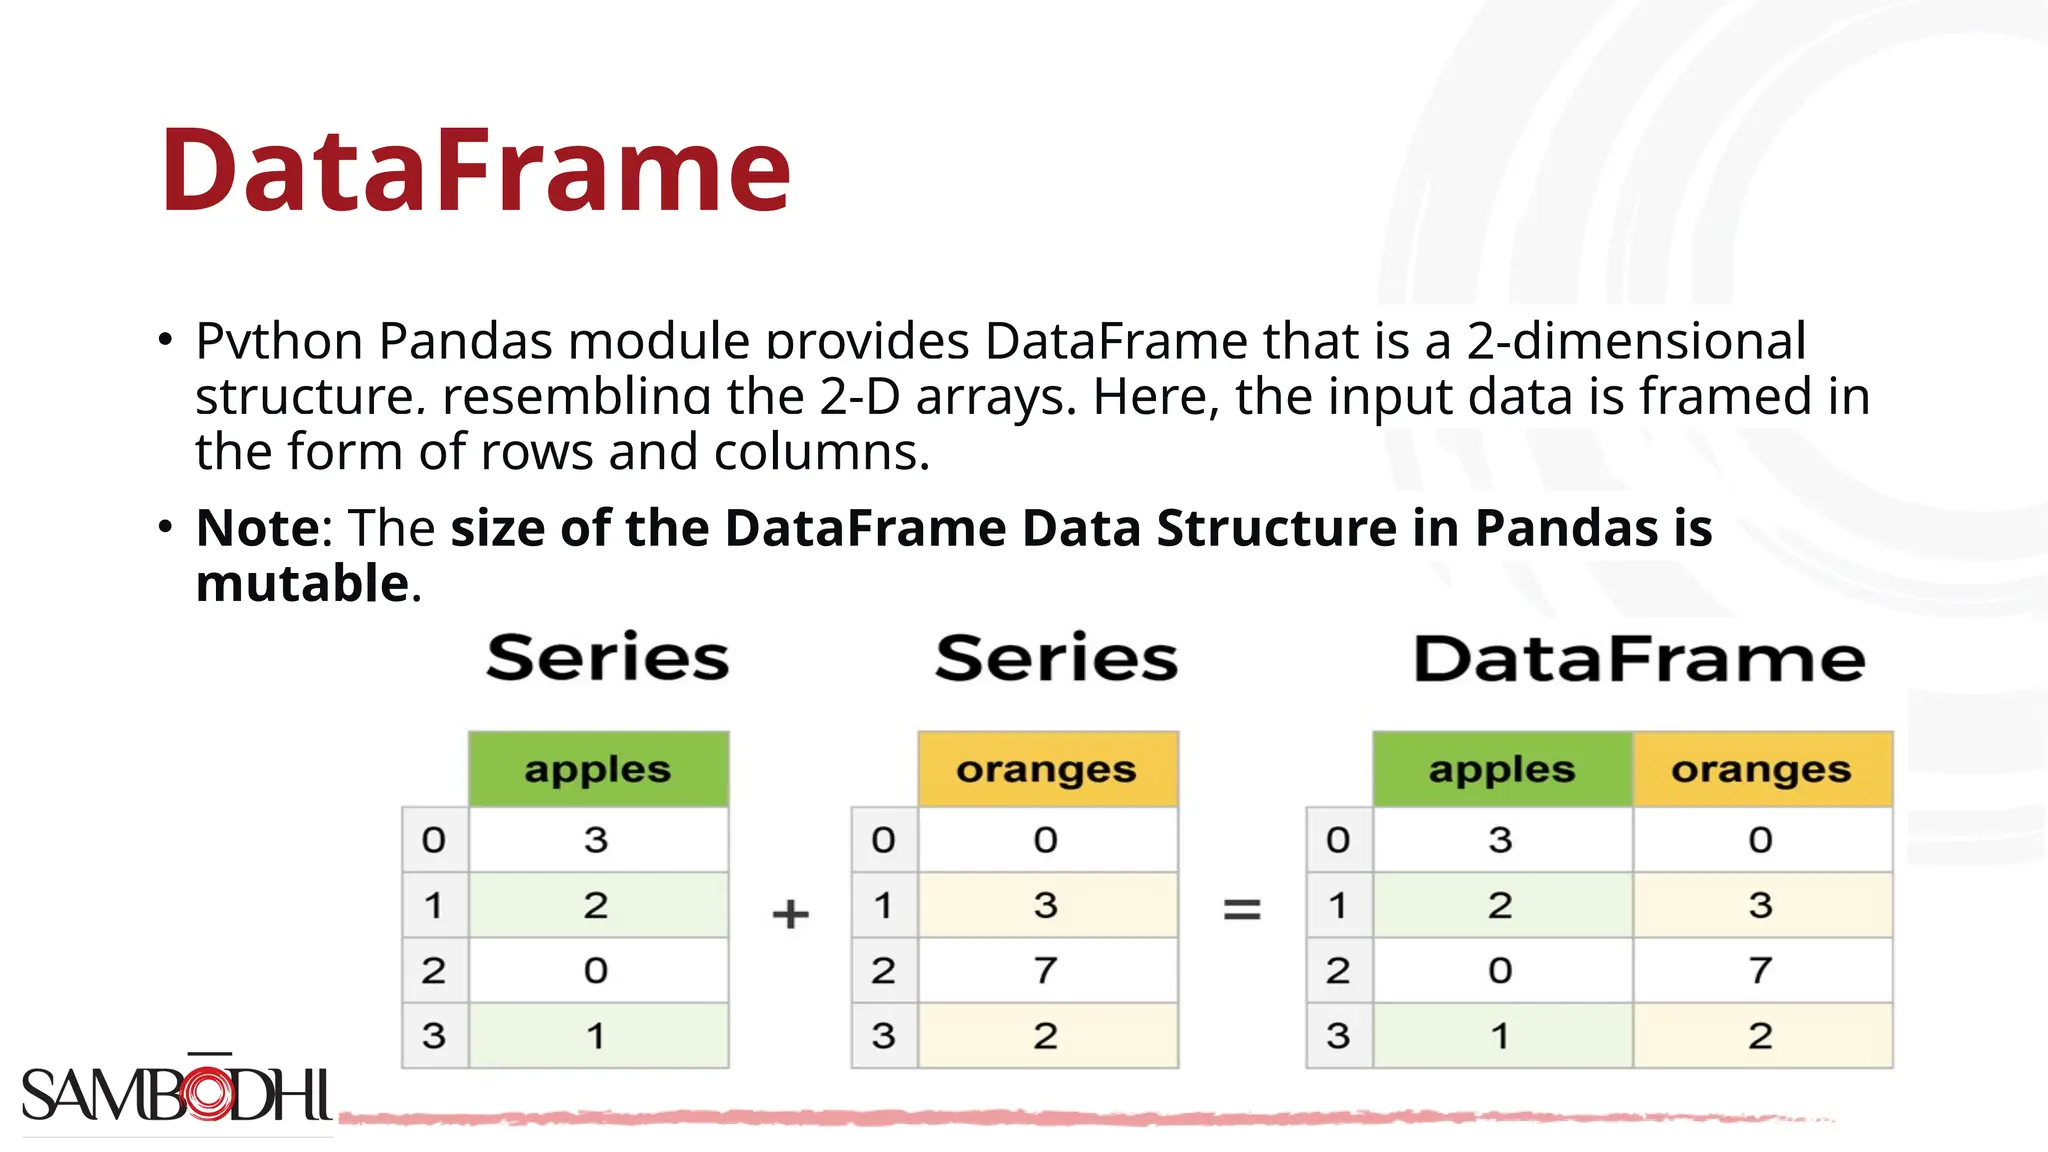
DataFrame as a 2D structure in Pandas, framed in rows and columns, supporting various data types.
Panel as a 3D data structure used in Pandas, increasingly deprecated in favor of multi-index DataFrames.
Methods of installing Pandas, particularly using the Python package installer PIP.
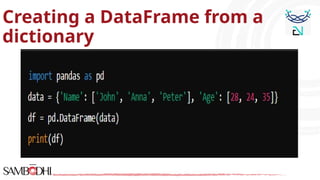
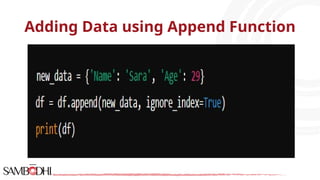
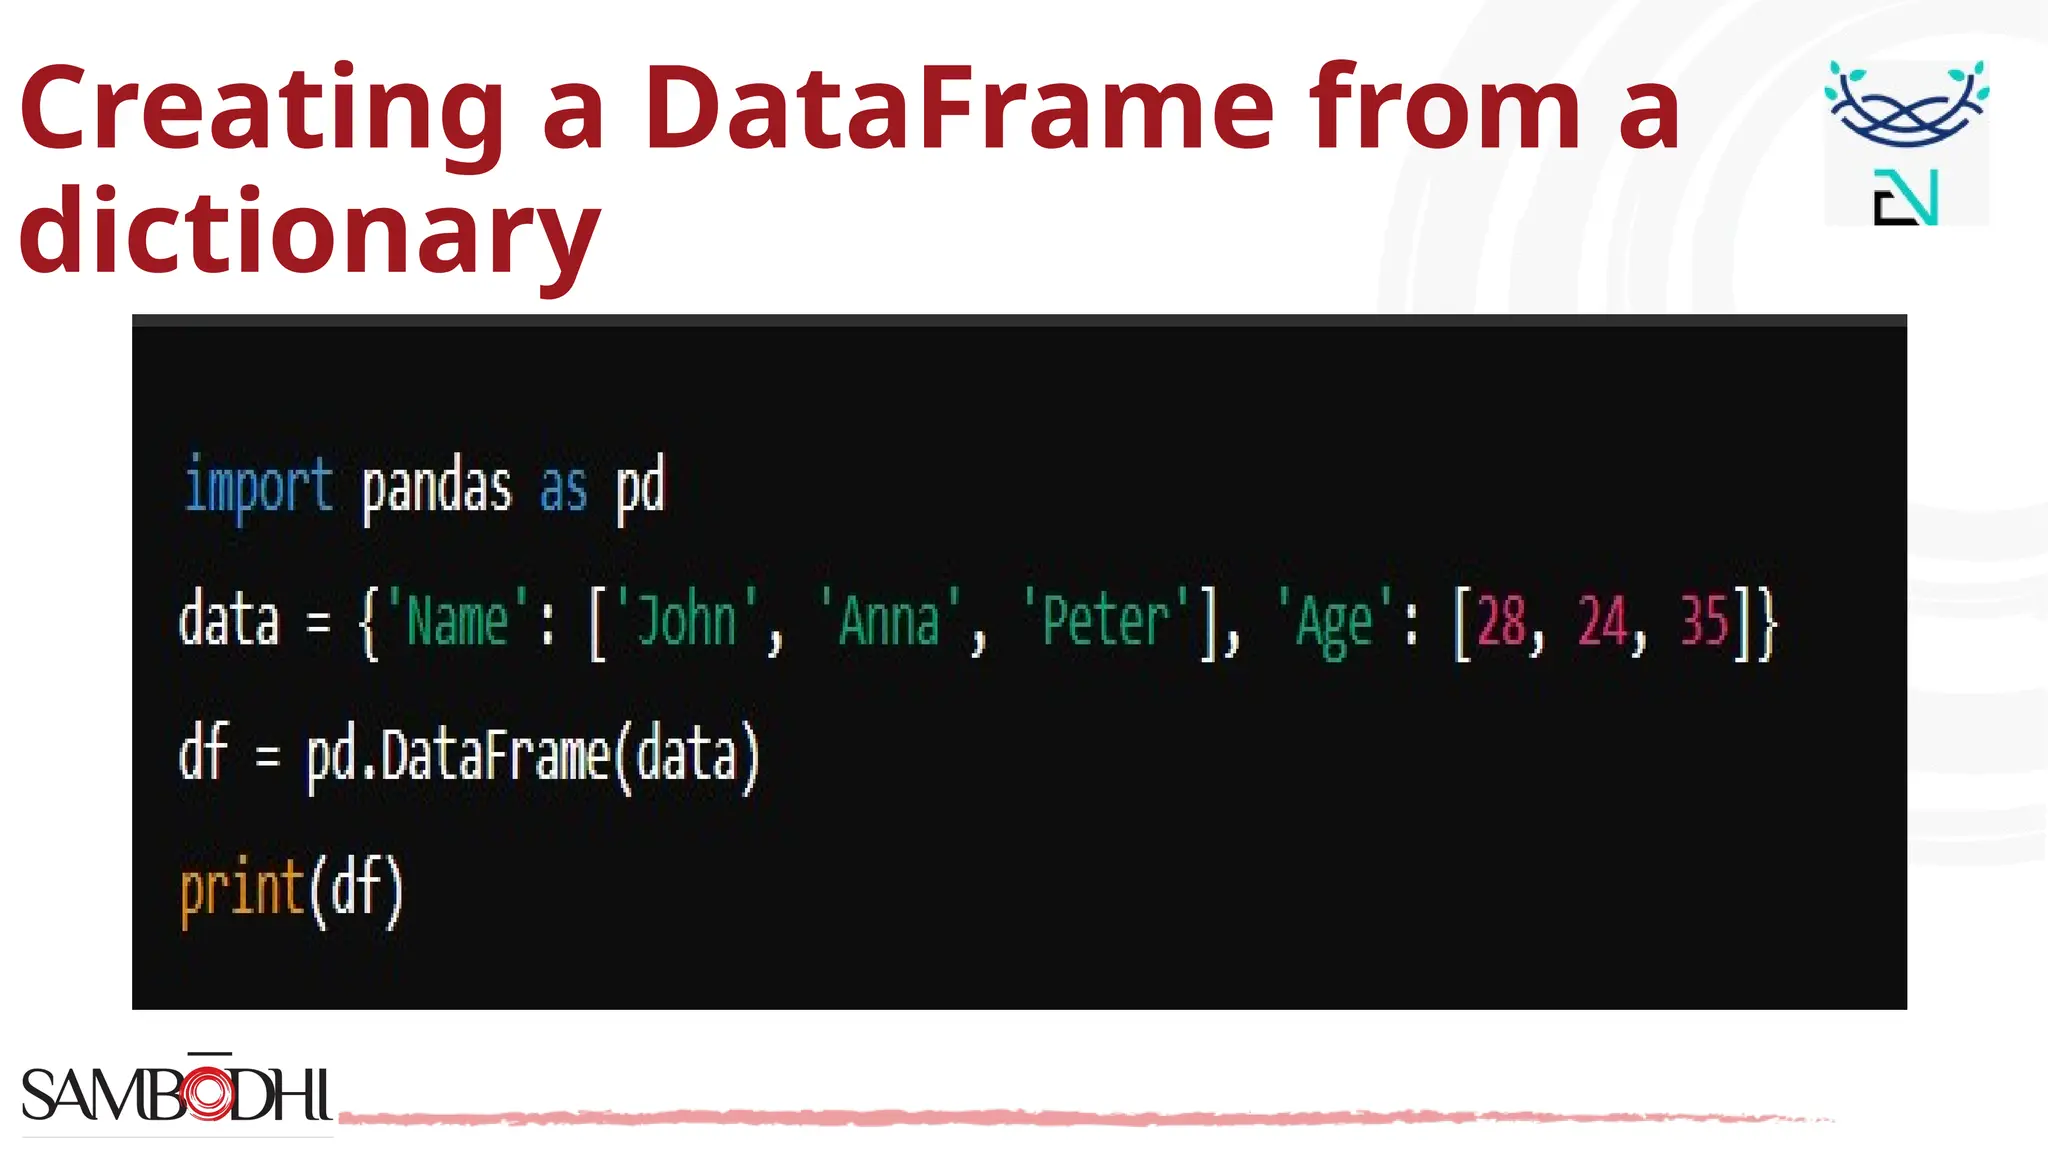
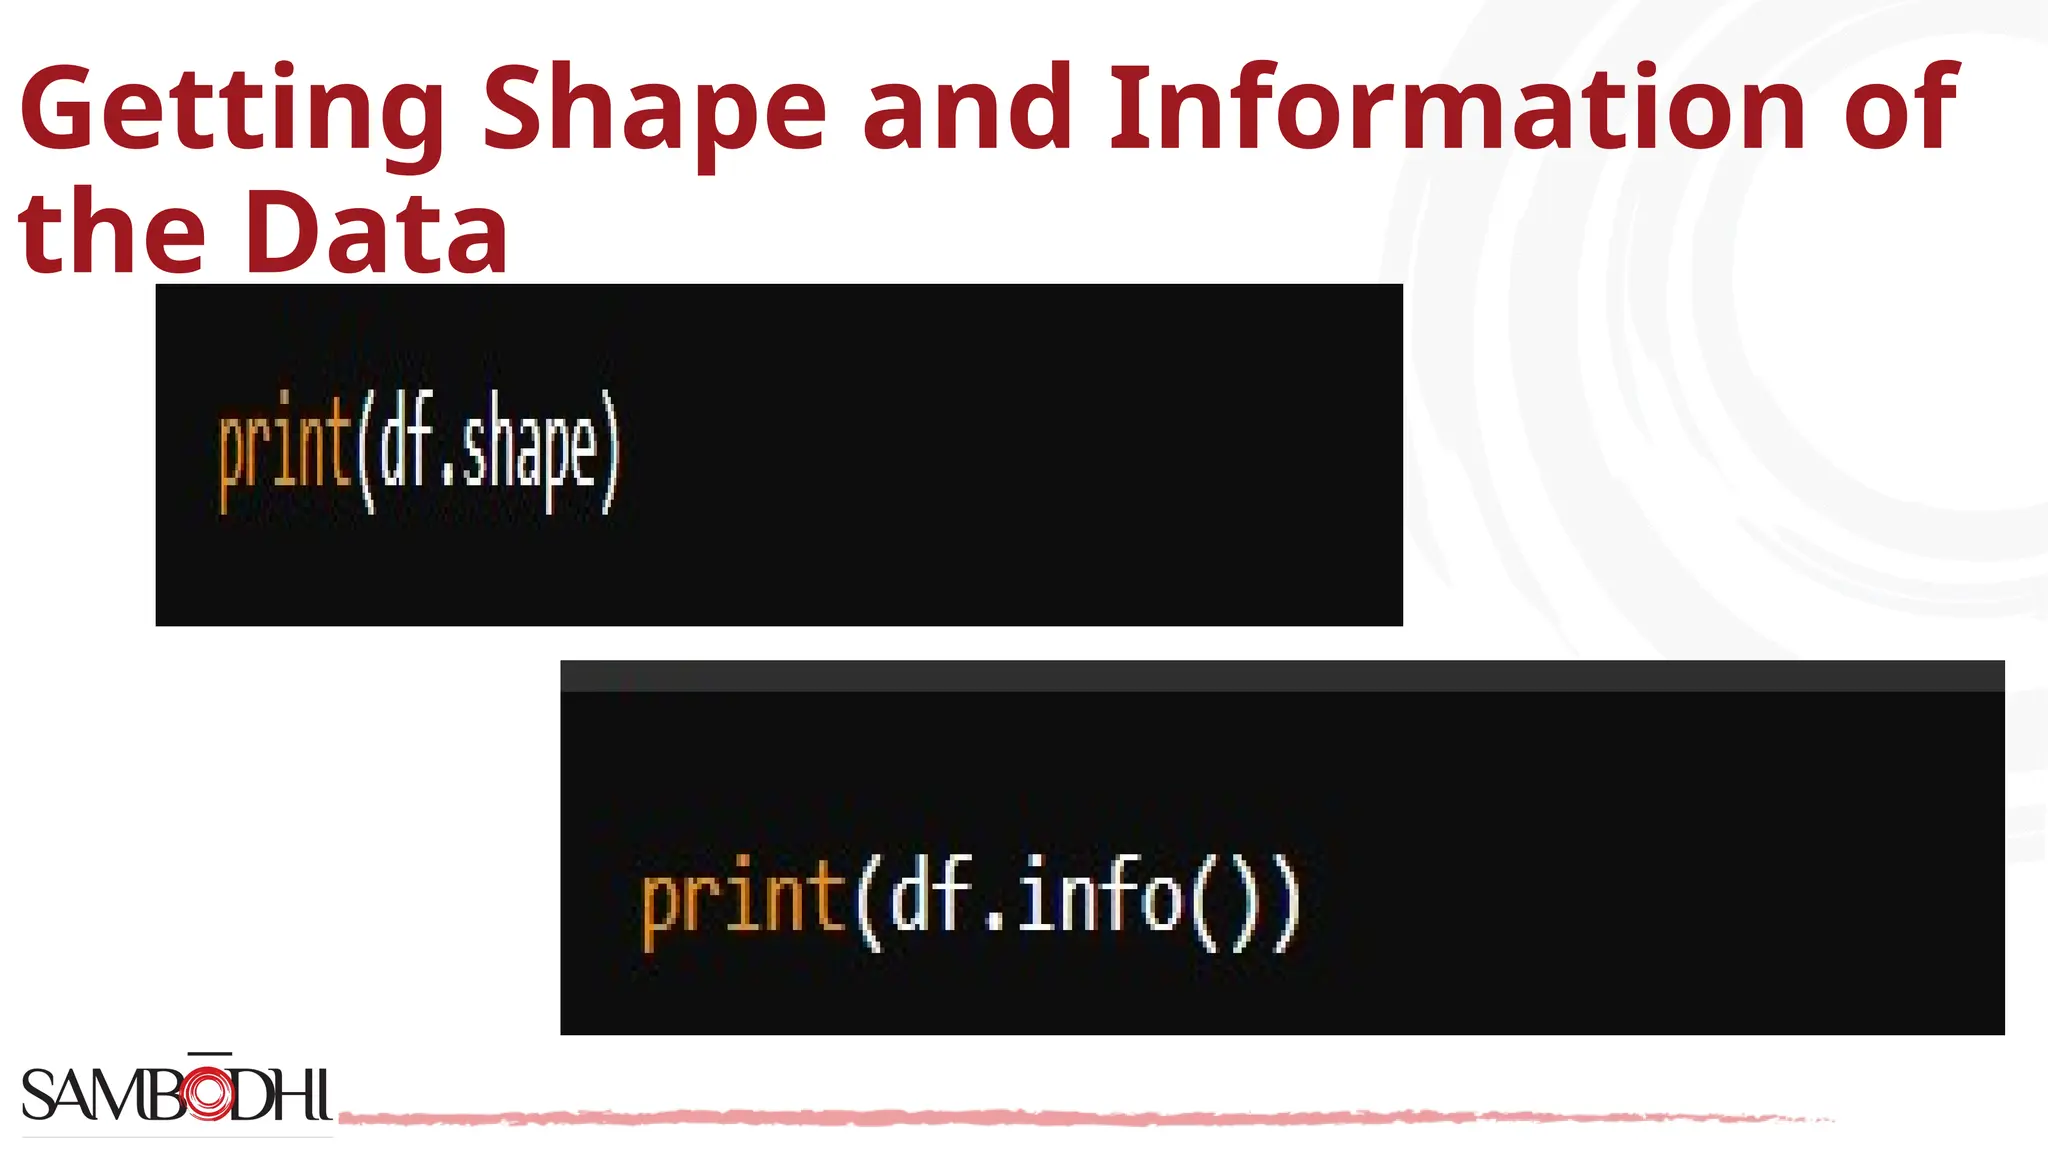
Processes for creating DataFrames from dictionaries, adding data, and retrieving shape and information.
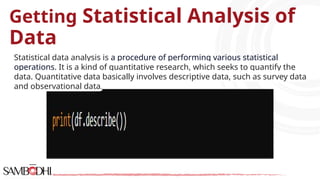
Procedures for conducting quantitative statistical analysis to summarize and analyze data.
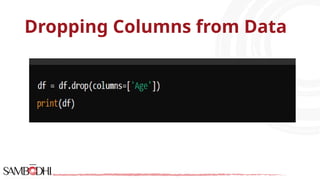
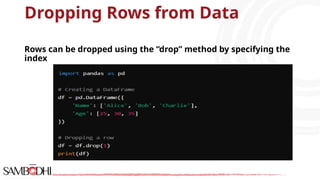
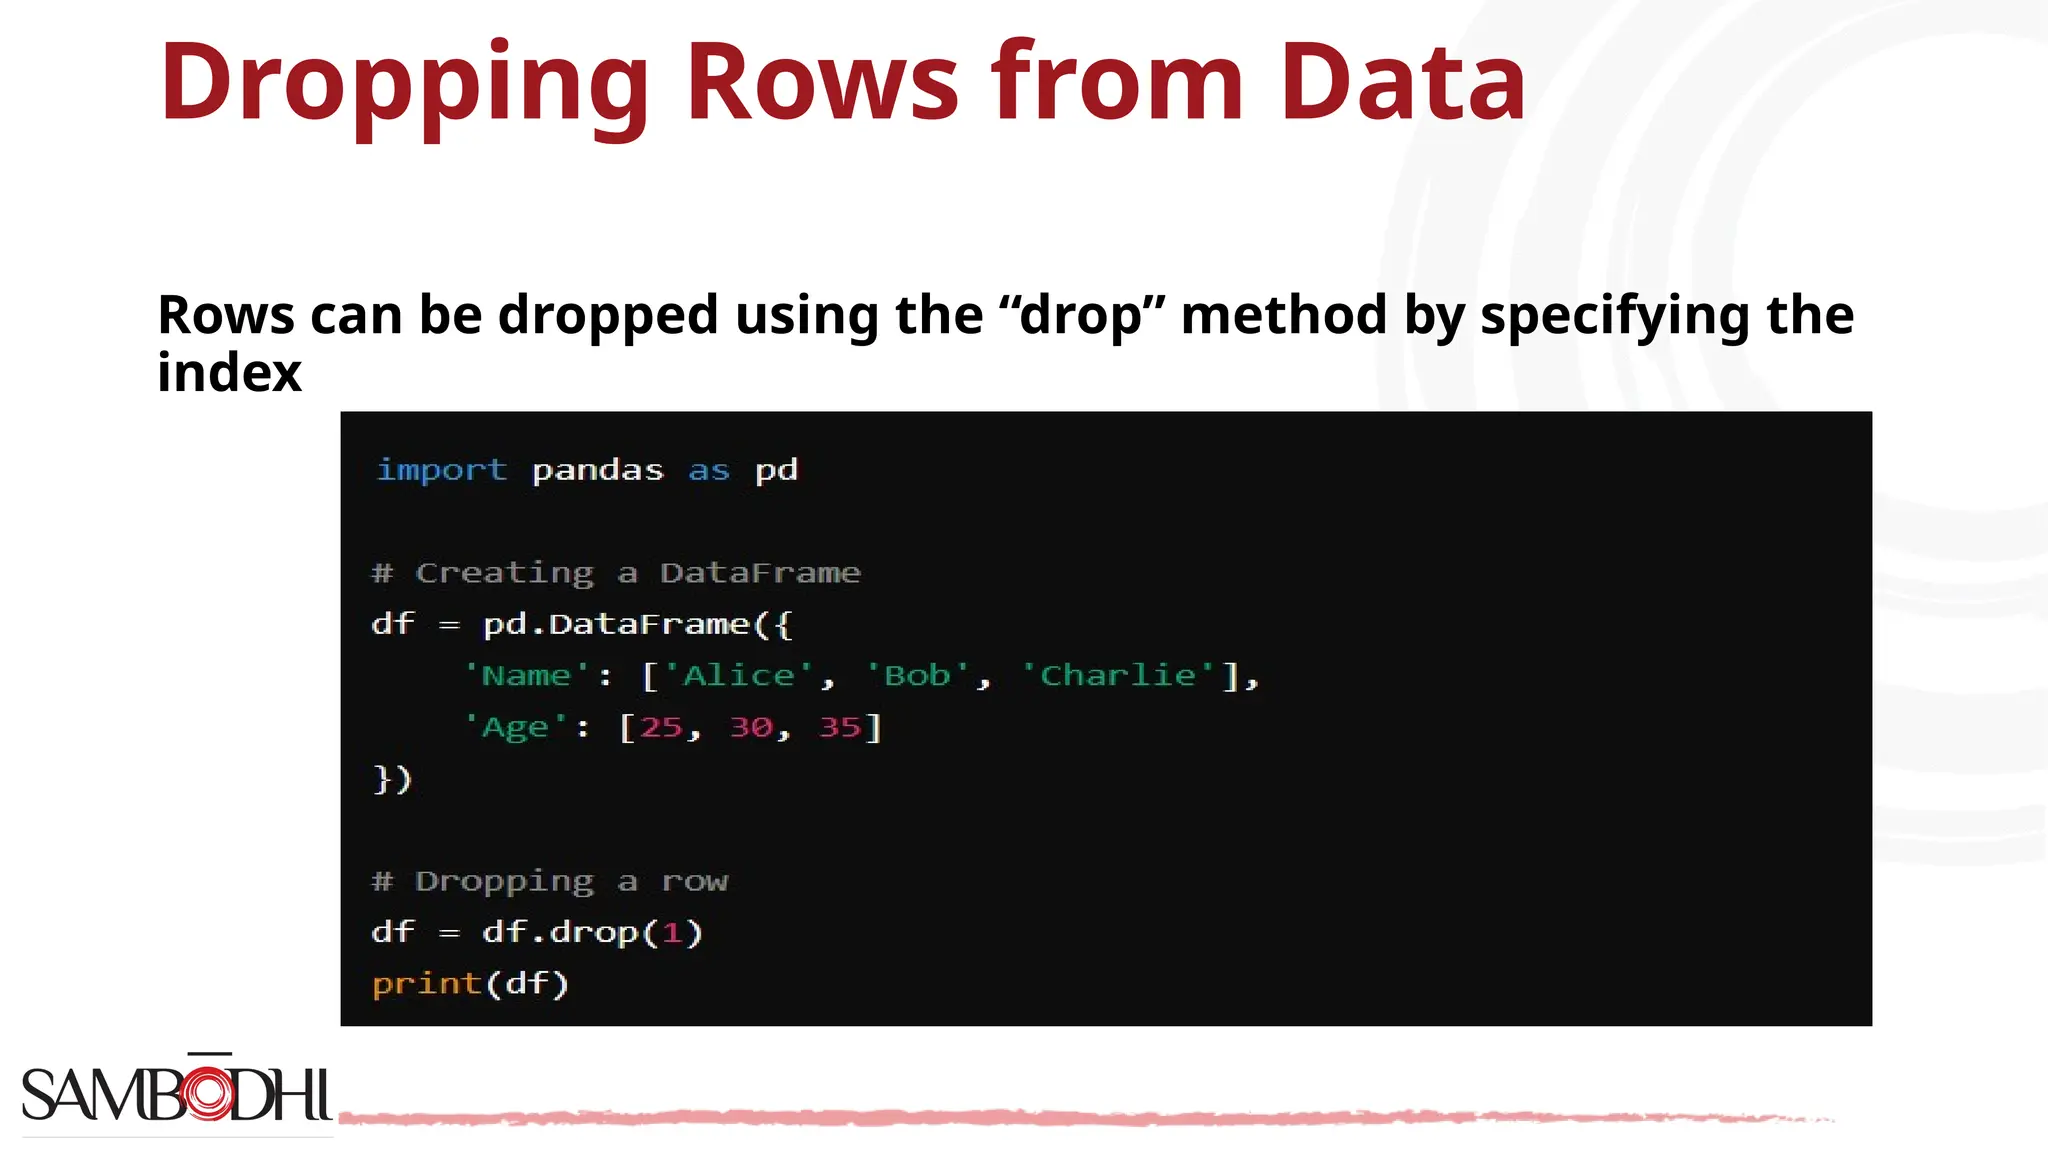
Techniques for dropping columns and rows in a DataFrame using the 'drop' method.
An interactive Q&A section addressing key concepts in Pandas and its application.
Focused questions to test knowledge about Pandas Series, DataFrame installation, and data shape retrieval.


