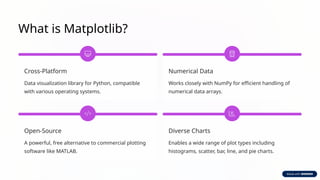
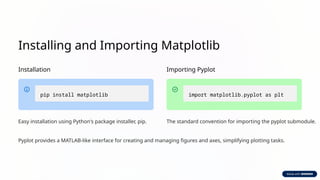
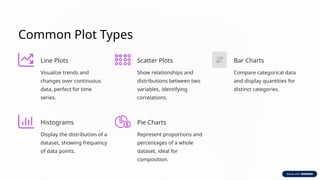
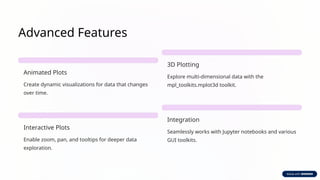
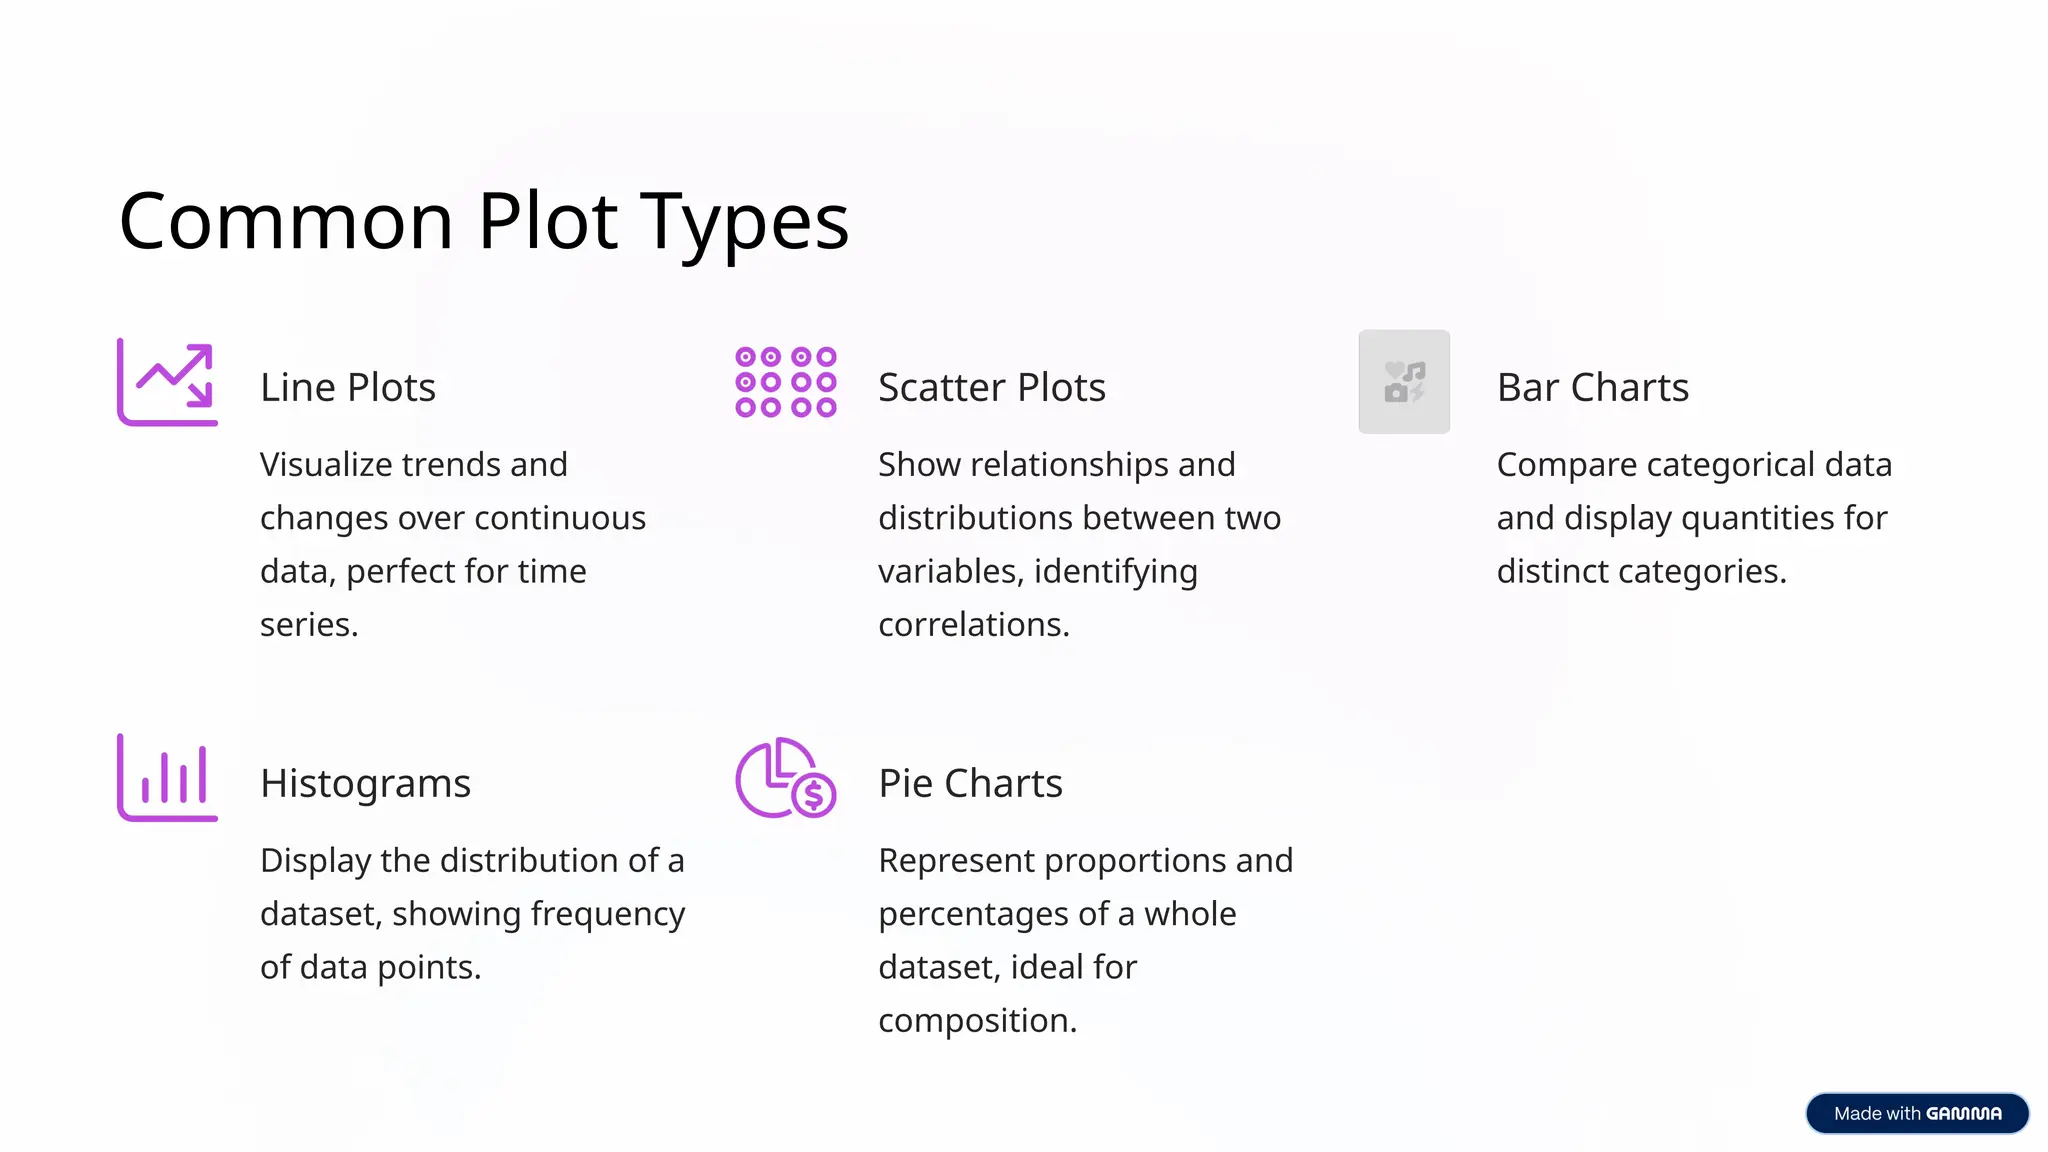
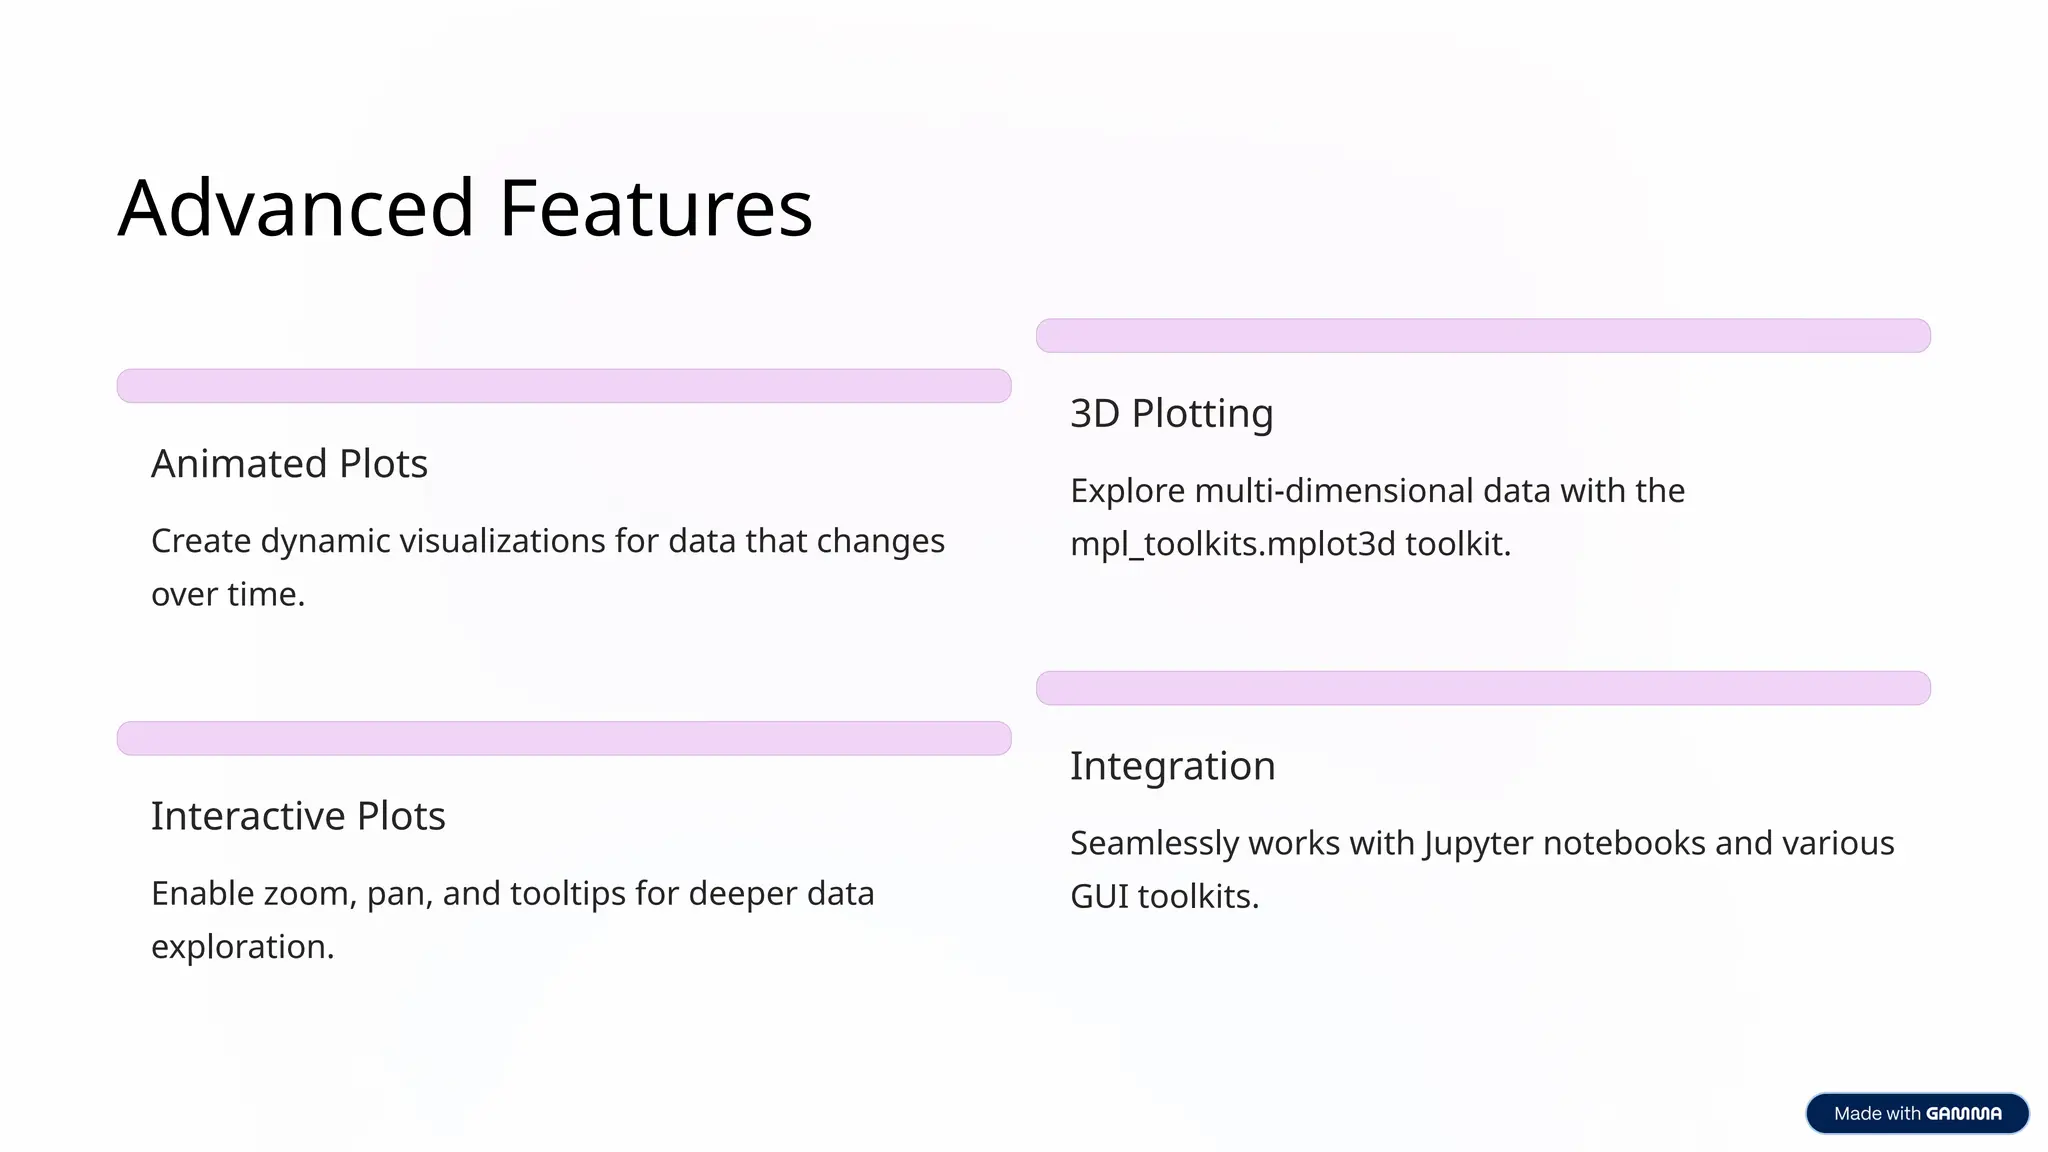
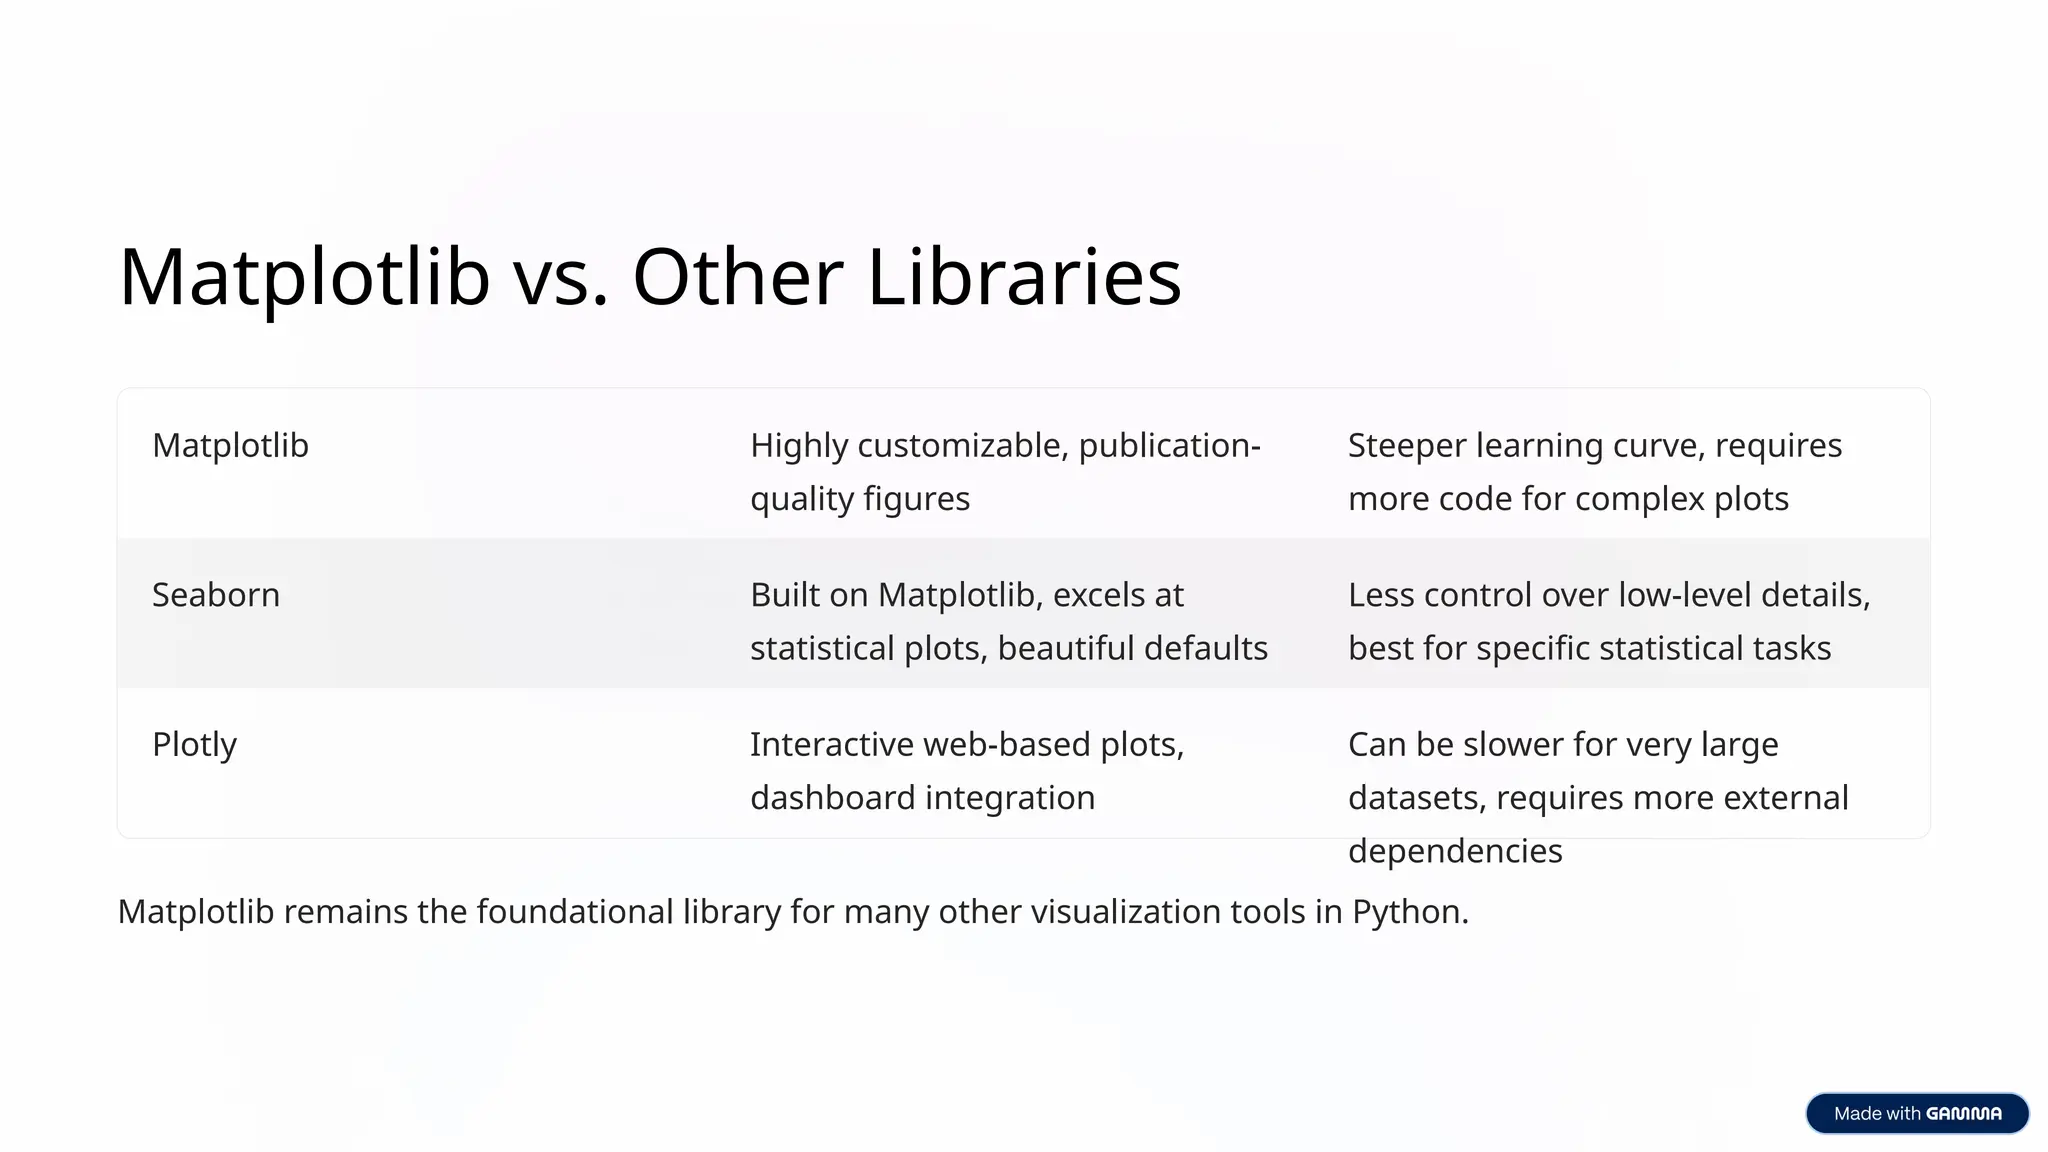
Matplotlib is a powerful and widely-used plotting library in Python that enables users to create static, interactive, and animated visualizations. Designed to work seamlessly with NumPy and Pandas, it provides a MATLAB-like interface through its pyplot module, making it easy for beginners and professionals alike to generate a wide range of charts—from simple line graphs and bar charts to complex 3D plots. Ideal for data analysis, scientific computing, and machine learning projects, Matplotlib offers fine-grained control over every element of a figure, including axes, labels, colors, and more. Whether you're visualizing trends, distributions, or relationships in data, Matplotlib is an essential tool in the Python data visualization ecosystem.


![python libray for data analytics seaborn[1].pptx](https://cdn.slidesharecdn.com/ss_thumbnails/pythonseaborn1-241222125910-e118d8f2-thumbnail.jpg?width=600ounds&width=560&fit=bounds)


