Downloaded 150 times


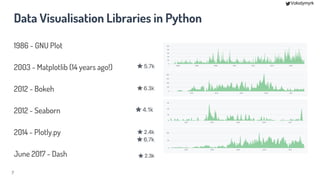
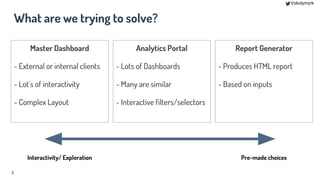
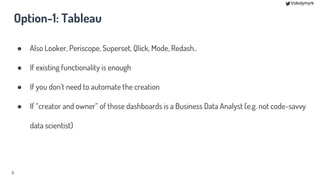
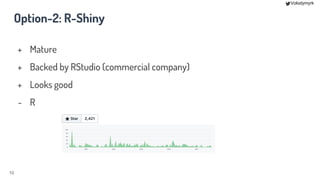


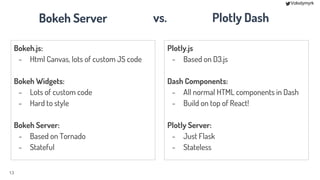

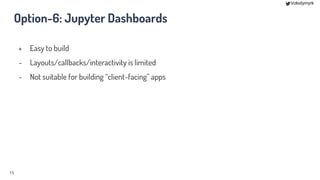
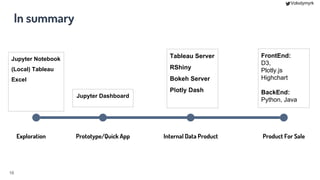


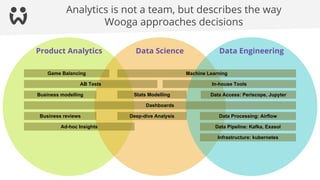
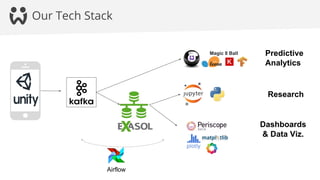


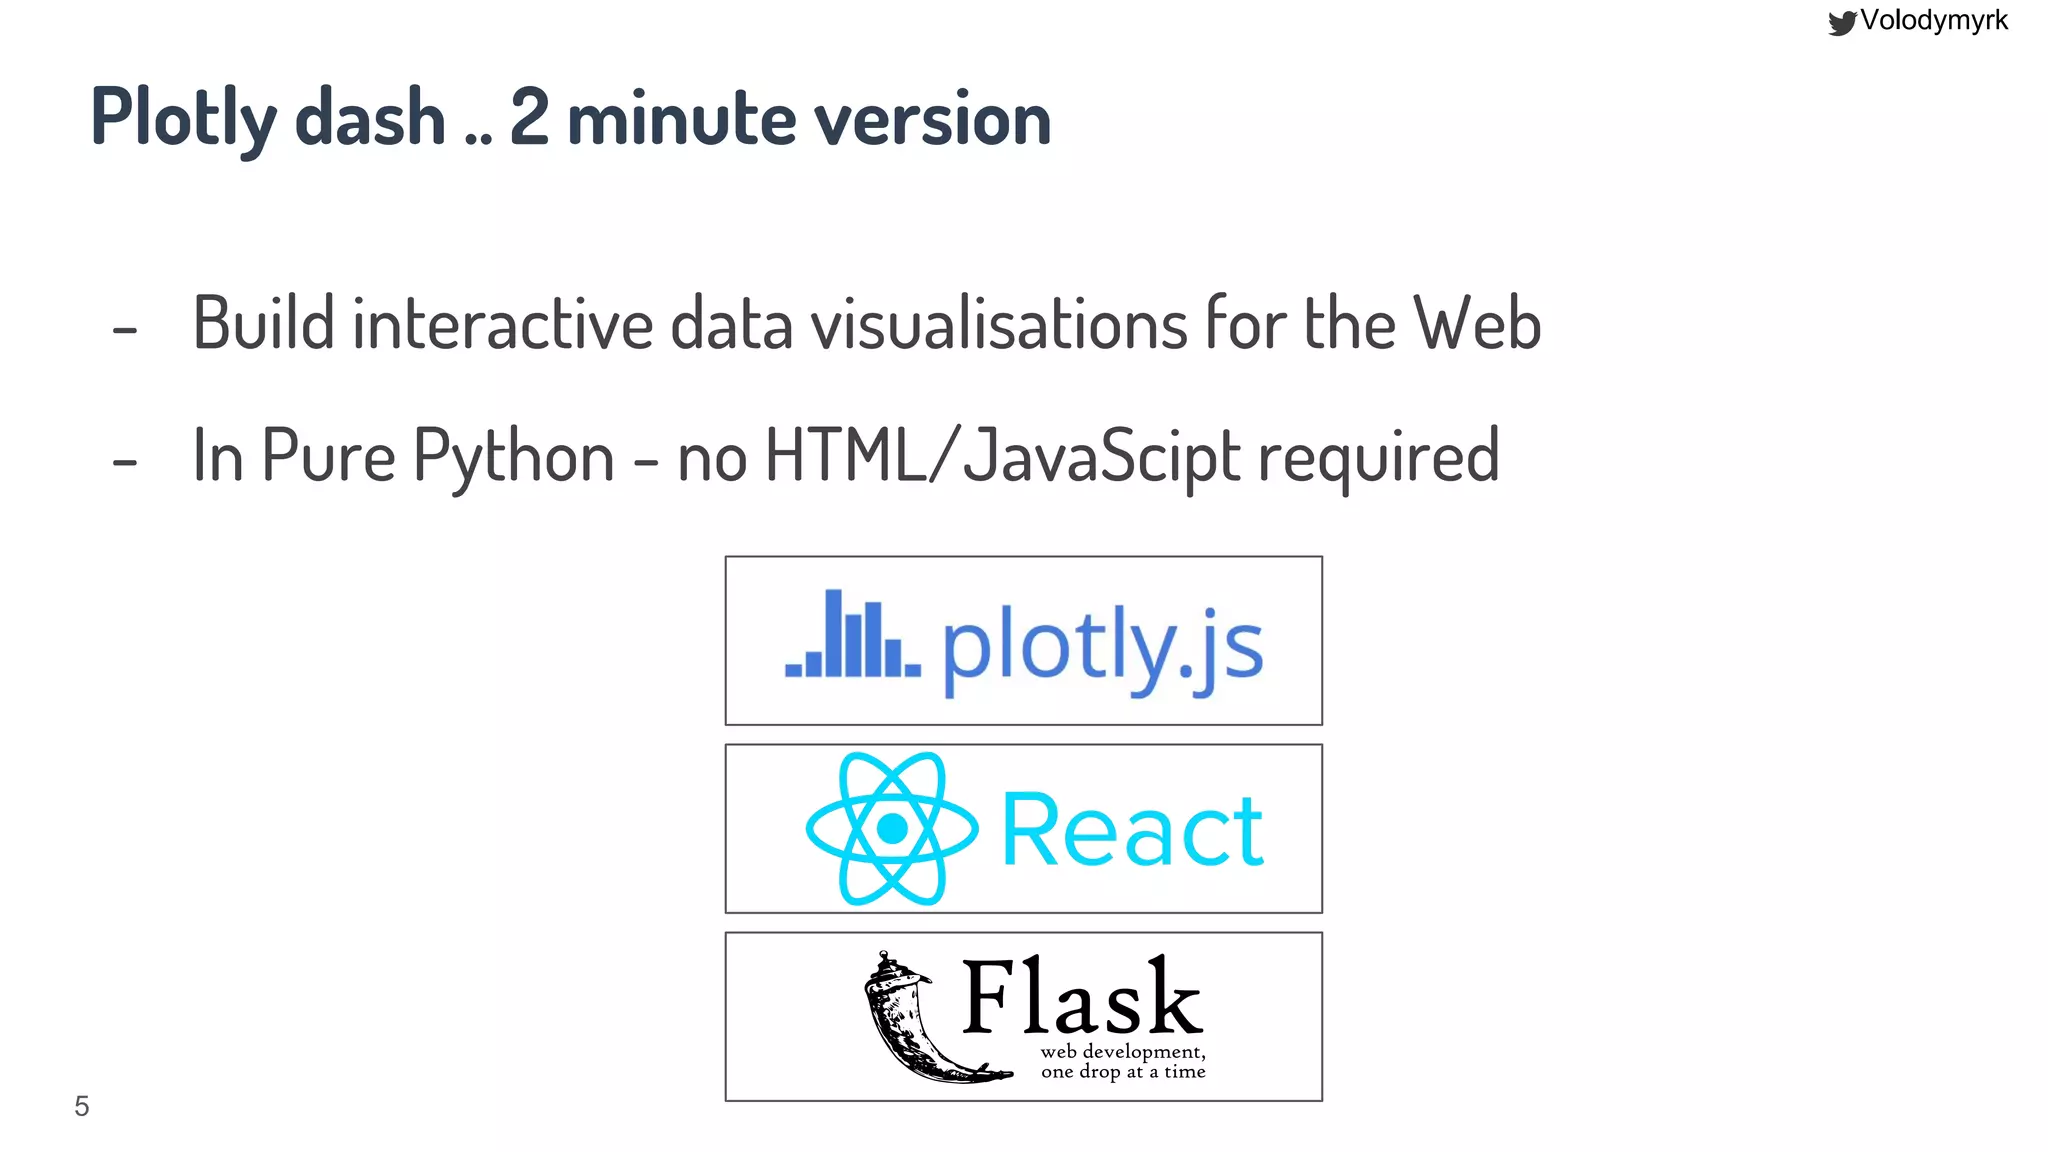

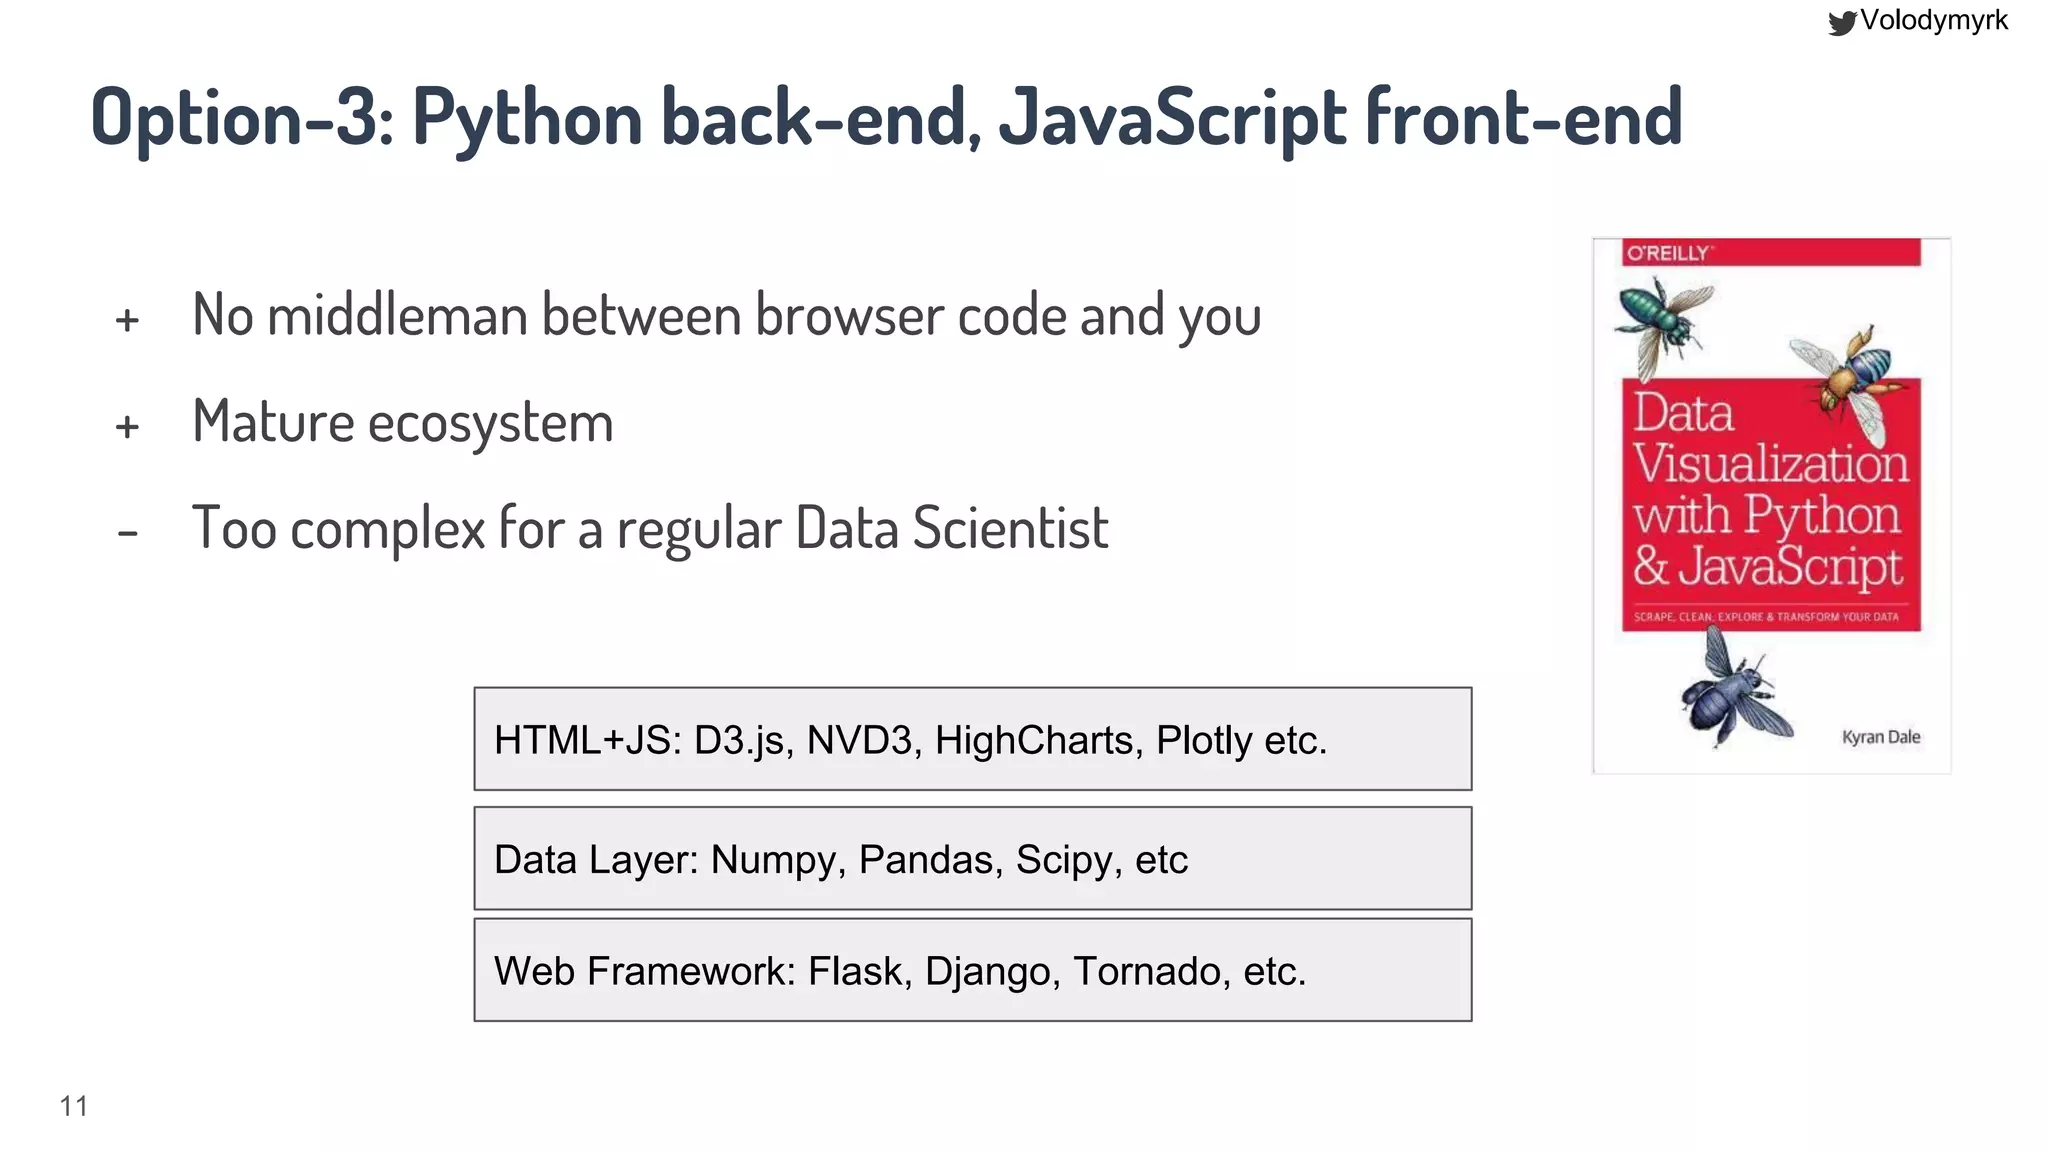
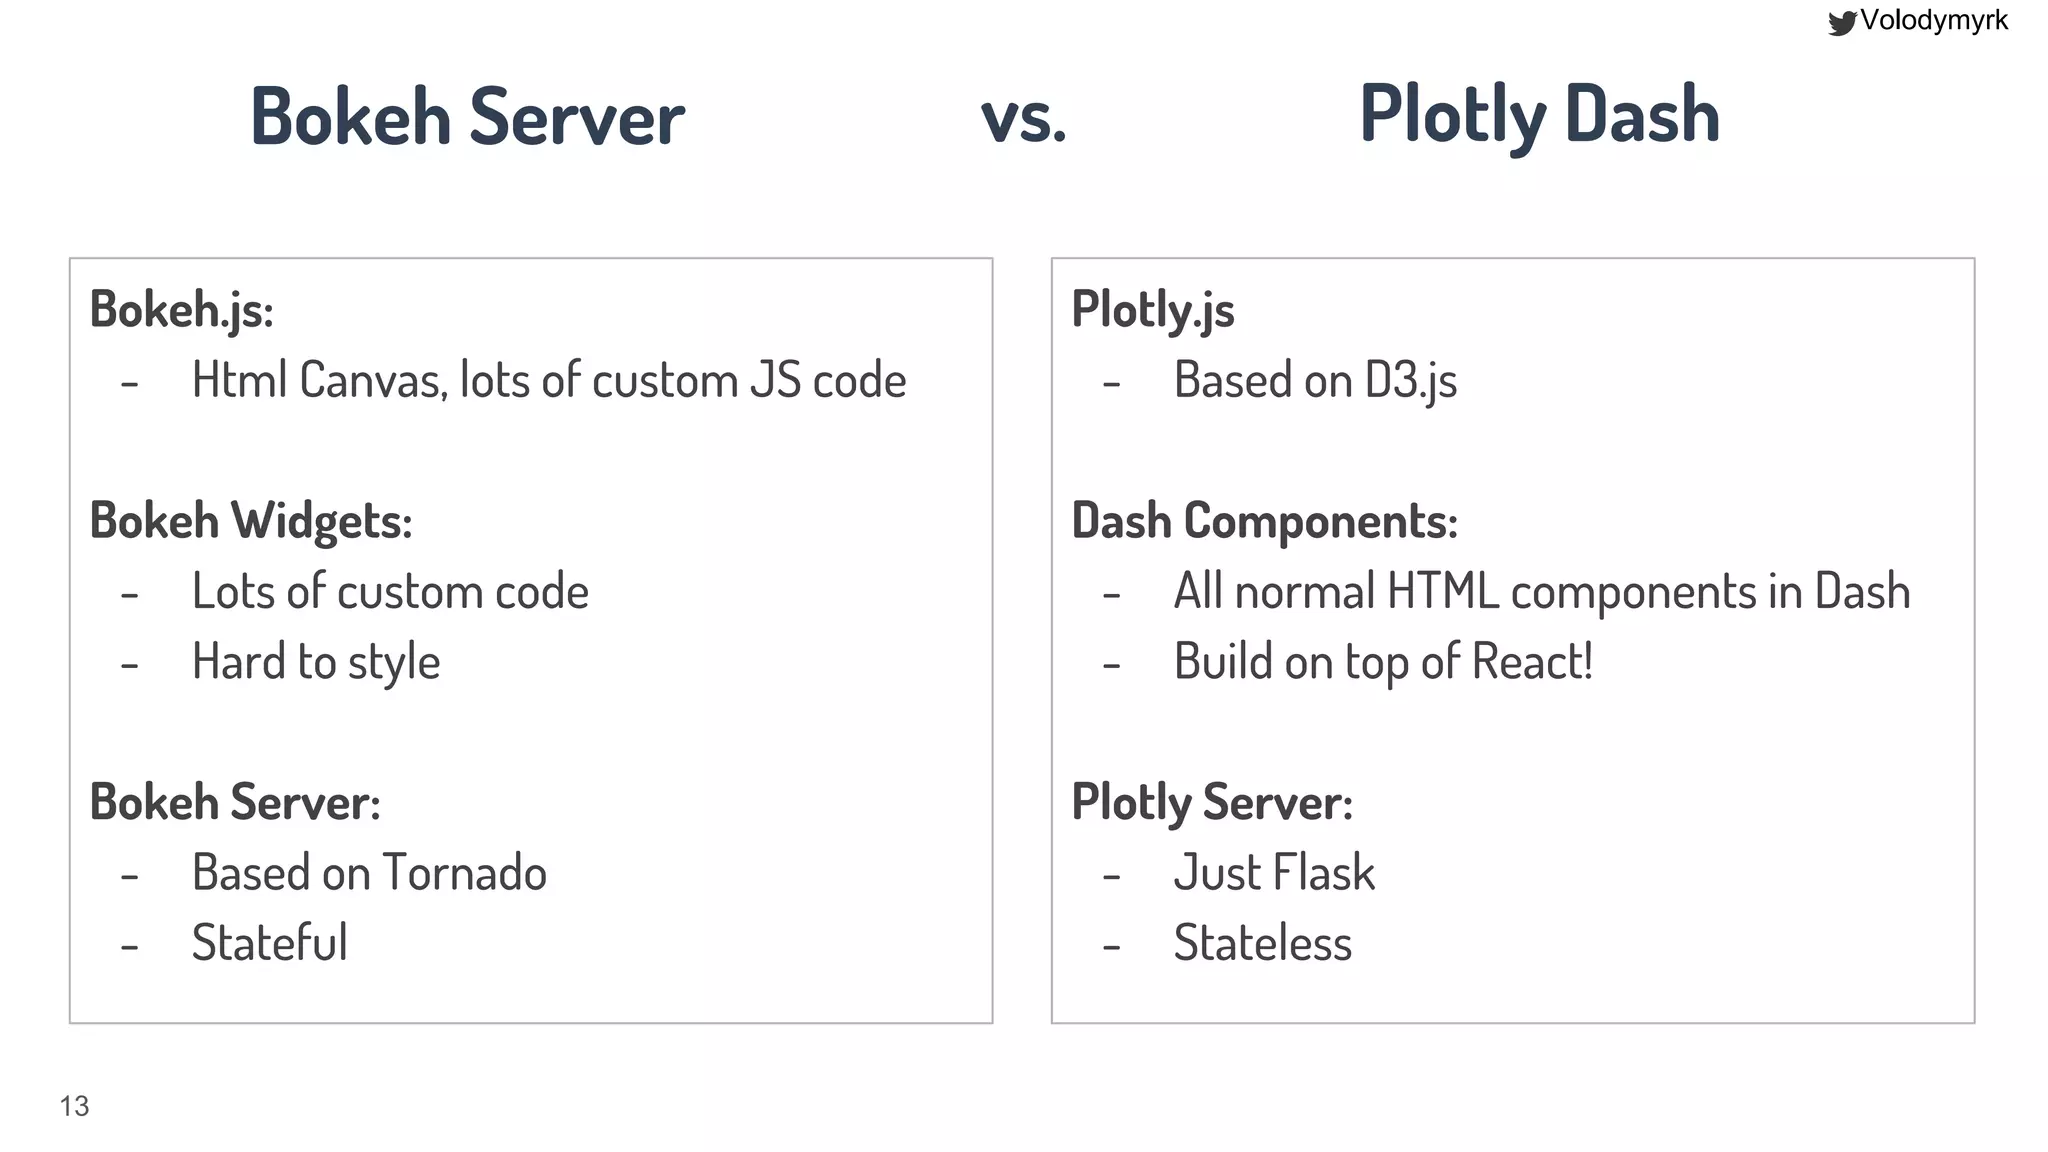
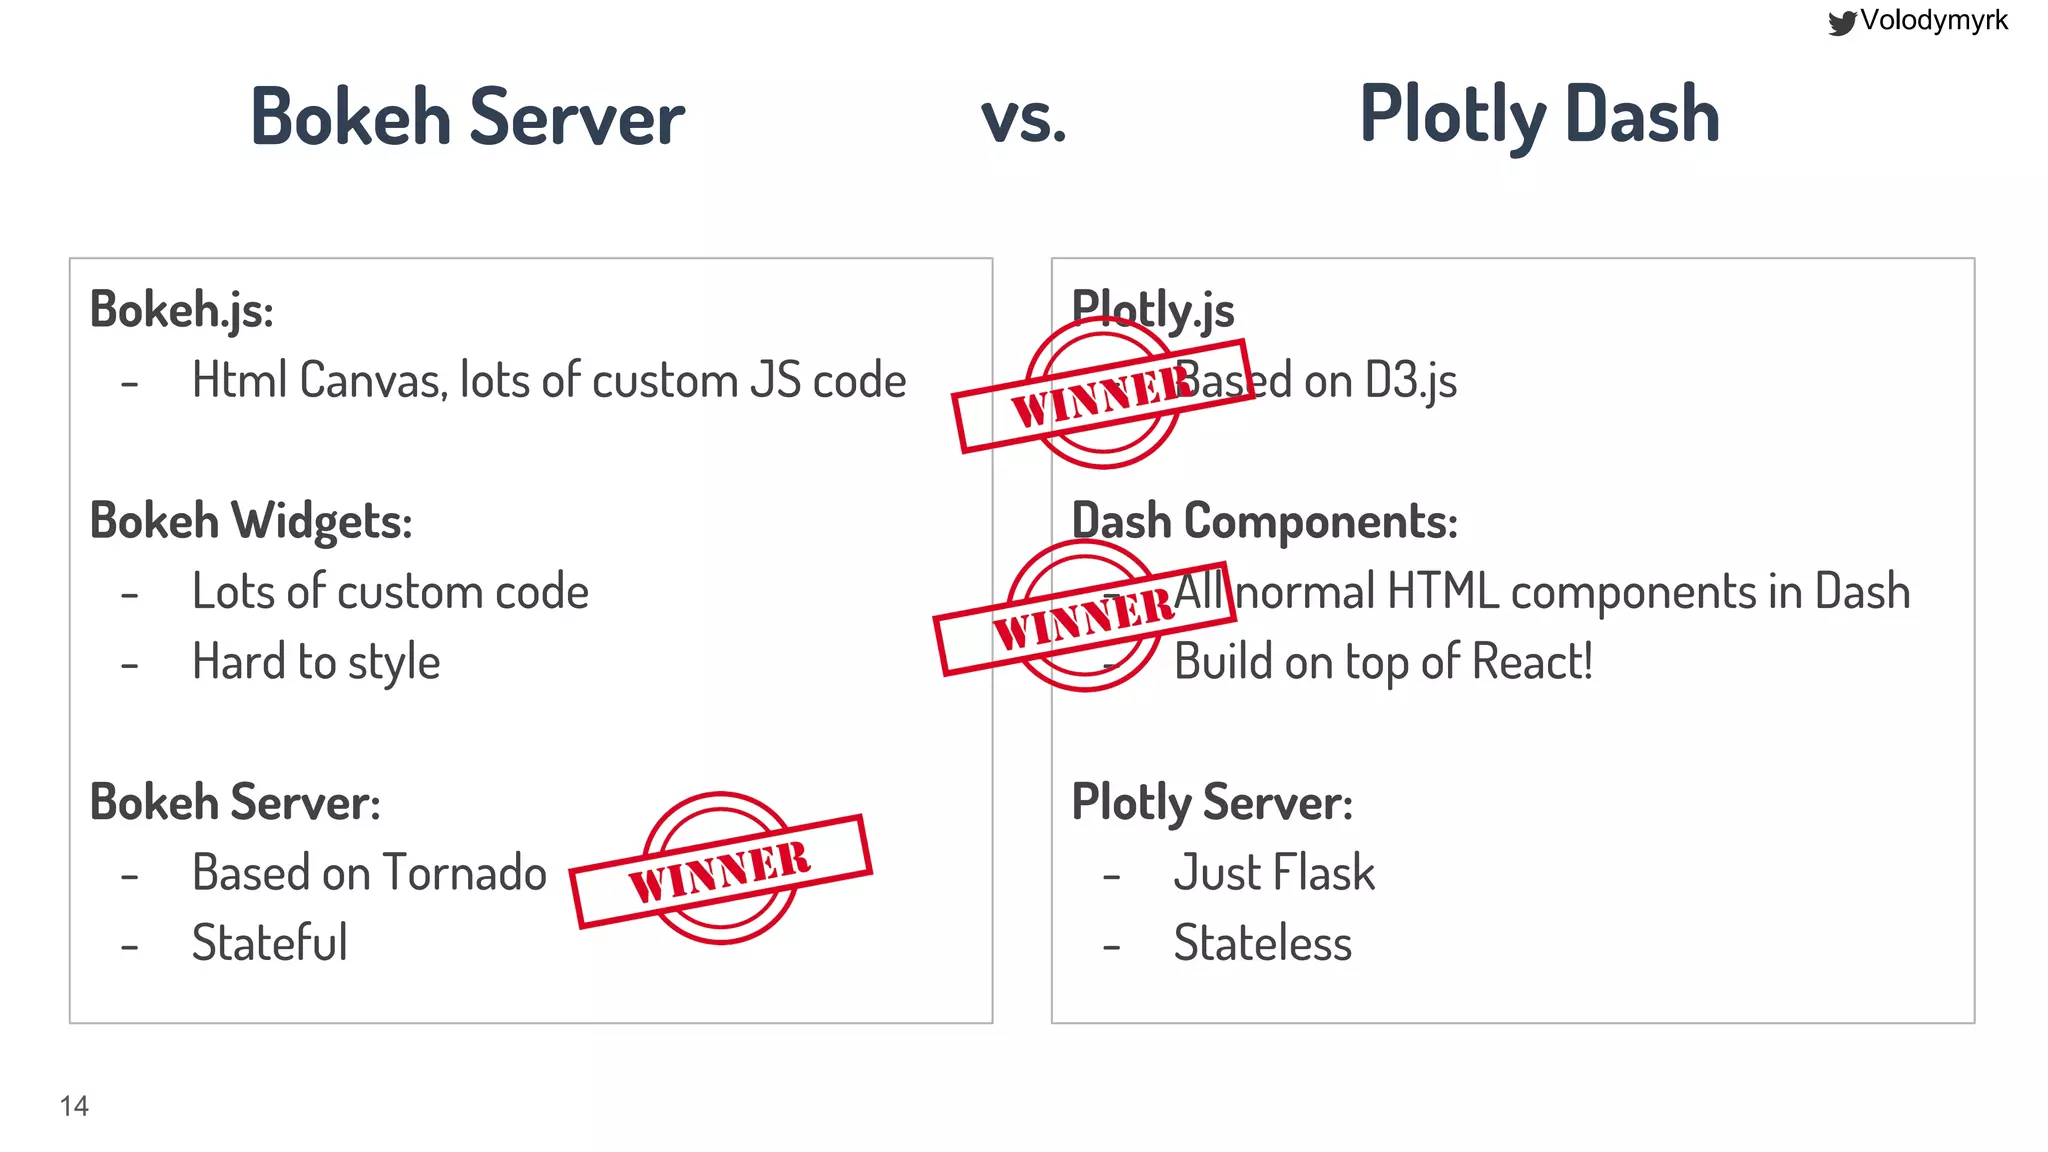


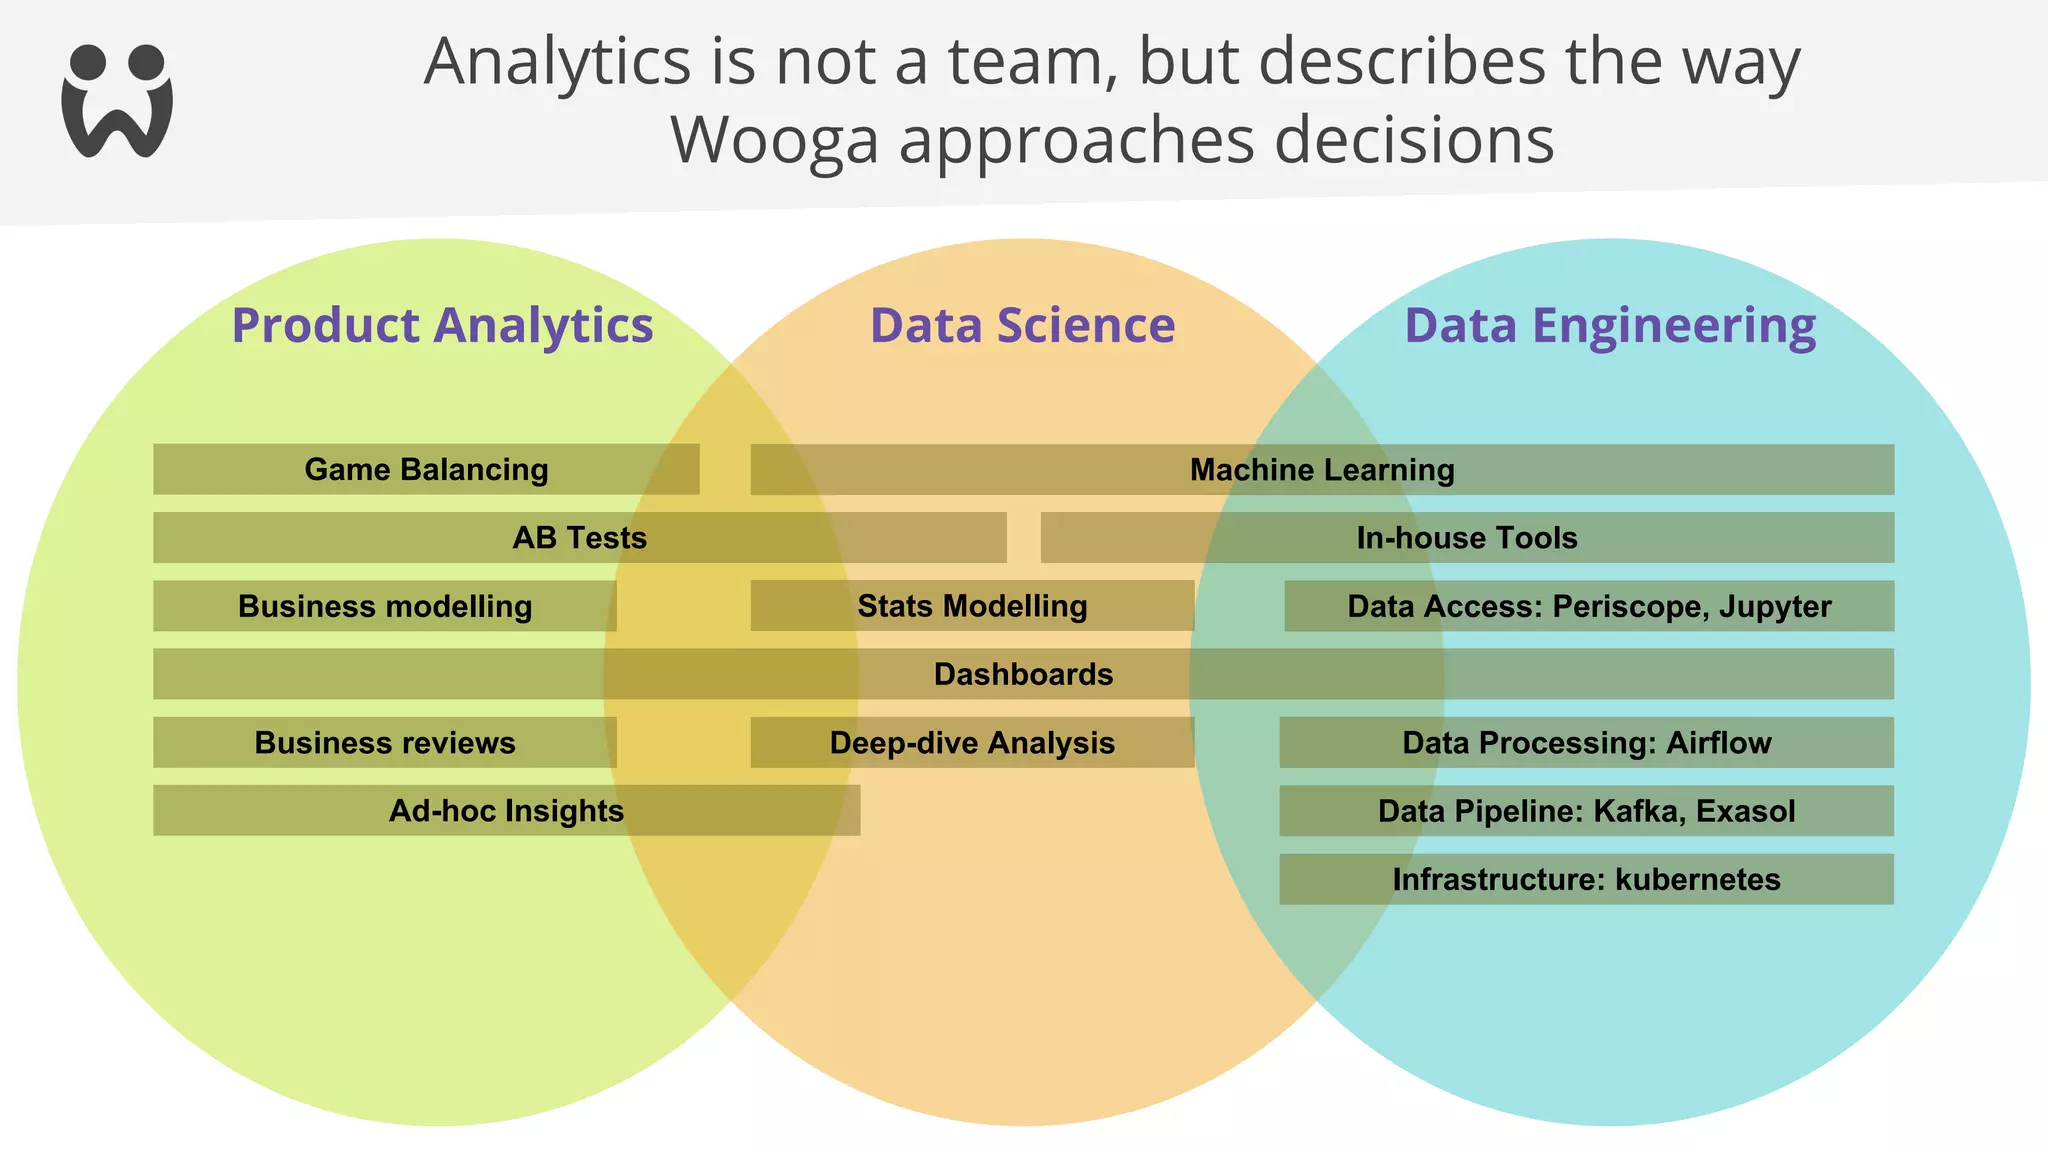
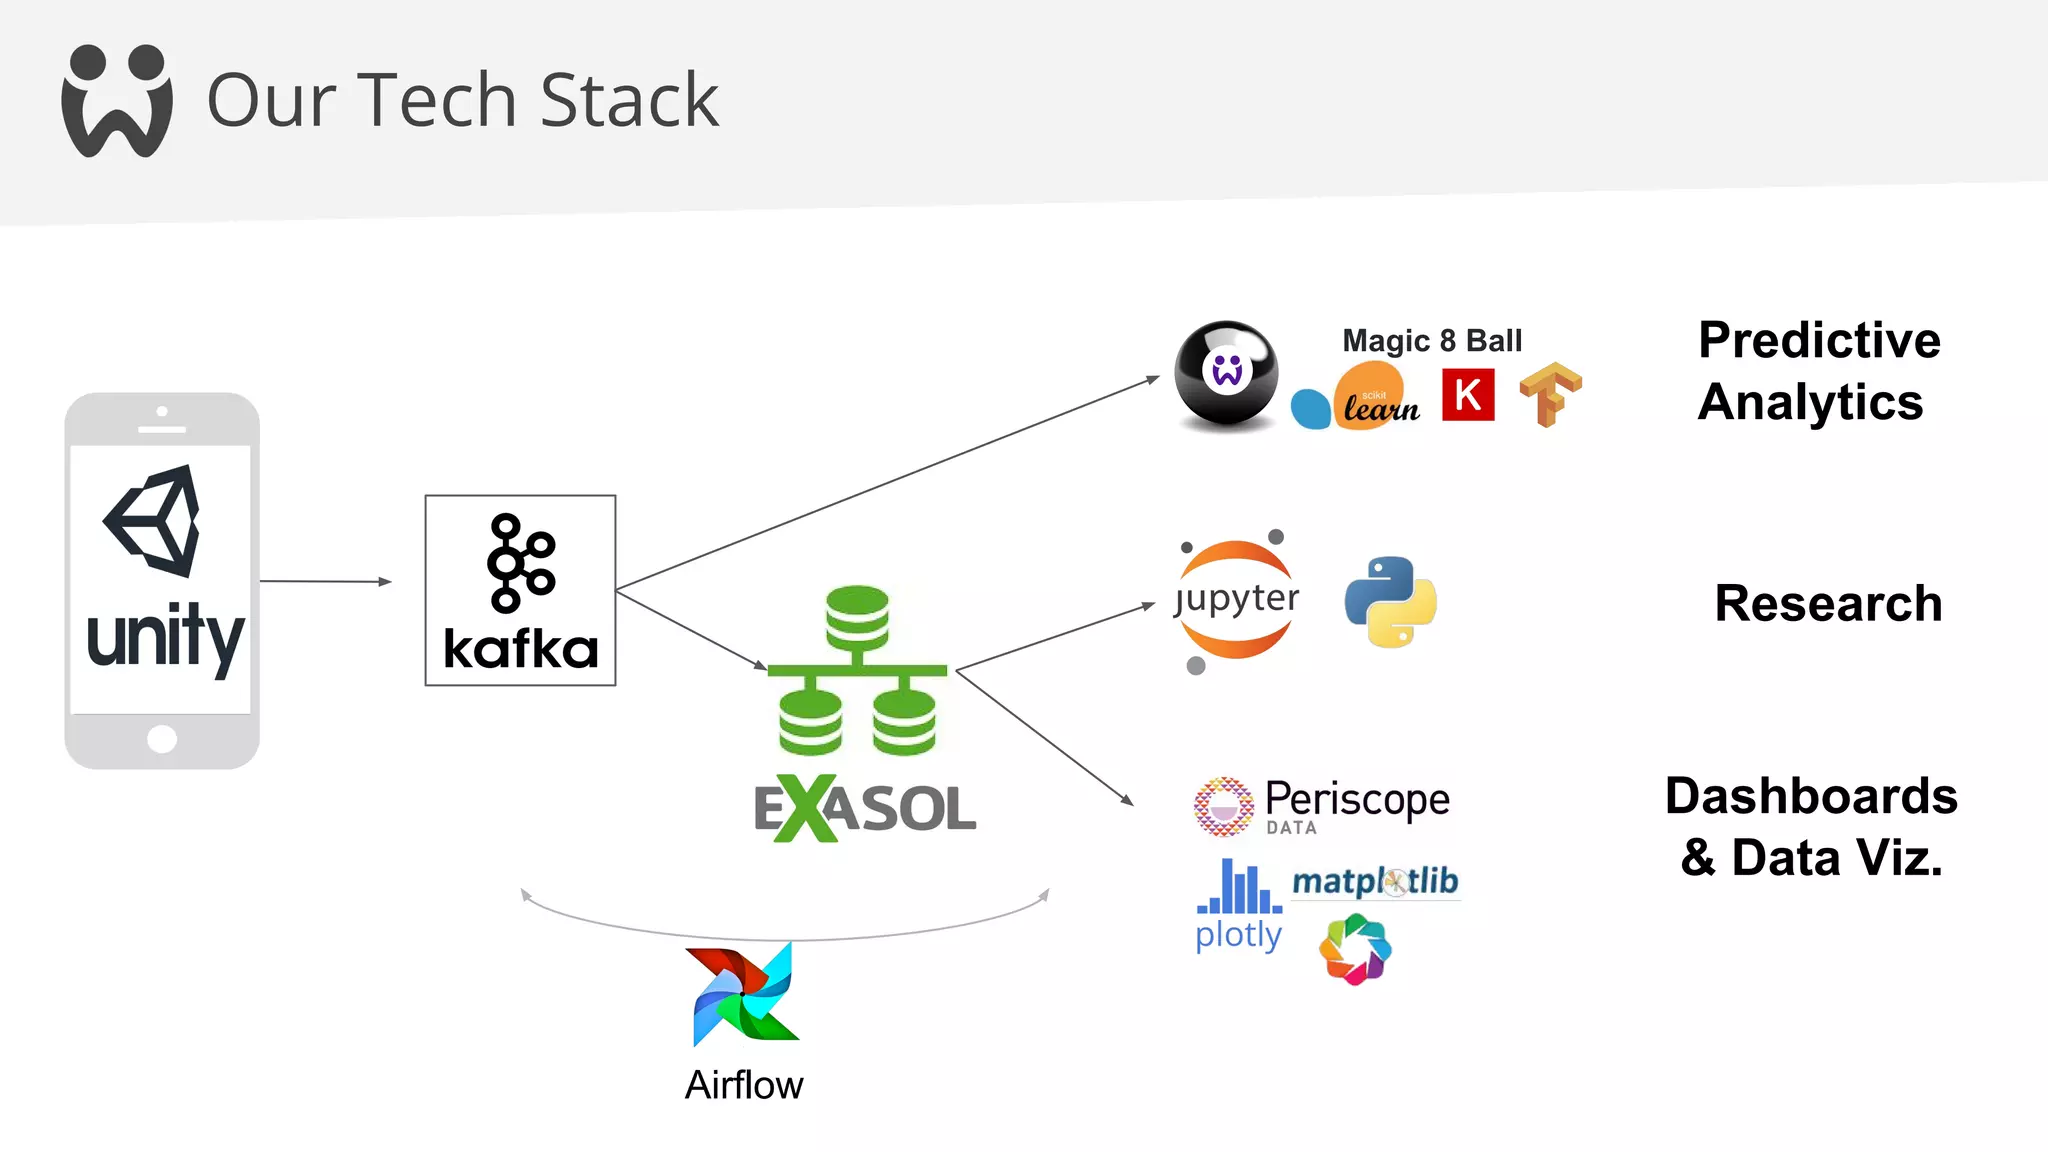

The document discusses various data visualization libraries in Python, including Plotly and Bokeh, highlighting their features and use cases. It compares different options for building interactive dashboards, such as Tableau, R-Shiny, and Python-based solutions, emphasizing the complexity and suitability for non-coders. Additionally, it offers tips for developing data-driven applications and outlines roles and tools in the data analytics landscape at Wooga.


![UiPath Automation Suite Installation (Hands-On) [2/3]](https://cdn.slidesharecdn.com/ss_thumbnails/automationsuitecommunitysession2-251015095633-a6d862f1-thumbnail.jpg?width=600ounds&width=560&fit=bounds)


