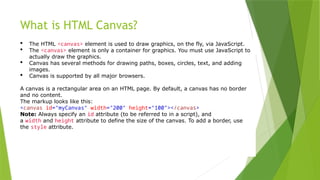
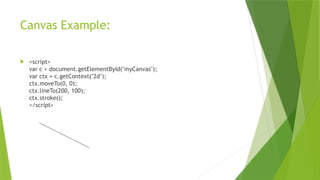
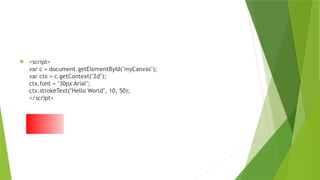
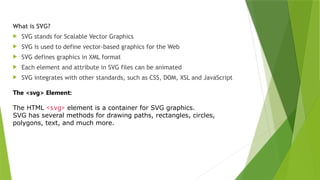
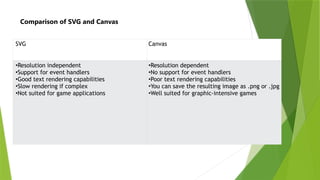
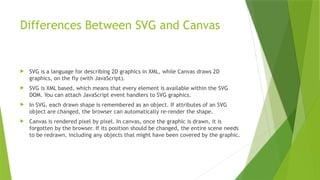
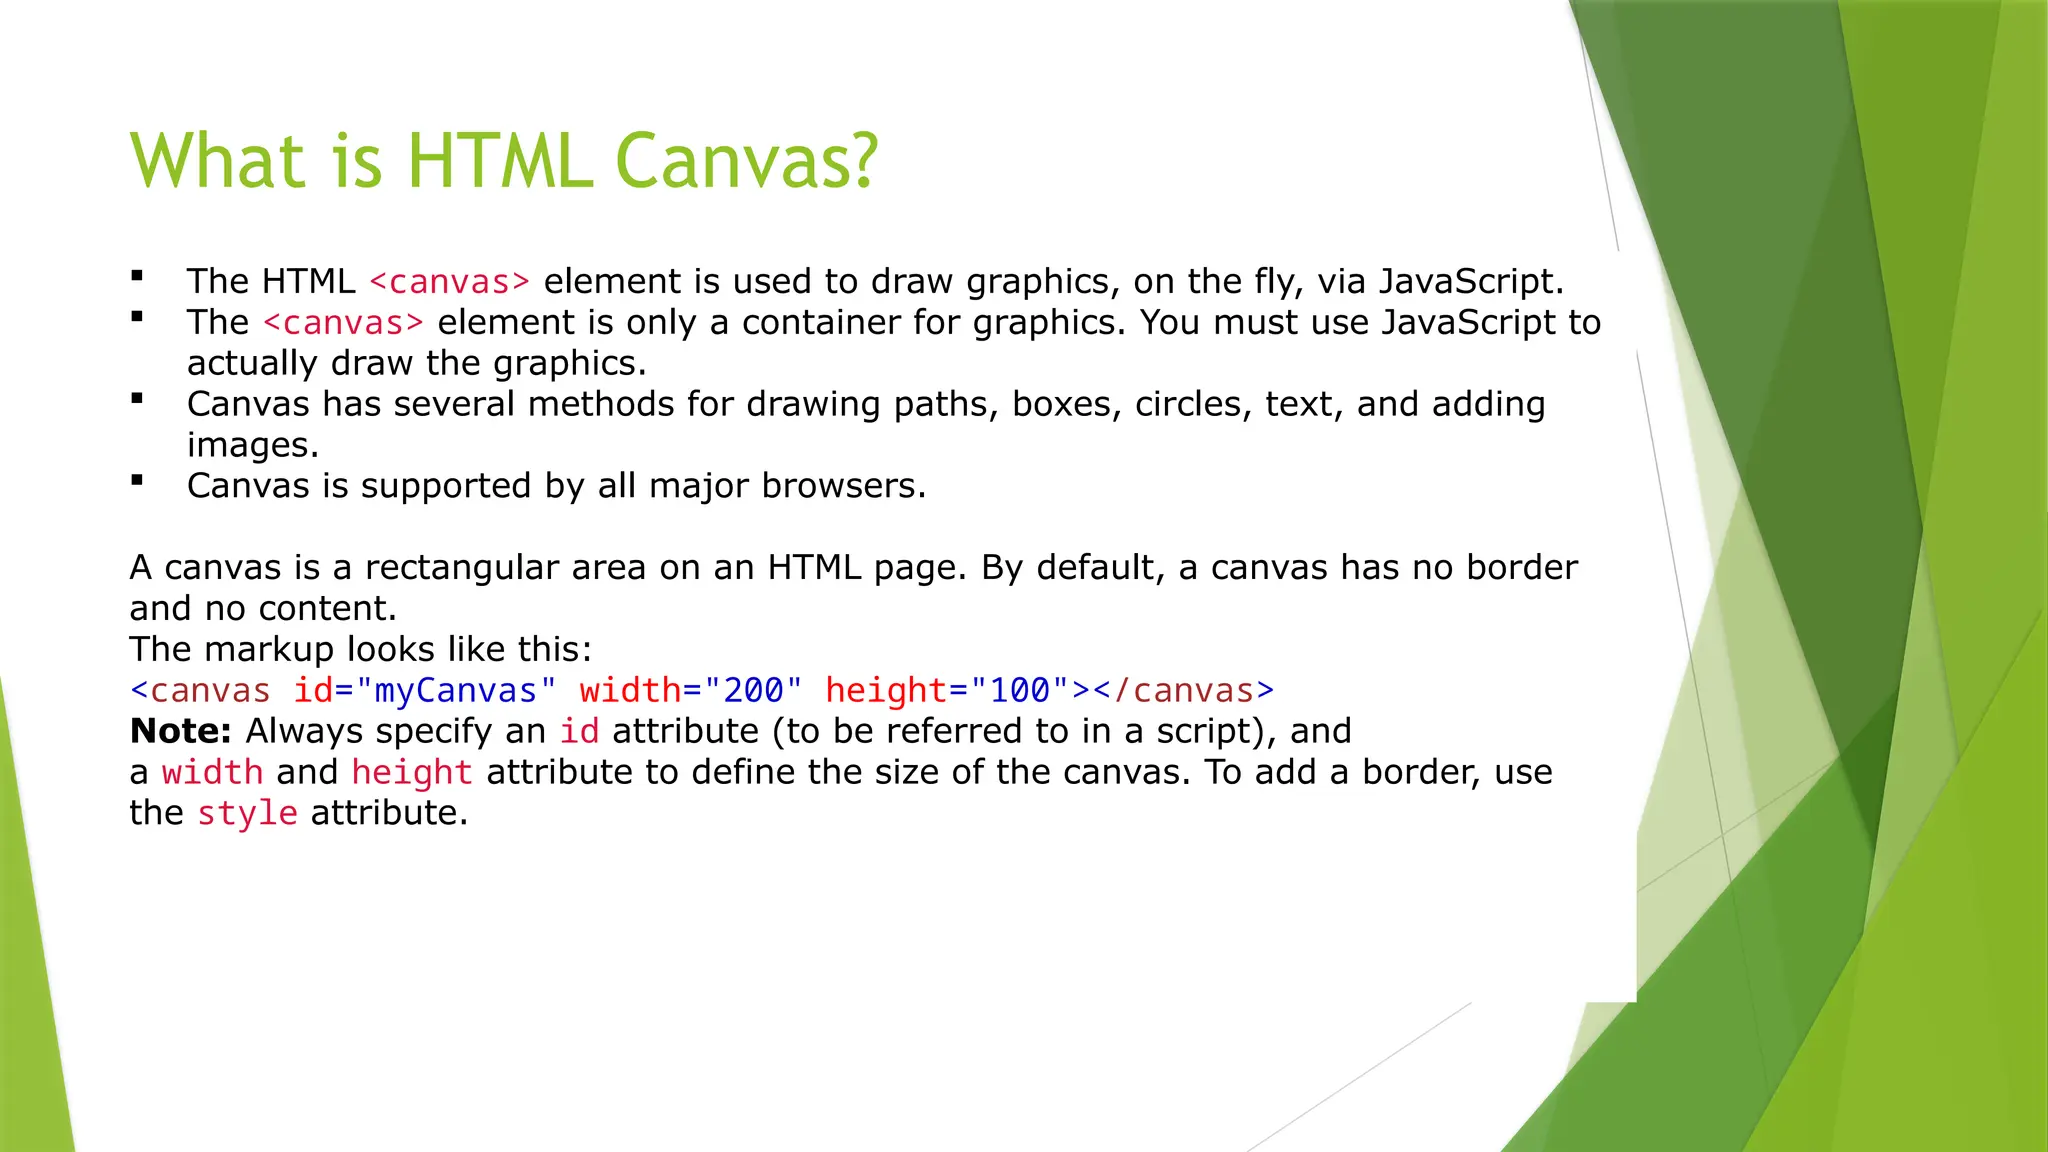
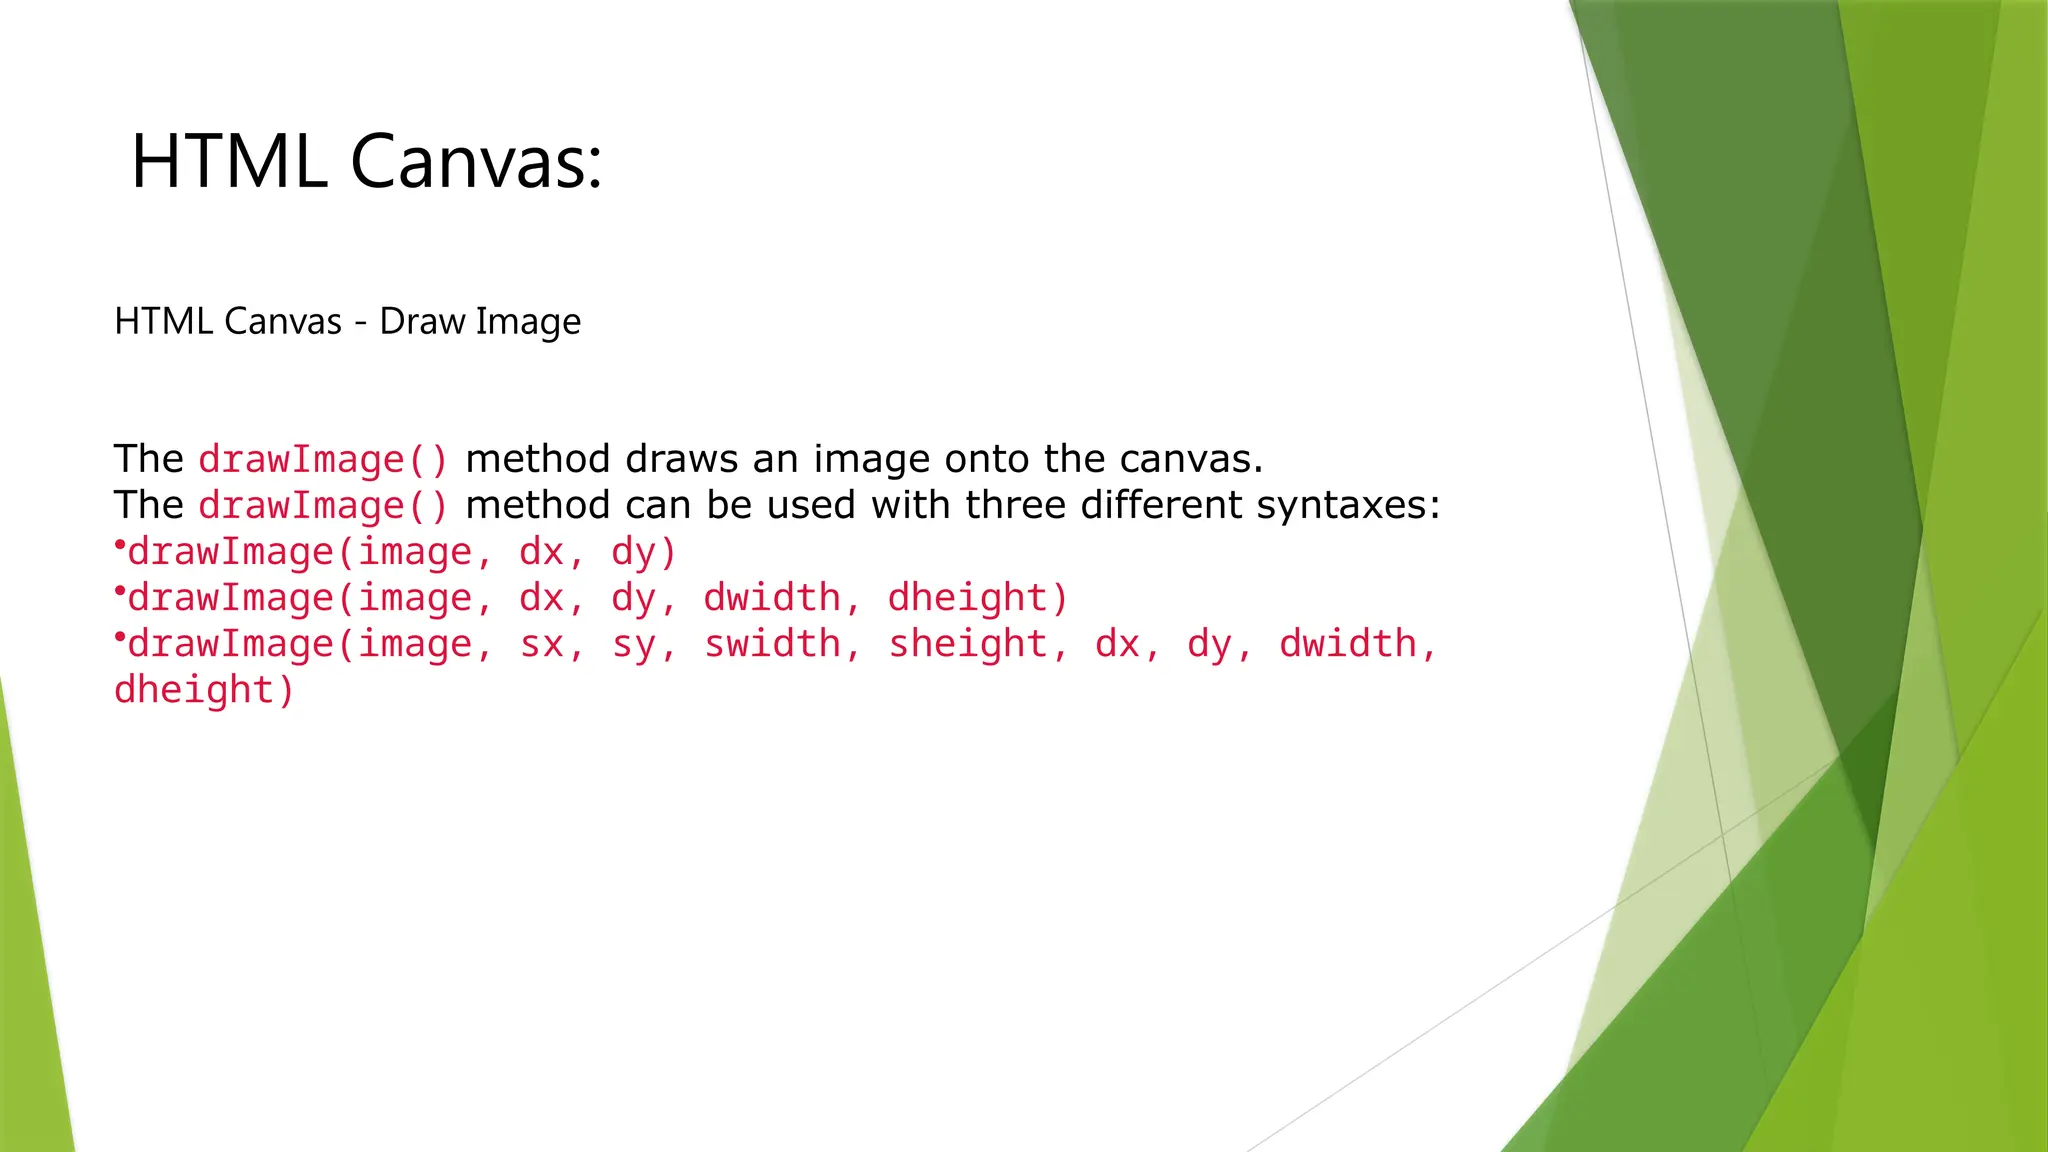
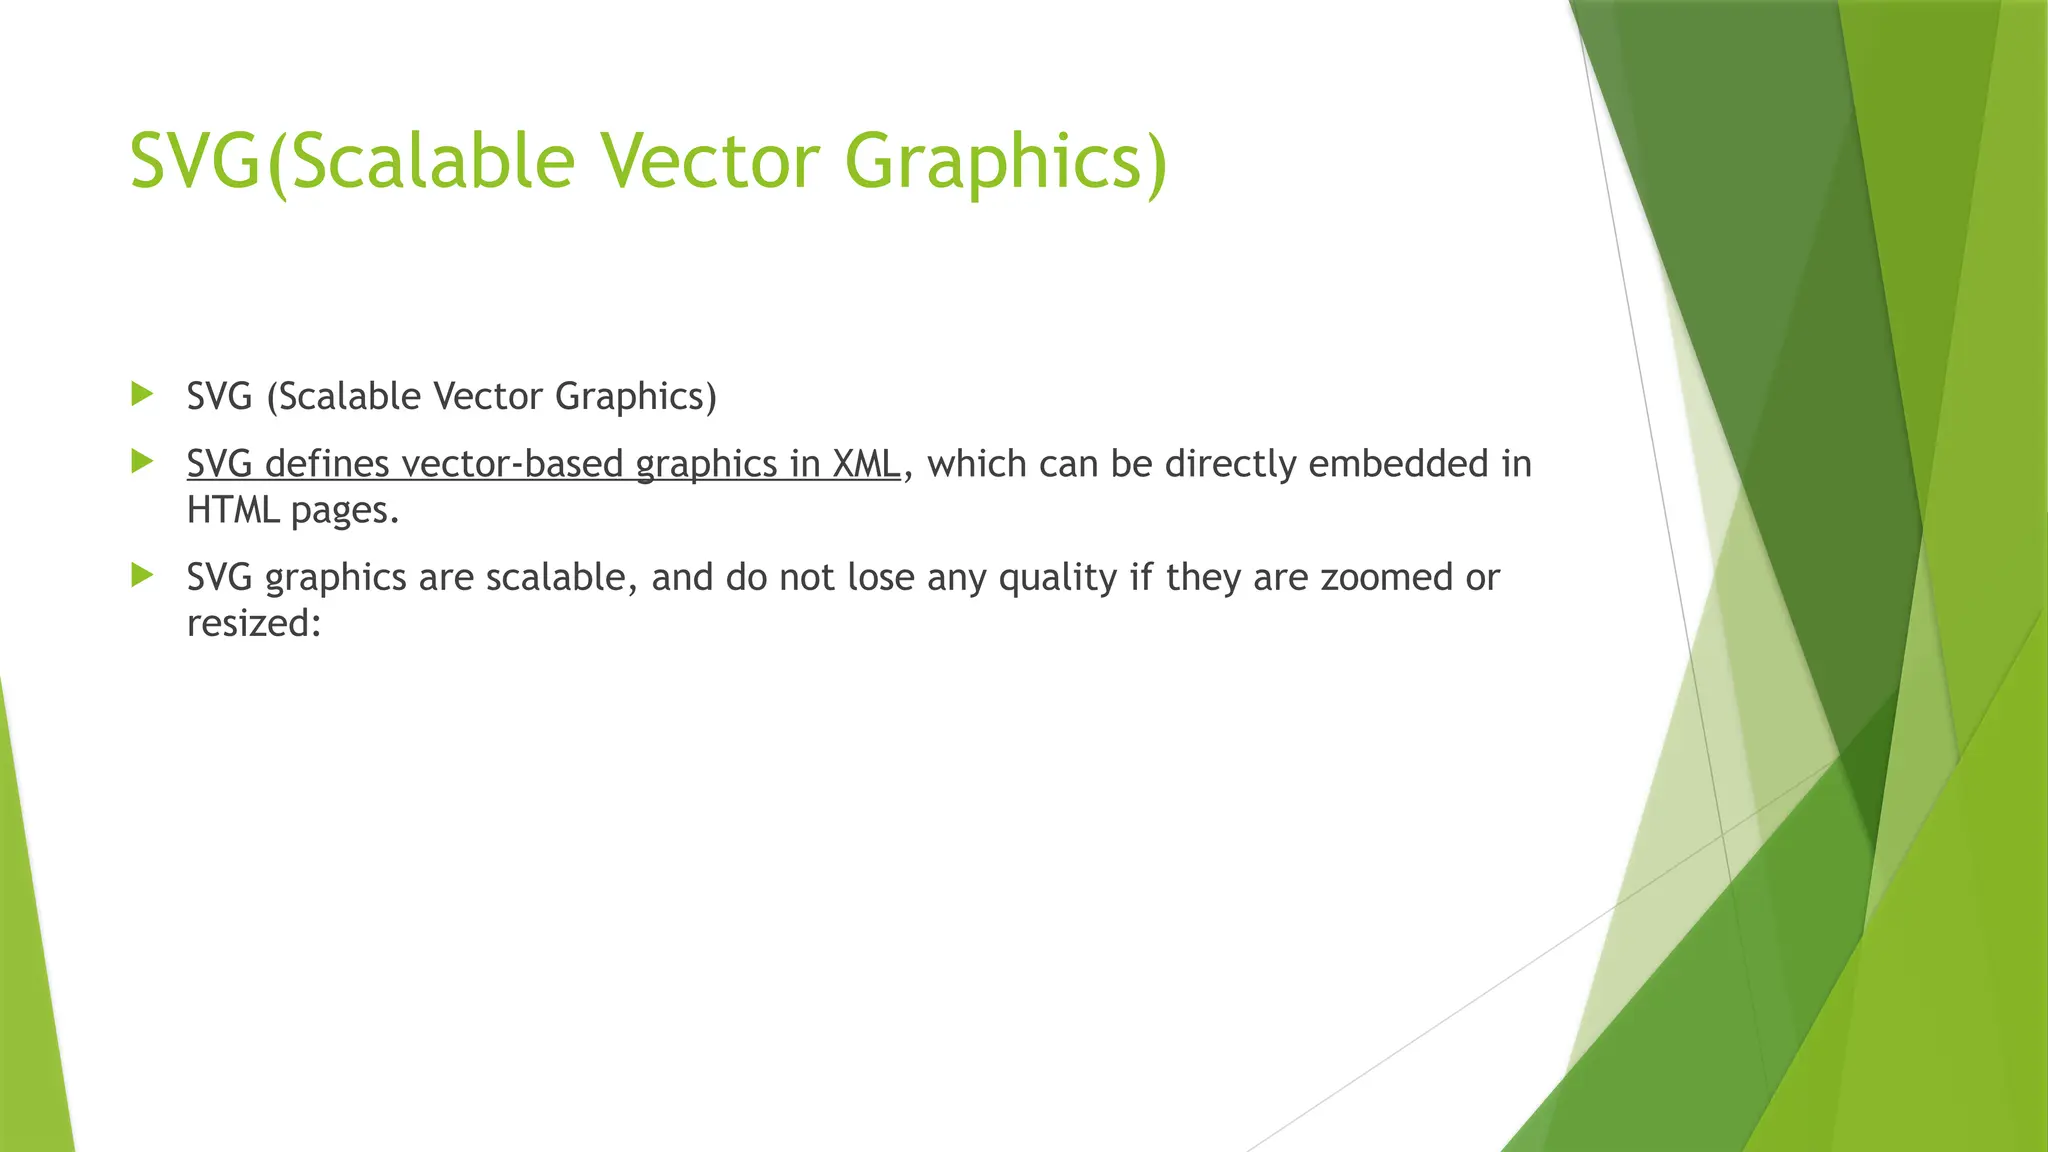
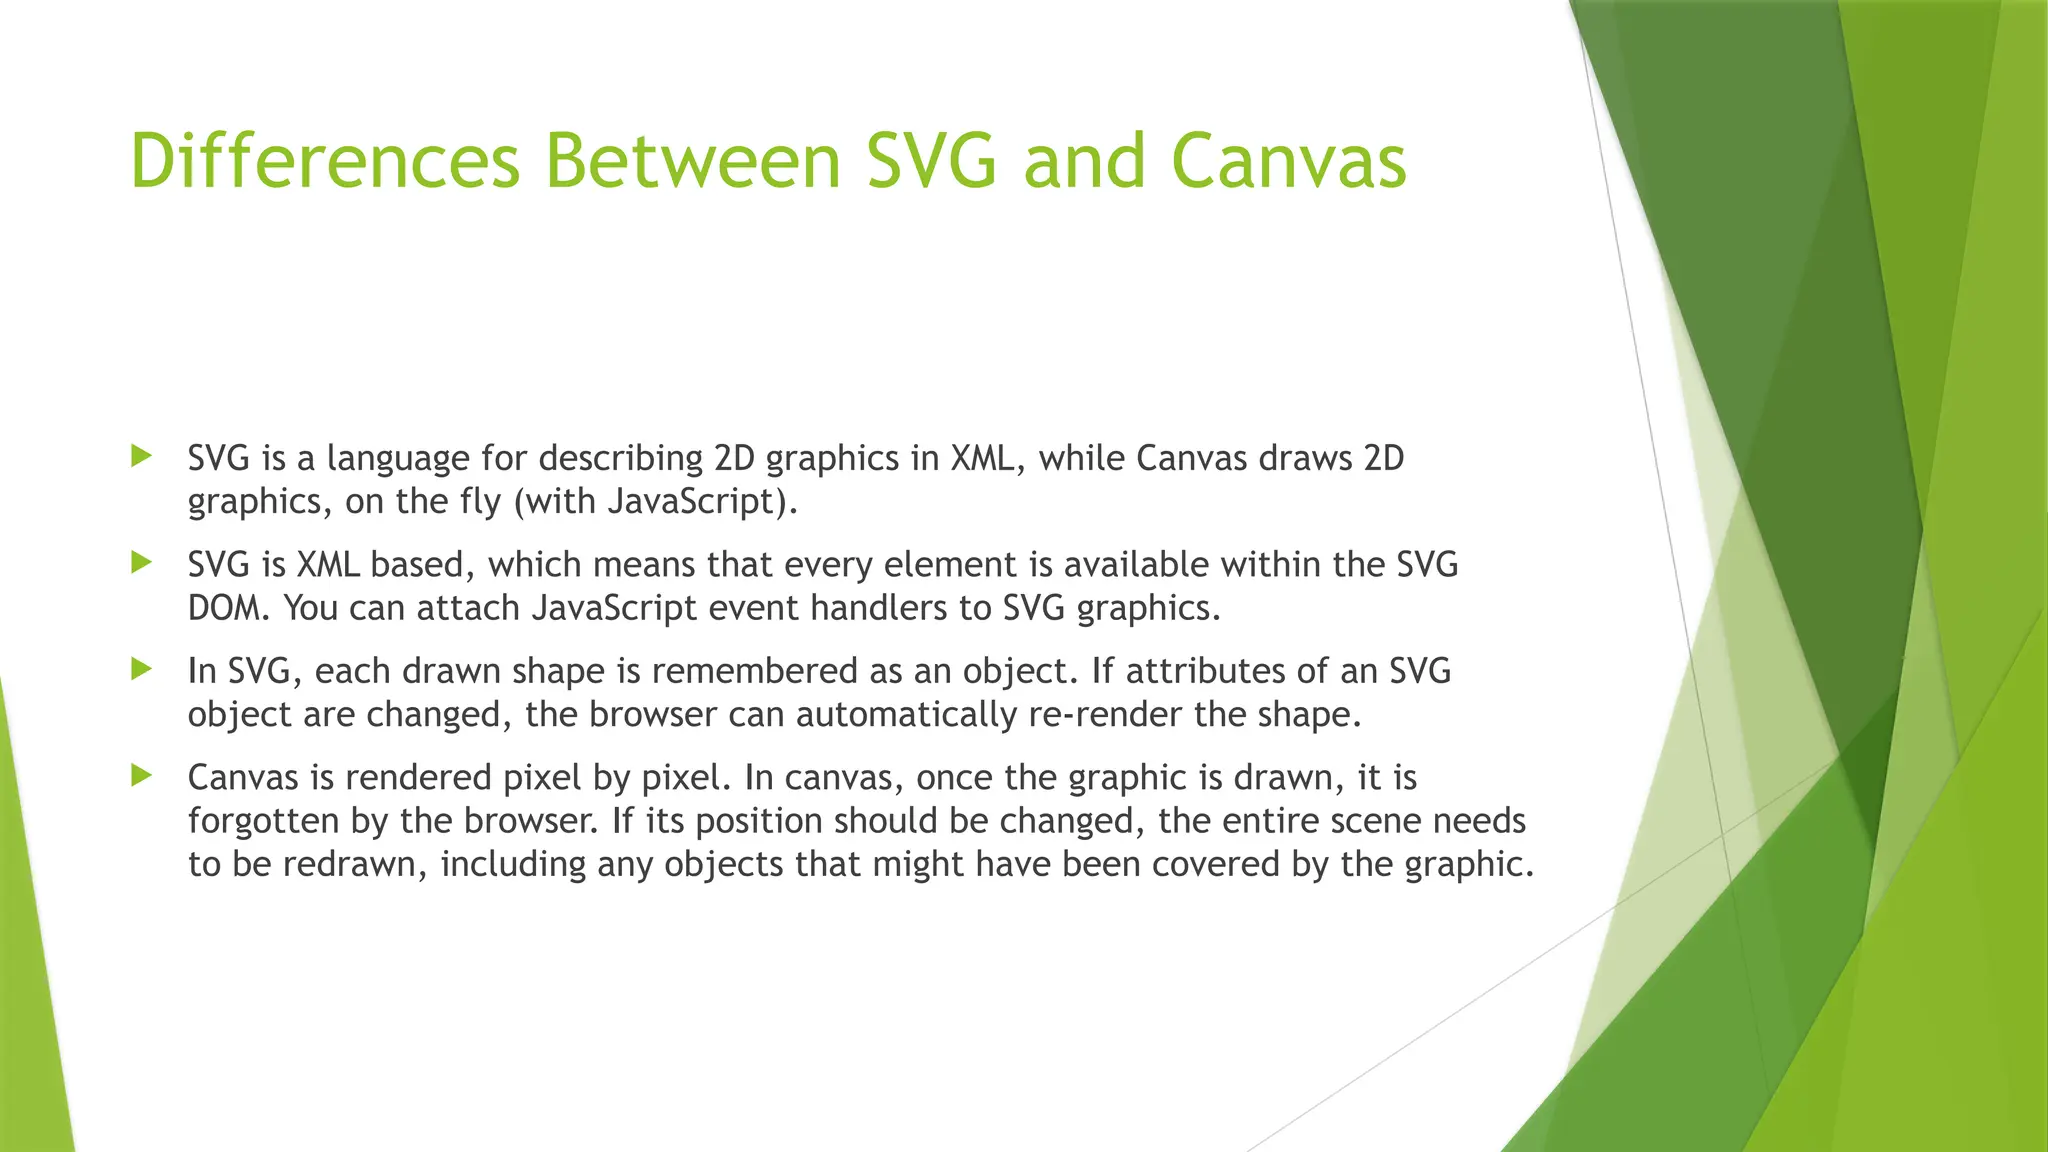
The document discusses the HTML <canvas> element used to draw graphics on web pages using JavaScript, detailing its methods for drawing shapes, images, and animations. It explains the differences between the <canvas> and SVG (Scalable Vector Graphics) elements, emphasizing that canvas is pixel-based and provides dynamic graphics while SVG is XML-based and retains shape attributes for re-rendering. Additionally, it introduces RGraph, a JavaScript library for creating charts and graphs utilizing both HTML5 canvas and SVG technologies.