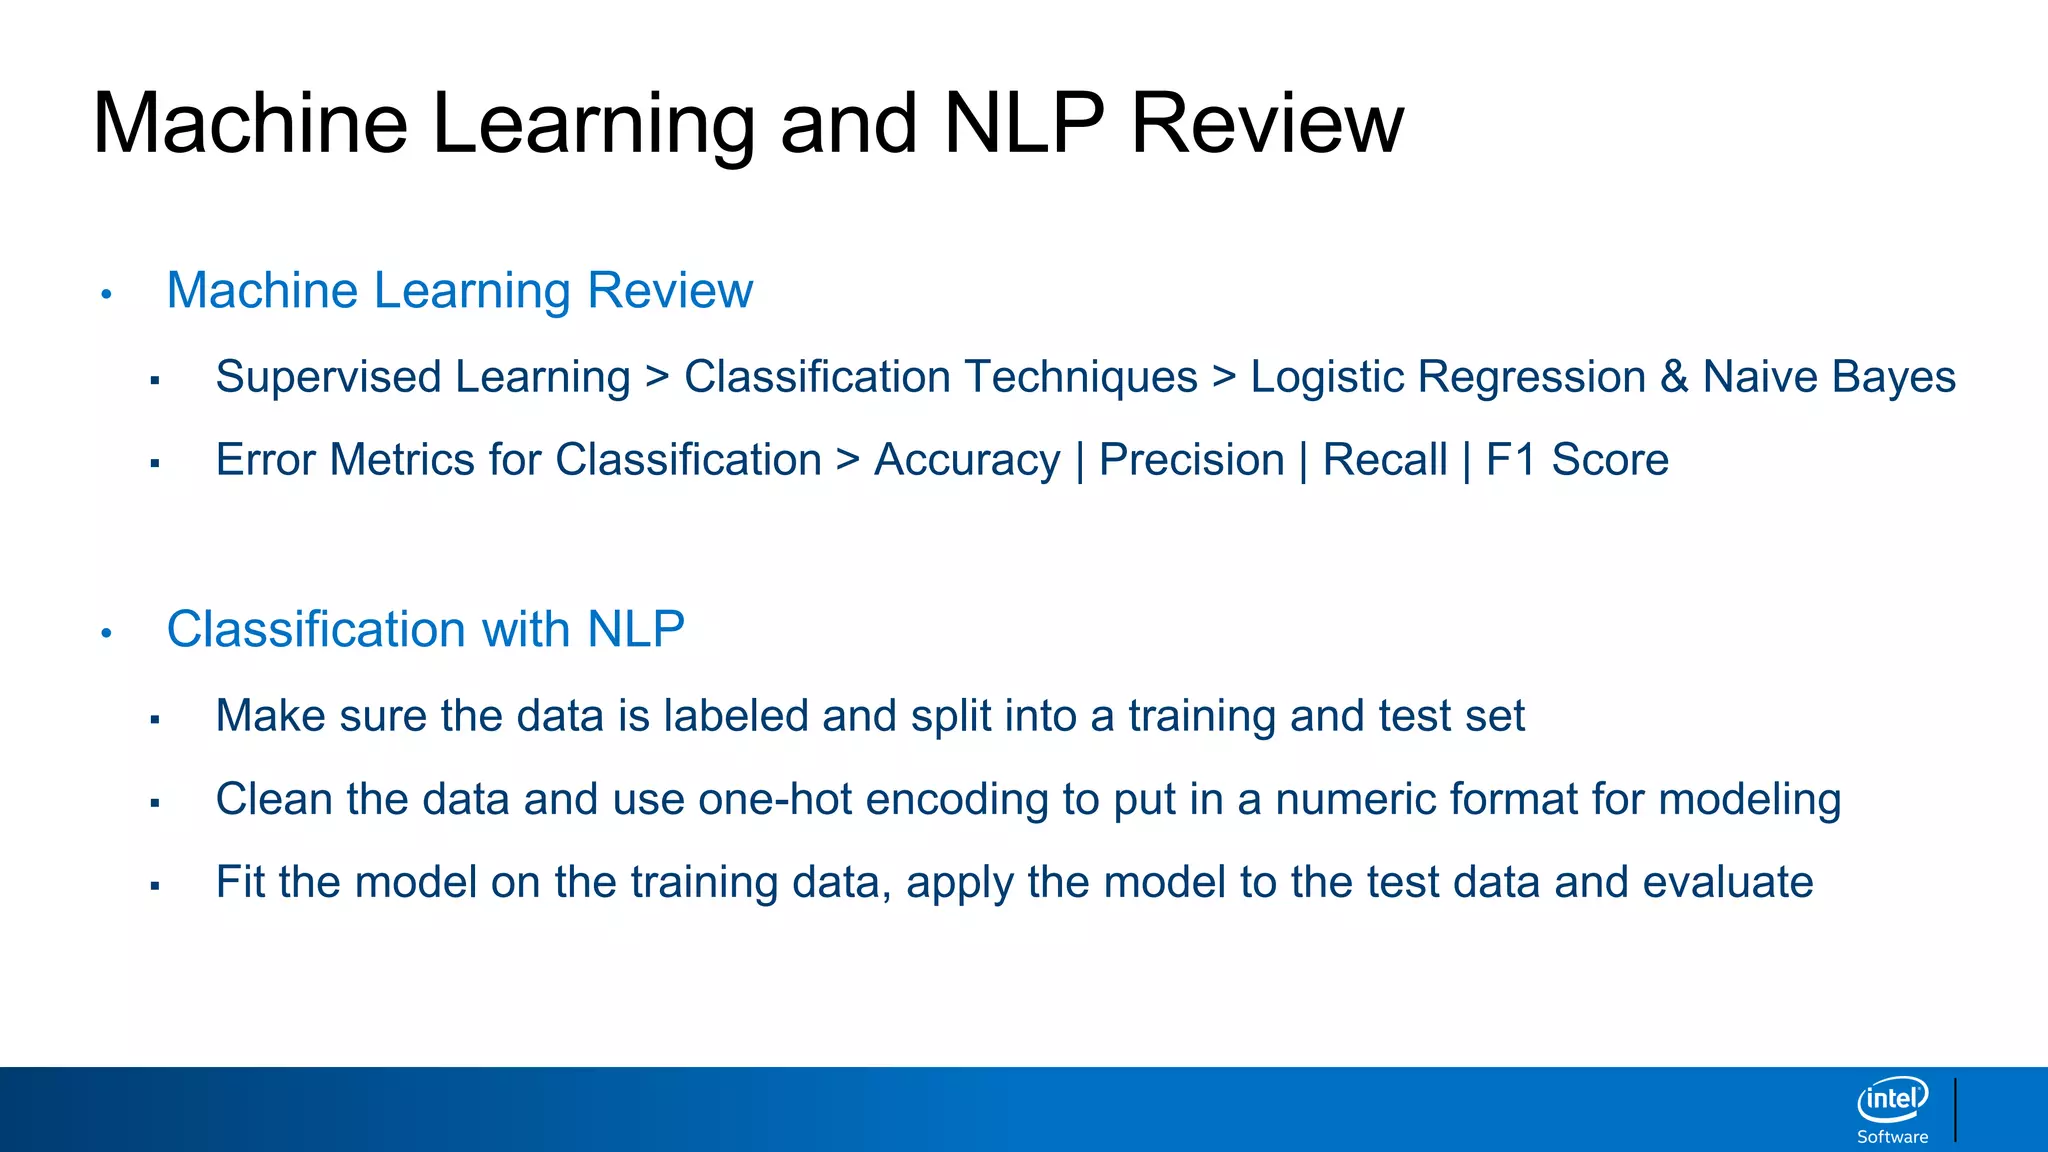
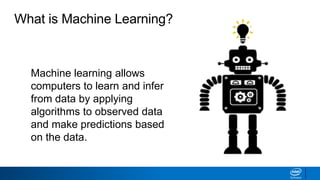
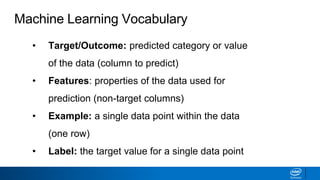
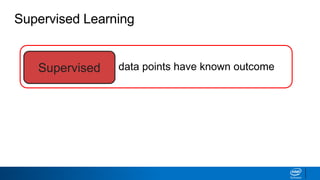
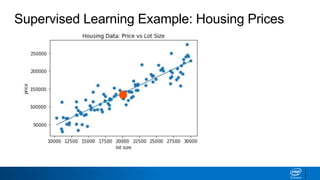
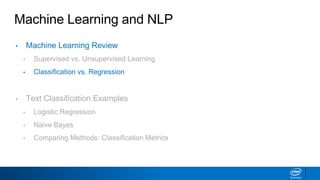
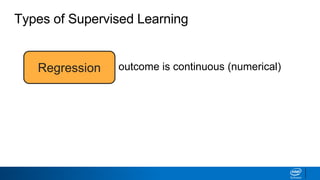
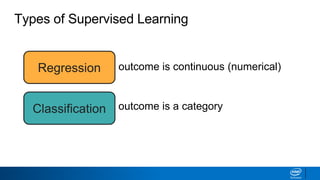
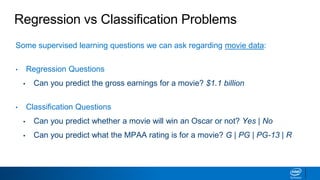
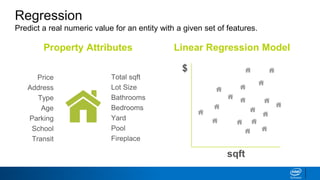
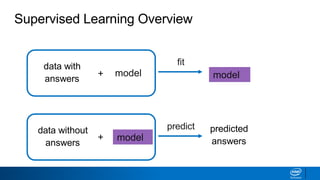
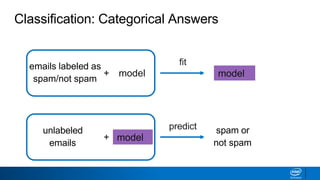
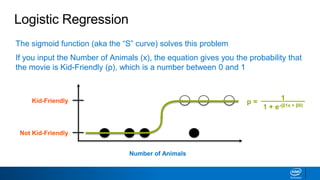
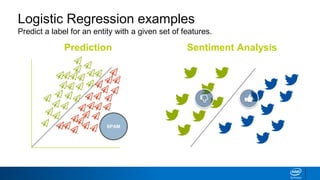
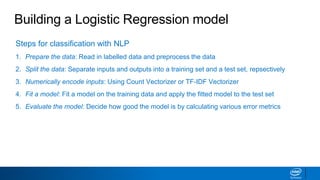
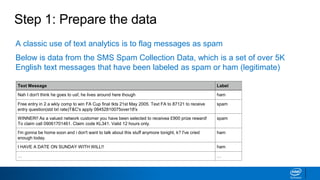
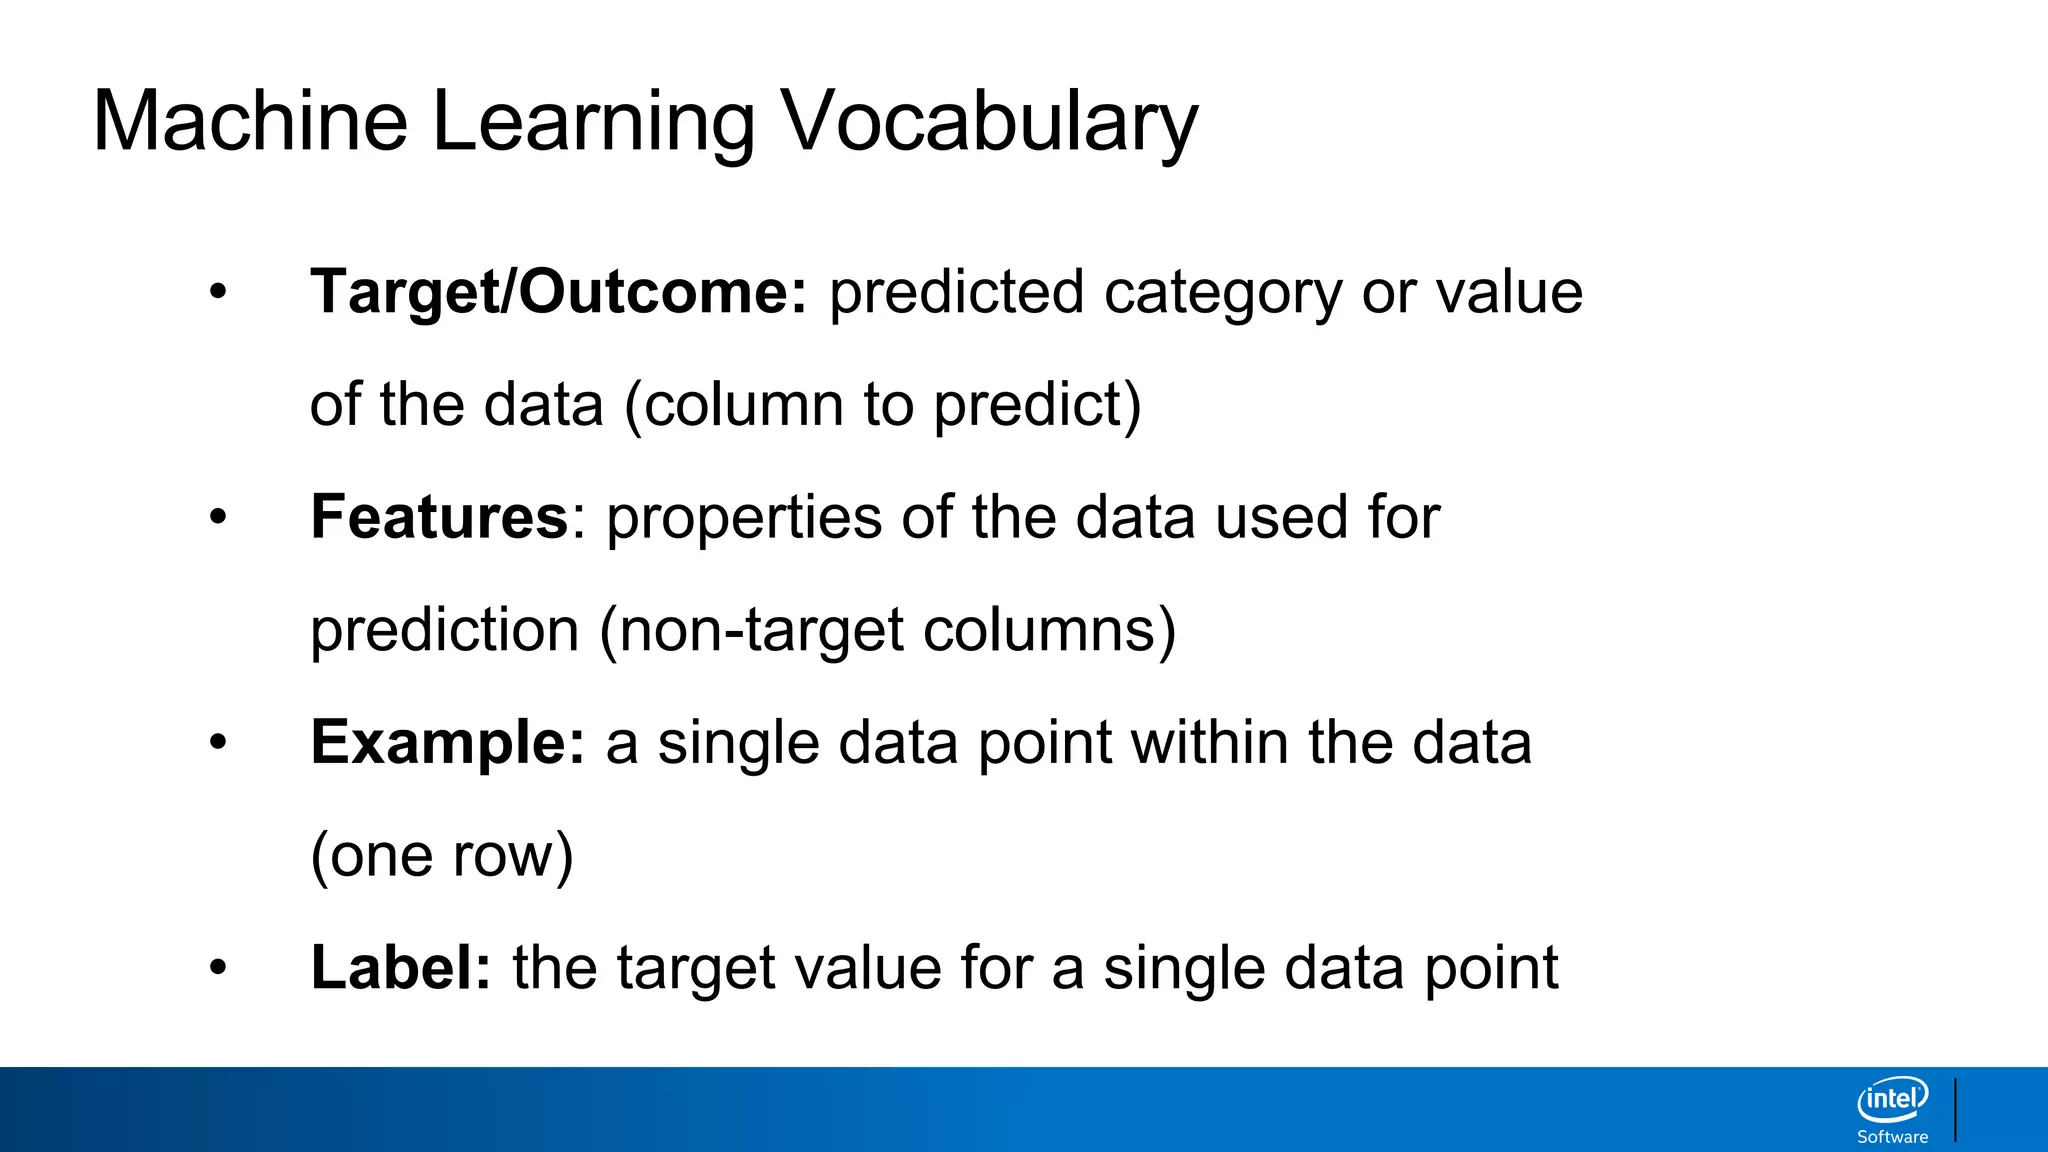
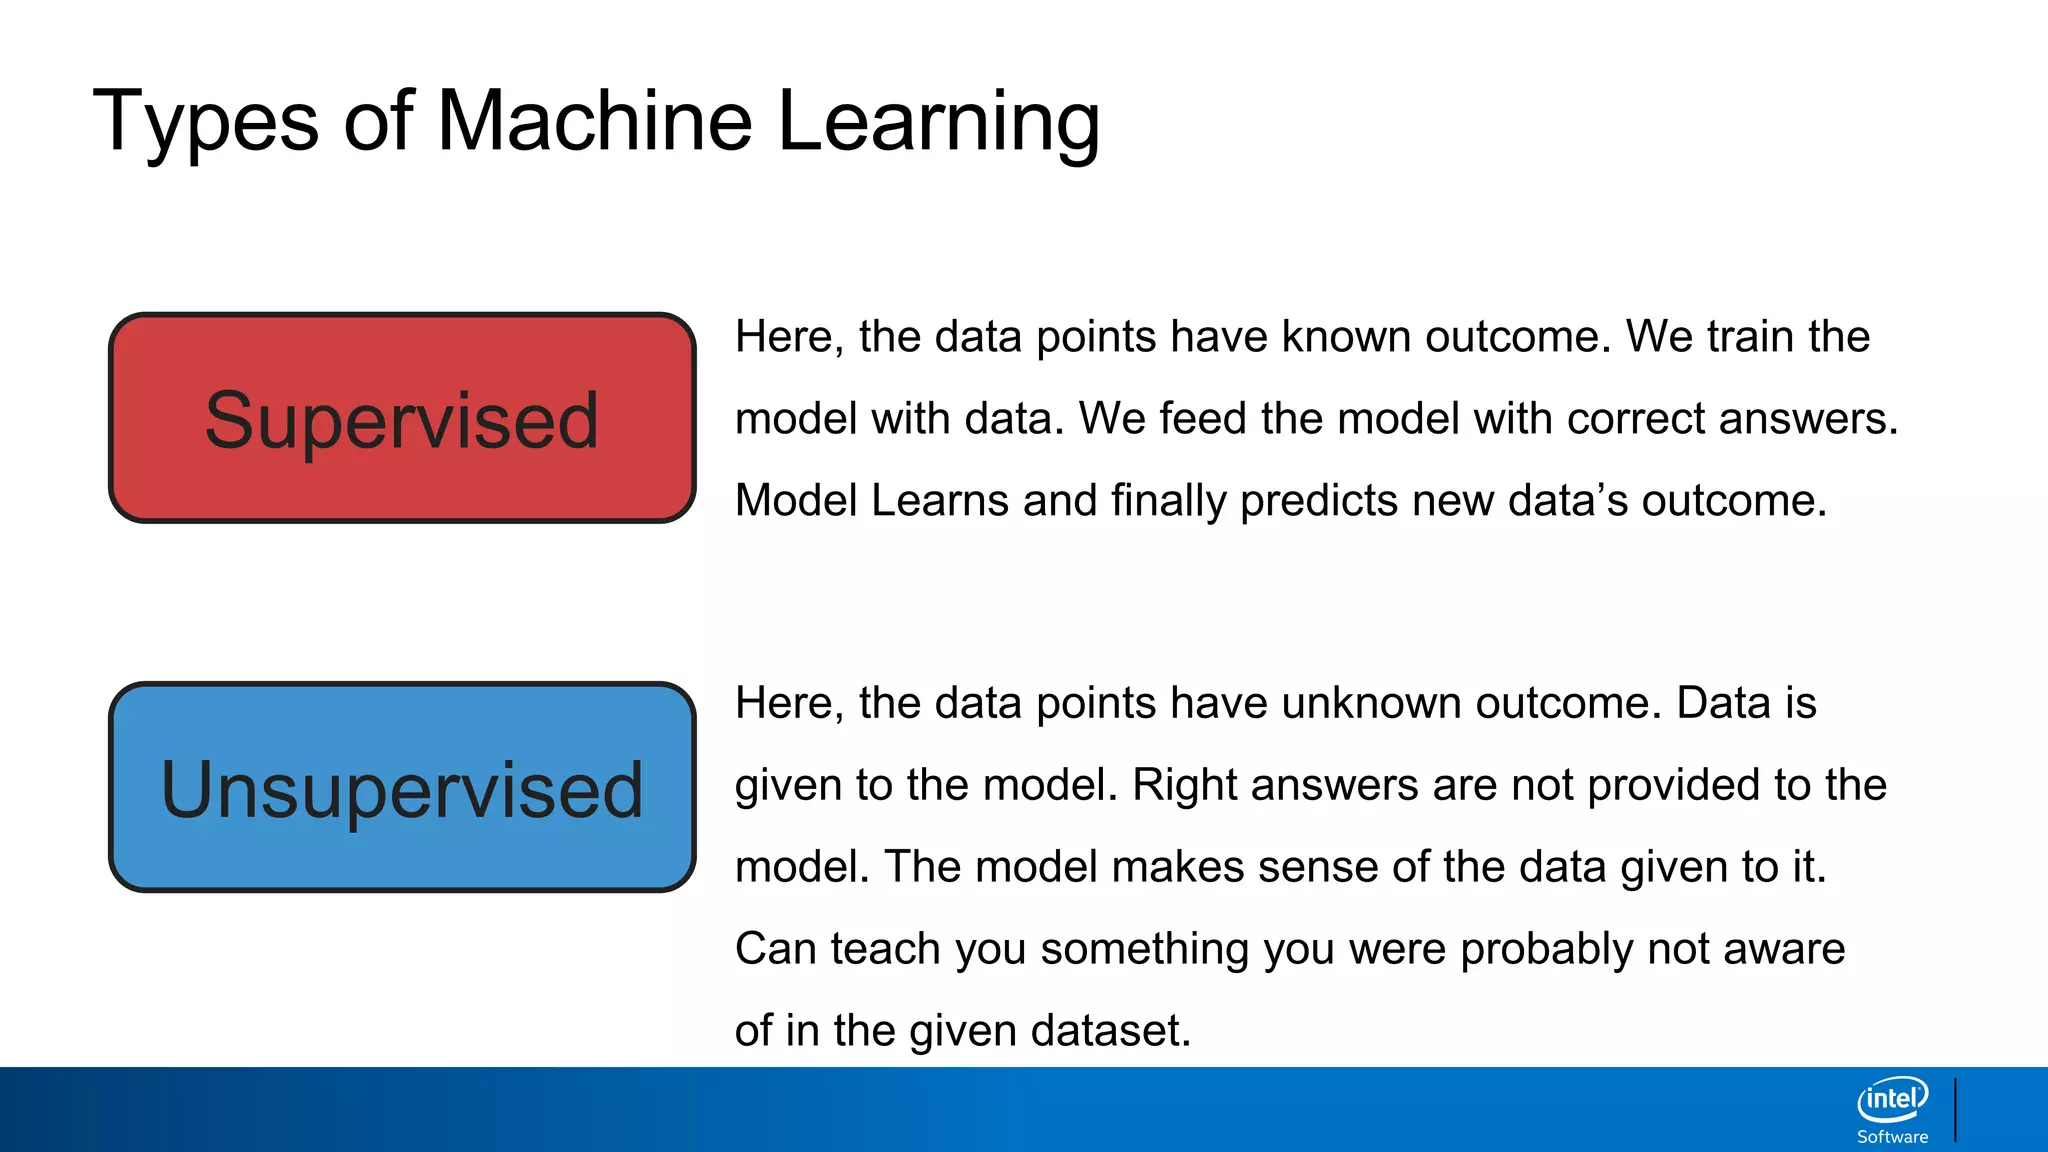
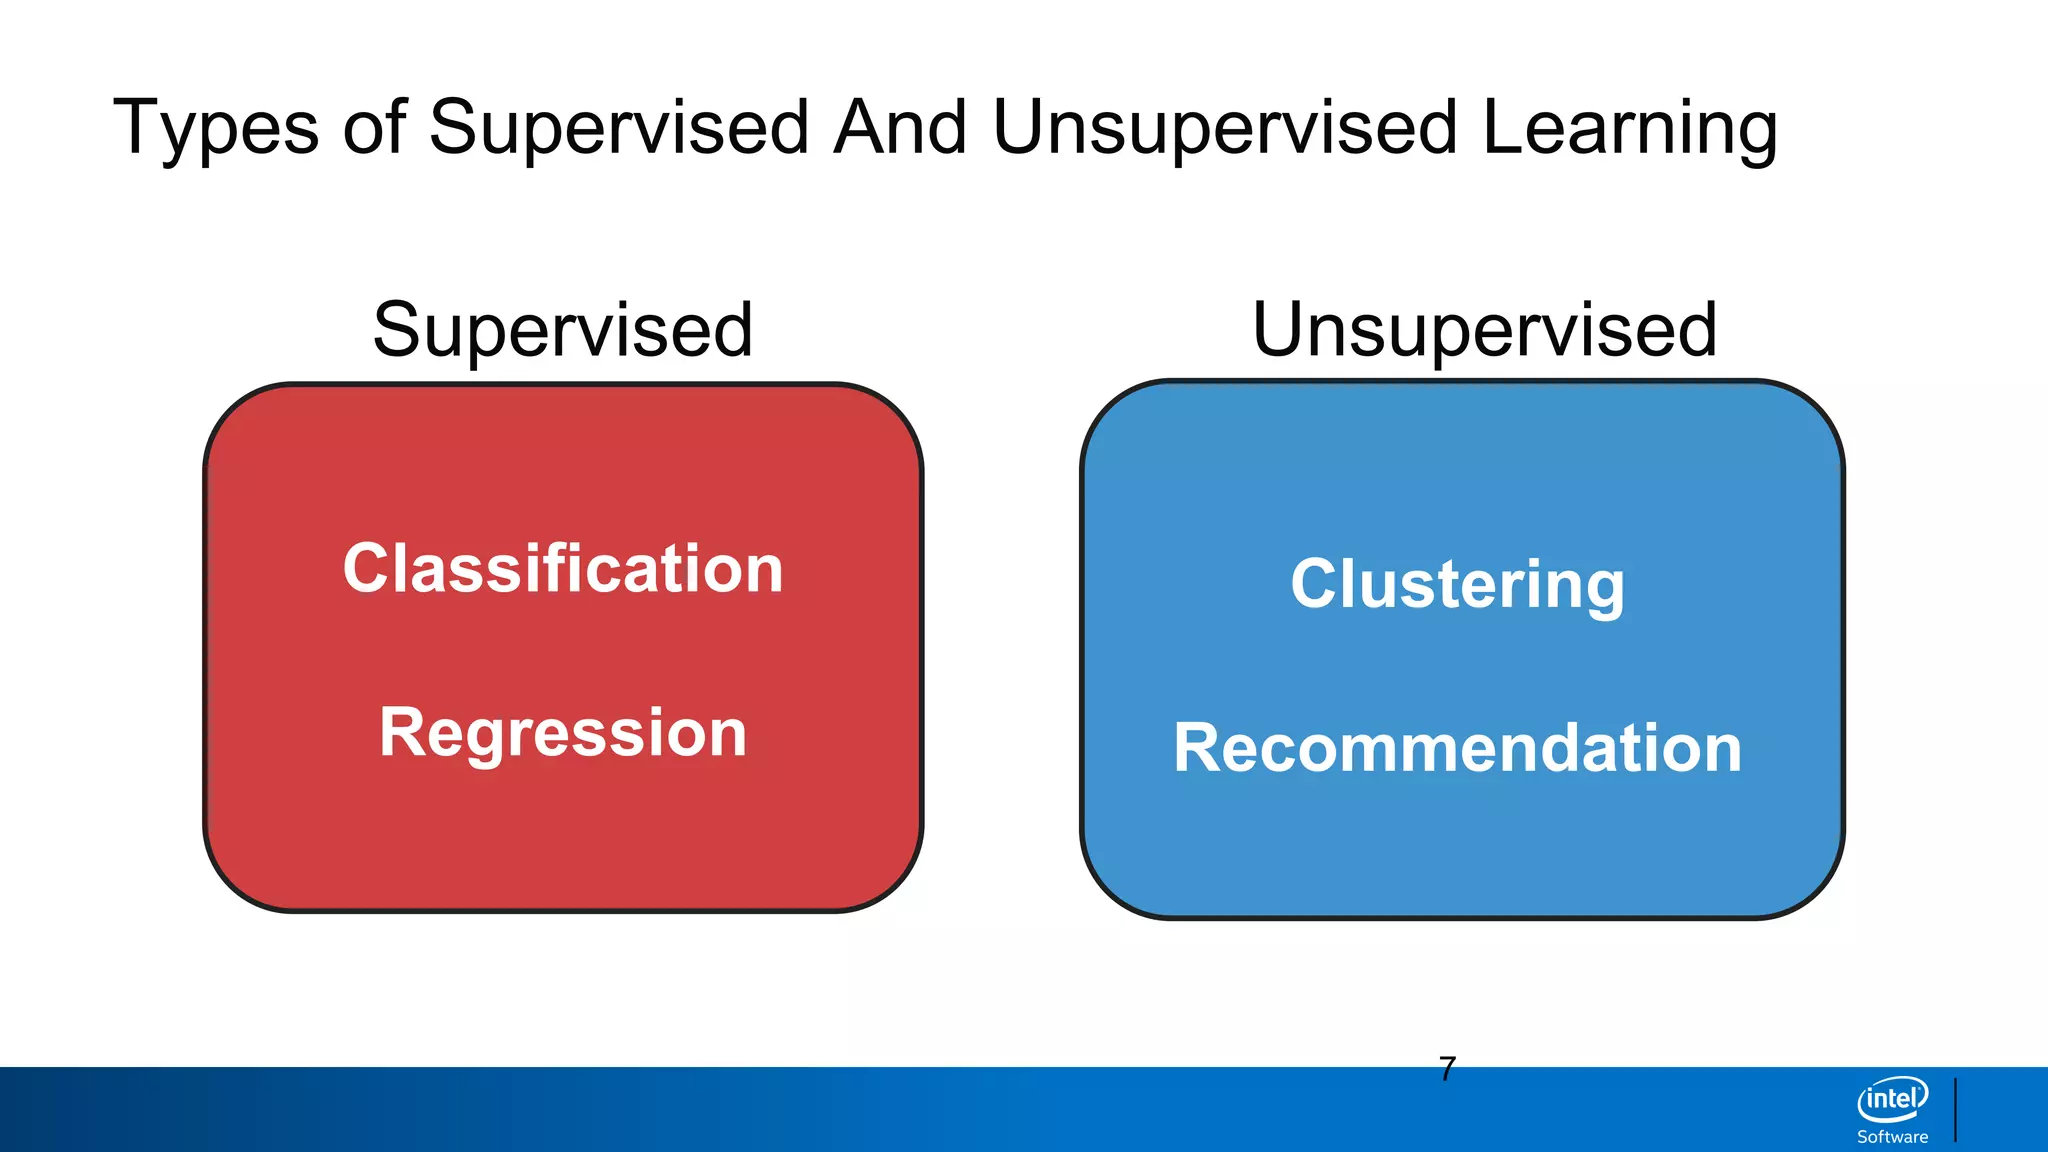
This document discusses machine learning and natural language processing (NLP) techniques for text classification. It provides an overview of supervised vs. unsupervised learning and classification vs. regression problems. It then walks through the steps to perform binary text classification using logistic regression and Naive Bayes models on an SMS spam collection dataset. The steps include preparing and splitting the data, numerically encoding text with Count Vectorization, fitting models on the training data, and evaluating model performance on the test set using metrics like accuracy, precision, recall and F1 score. Naive Bayes classification is also introduced as an alternative simpler technique to logistic regression for text classification tasks.


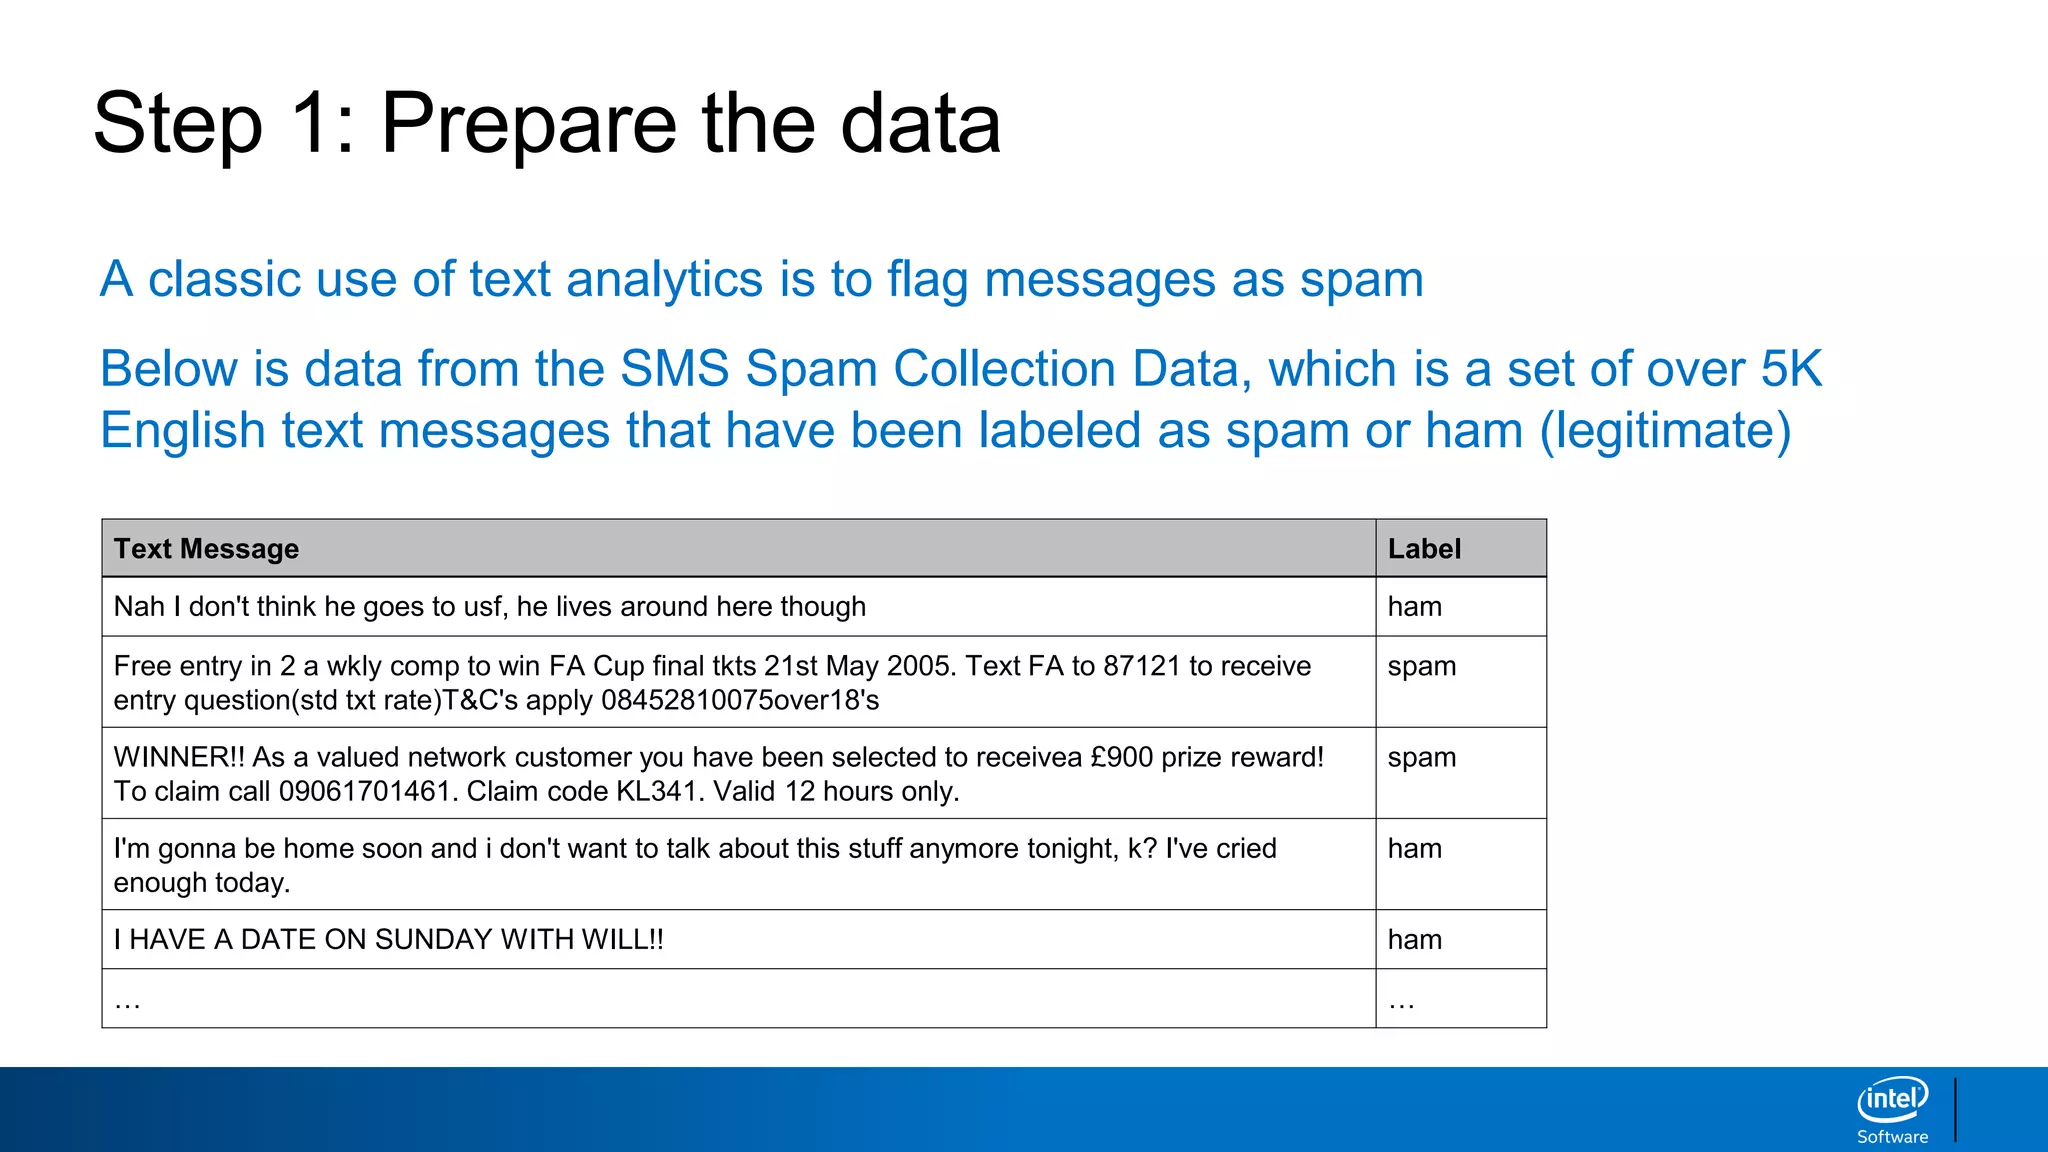
![Step 1: Prepare the data [Code]
# make sure the data is labeled
import pandas as pd
data = pd.read_table('SMSSpamCollection.txt', header=None)
data.columns = ['label', 'text']
print(data.head()) # print function requires Python 3
Input:
Output:](https://image.slidesharecdn.com/machinelearningandnlp-190218095531/85/Machine-learning-and_nlp-28-320.jpg)
![Step 1: Prepare the data [Code]
# remove words with numbers, punctuation and capital letters
import re
import string
alphanumeric = lambda x: re.sub(r"""w*dw*""", ' ', x)
punc_lower = lambda x: re.sub('[%s]' % re.escape(string.punctuation), ' ', x.lower())
data['text'] = data.text.map(alphanumeric).map(punc_lower)
print(data.head())
Input:
Output:](https://image.slidesharecdn.com/machinelearningandnlp-190218095531/85/Machine-learning-and_nlp-29-320.jpg)
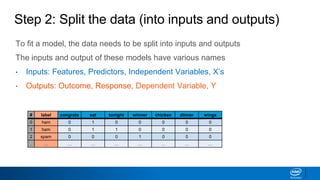
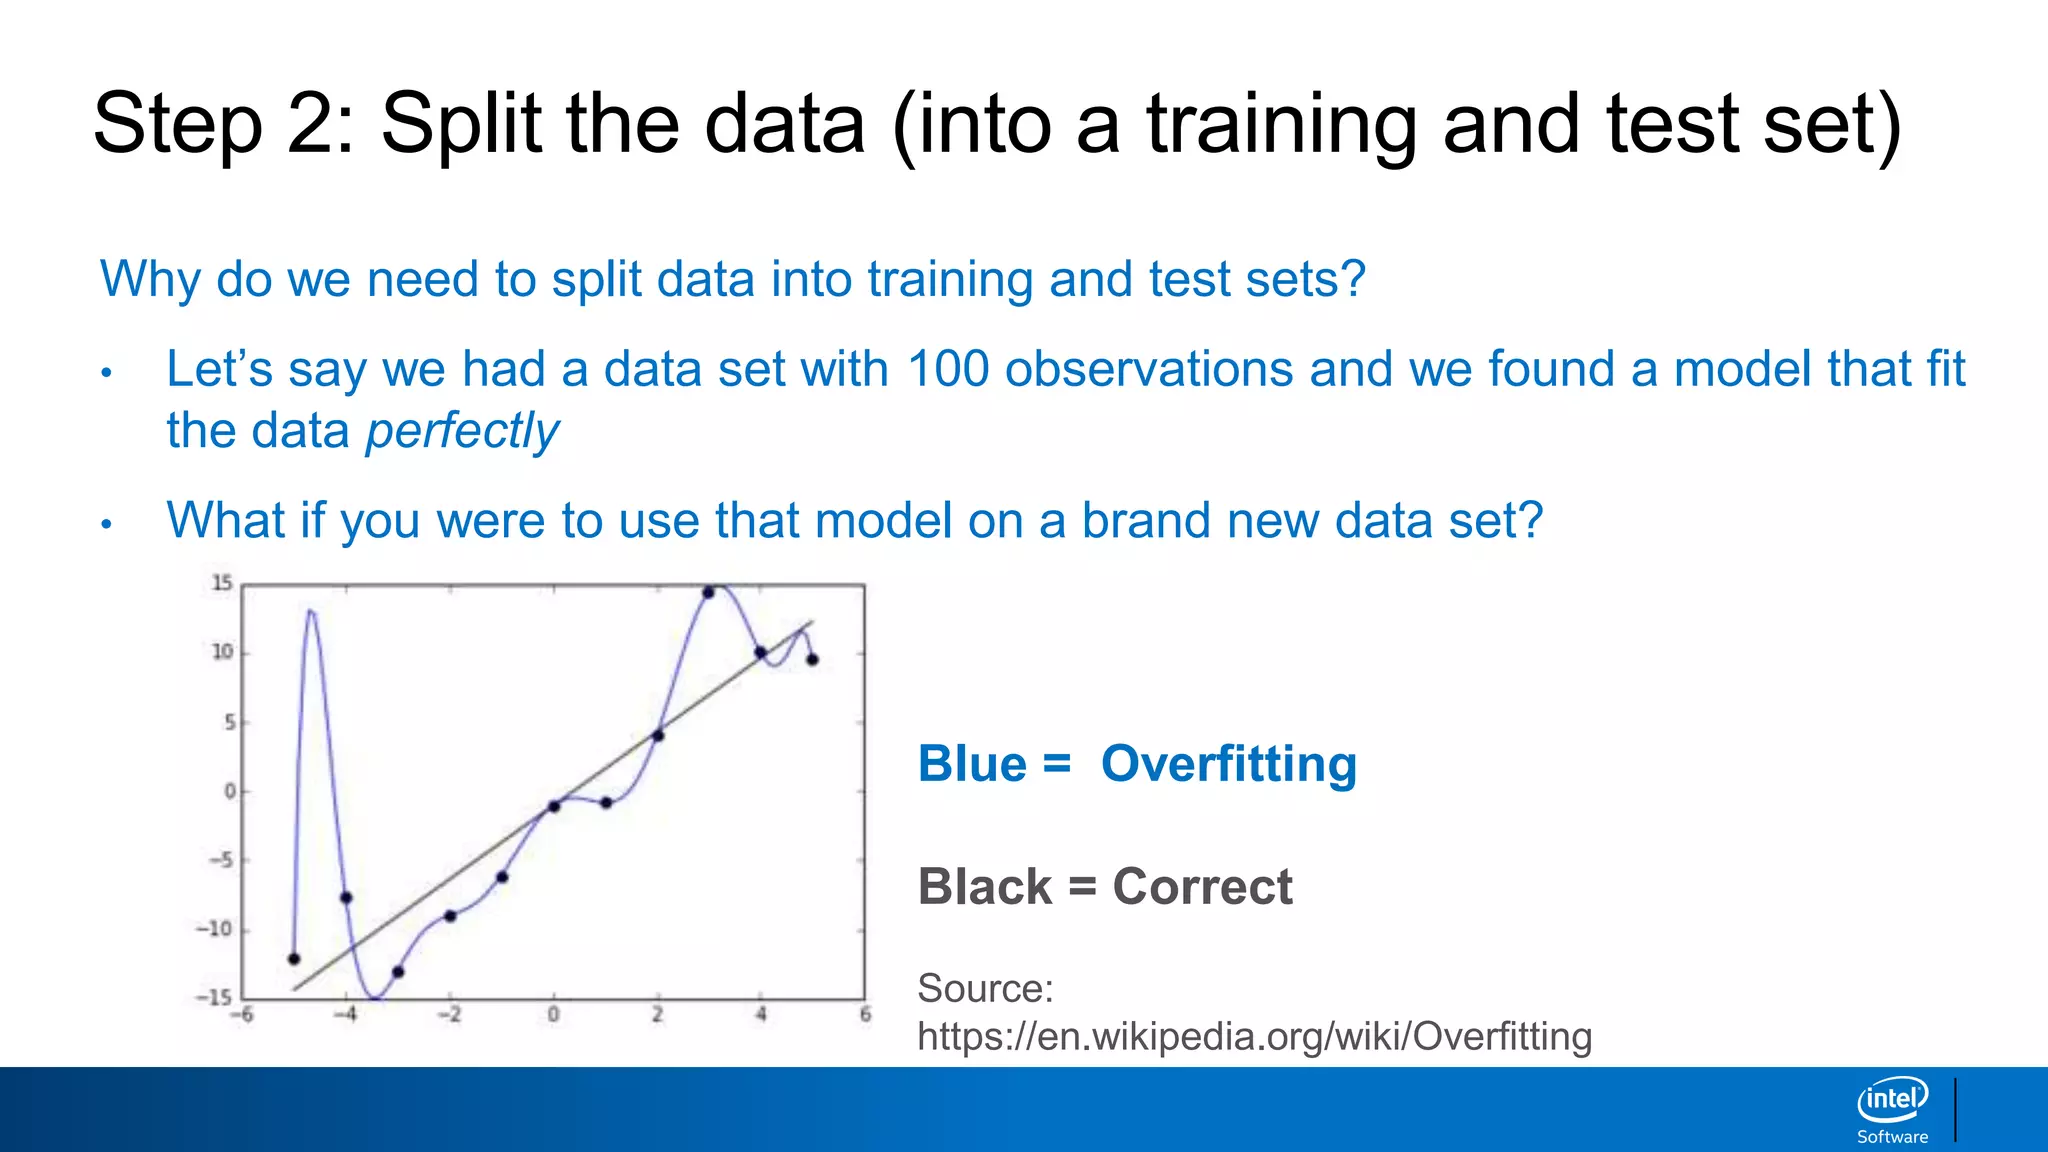
![Step 2: Split the data [Code]
# split the data into inputs and outputs
X = data.text # inputs into model
y = data.label # output of model
Input:
Output:](https://image.slidesharecdn.com/machinelearningandnlp-190218095531/85/Machine-learning-and_nlp-31-320.jpg)
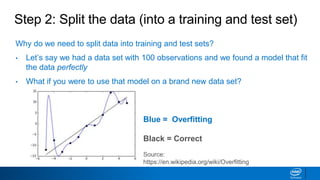

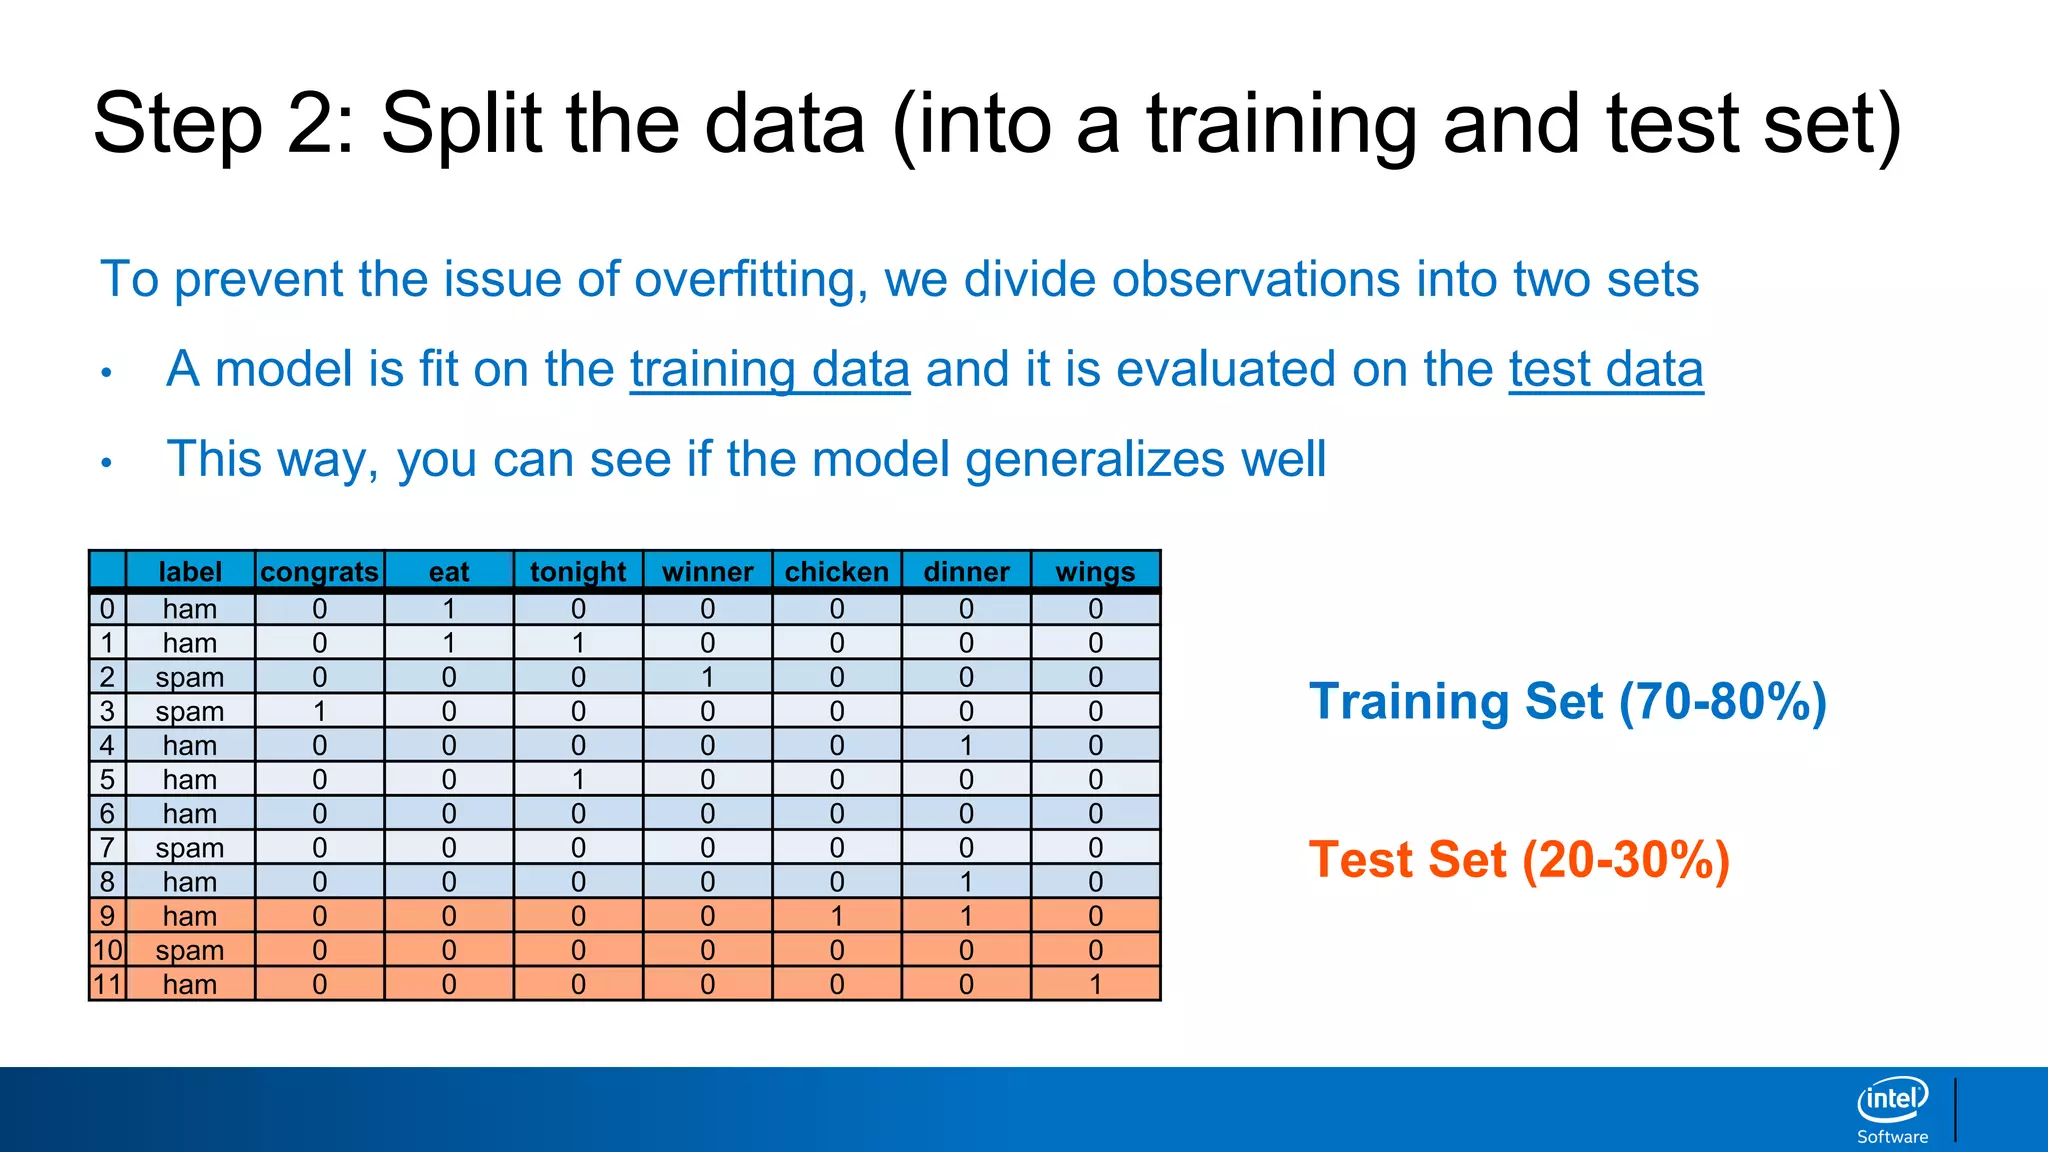
![Step 2: Split the data [Code]
# split the data into a training and test set
from sklearn.model_selection import train_test_split
X_train, X_test, y_train, y_test = train_test_split(X, y, test_size=0.3, random_state=42)
# test size = 30% of observations, which means training size = 70% of observations
# random state = 42, so we all get the same random train / test split
Input:
Output:](https://image.slidesharecdn.com/machinelearningandnlp-190218095531/85/Machine-learning-and_nlp-34-320.jpg)
![Step 3: Numerically encode the input data [Code]
from sklearn.feature_extraction.text import CountVectorizer
cv = CountVectorizer(stop_words=‘english’)
X_train_cv = cv.fit_transform(X_train) # fit_transform learns the vocab and one-hot
encodes
X_test_cv = cv.transform(X_test) # transform uses the same vocab and one-hot encodes
# print the dimensions of the training set (text messages, terms)
print(X_train_cv.toarray().shape)
Input:
Output:
(3900, 6103)](https://image.slidesharecdn.com/machinelearningandnlp-190218095531/85/Machine-learning-and_nlp-35-320.jpg)
![Step 4: Fit model and predict outcomes [Code]
# Use a logistic regression model
from sklearn.linear_model import LogisticRegression
lr = LogisticRegression()
# Train the model
lr.fit(X_train_cv, y_train)
# Take the model that was trained on the X_train_cv data and apply it to the X_test_cv
data
y_pred_cv = lr.predict(X_test_cv)
y_pred_cv # The output is all of the predictions
Input:
Output:
array(['ham', 'ham', 'ham', ..., 'ham', 'spam', 'ham'], dtype=object)](https://image.slidesharecdn.com/machinelearningandnlp-190218095531/85/Machine-learning-and_nlp-36-320.jpg)
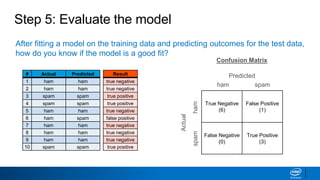
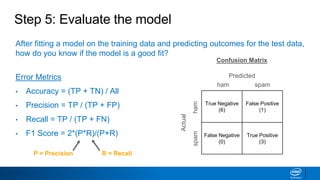
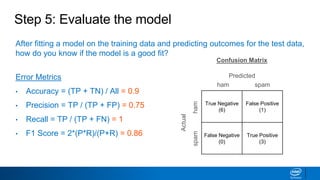
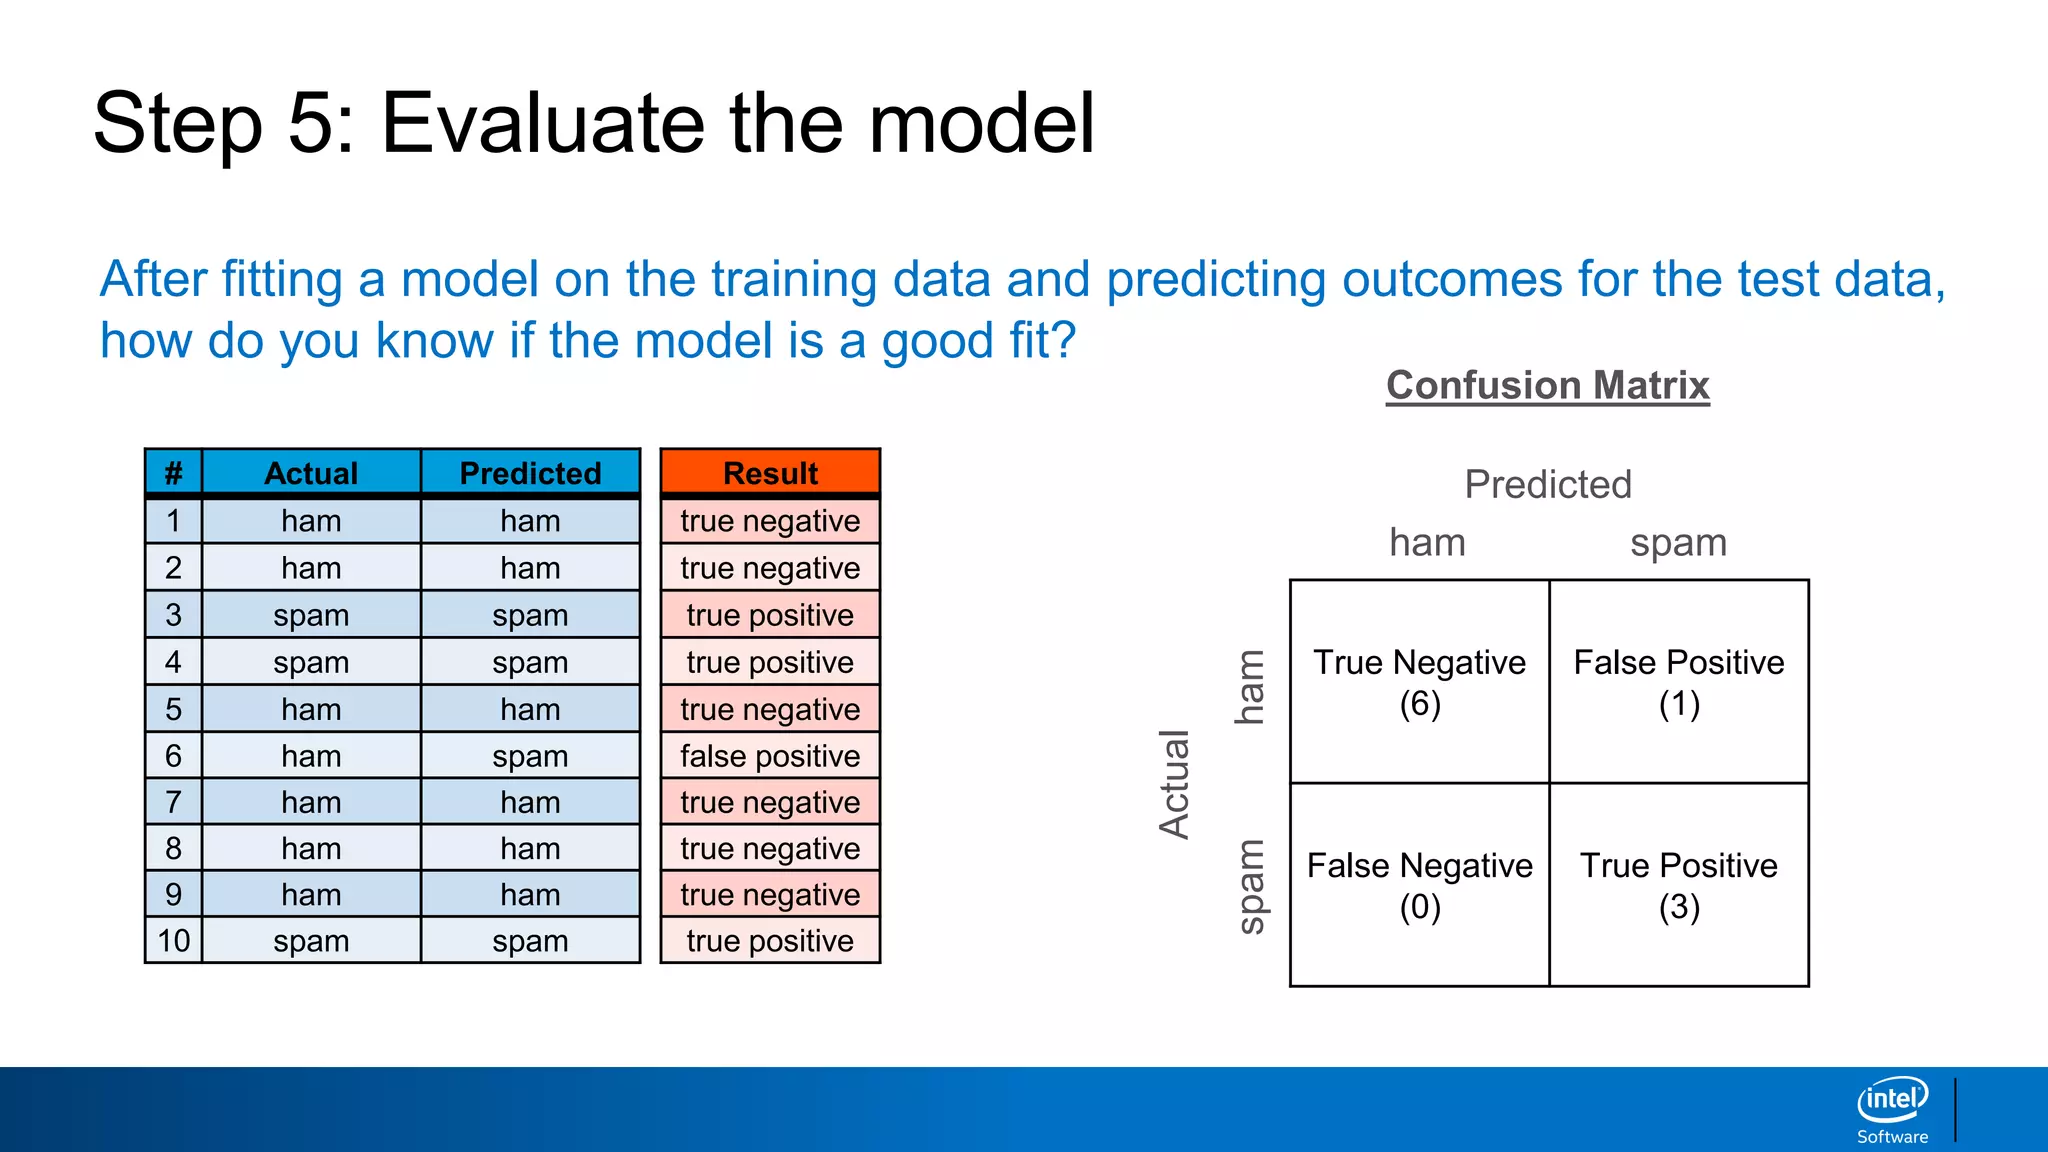
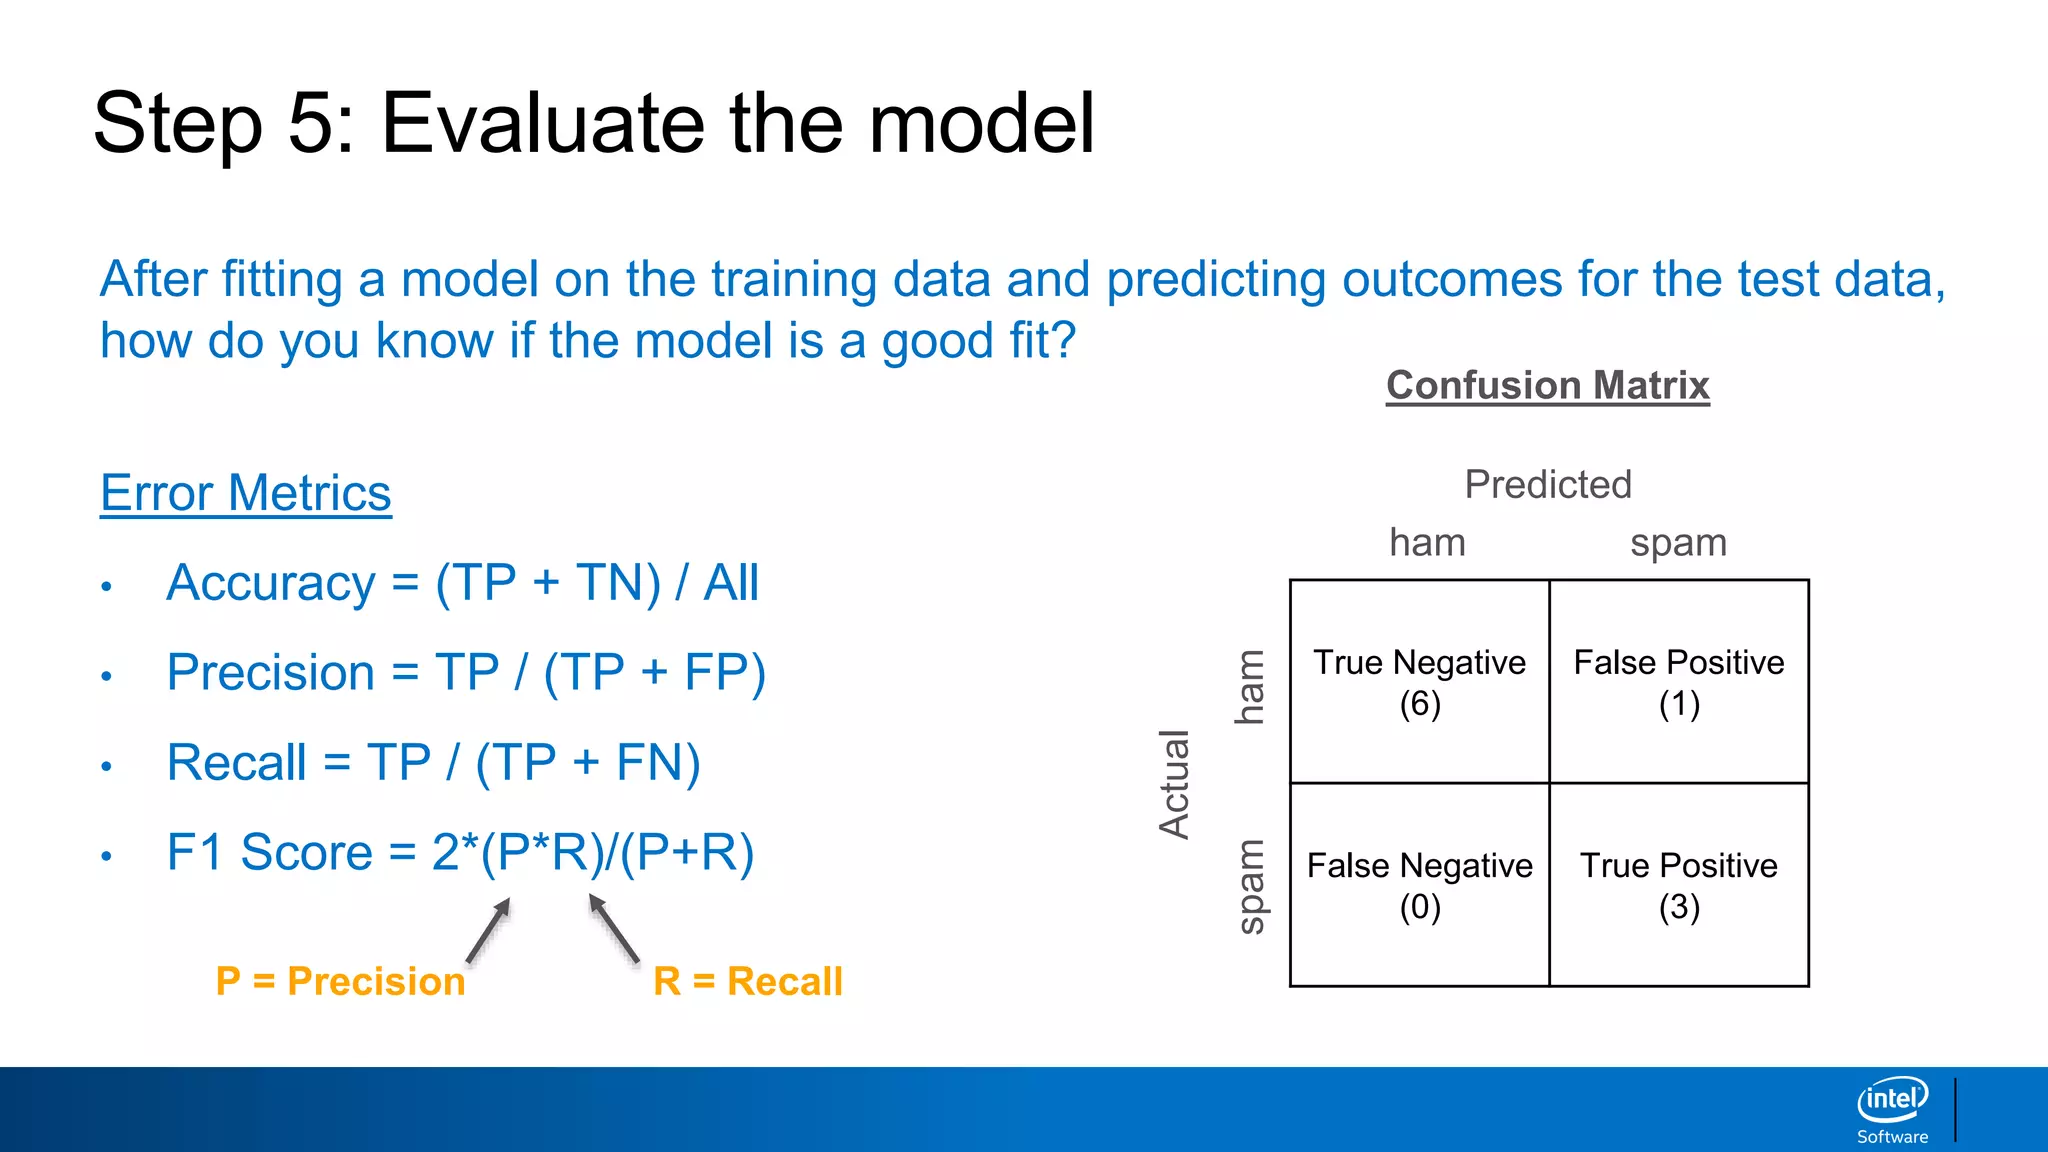
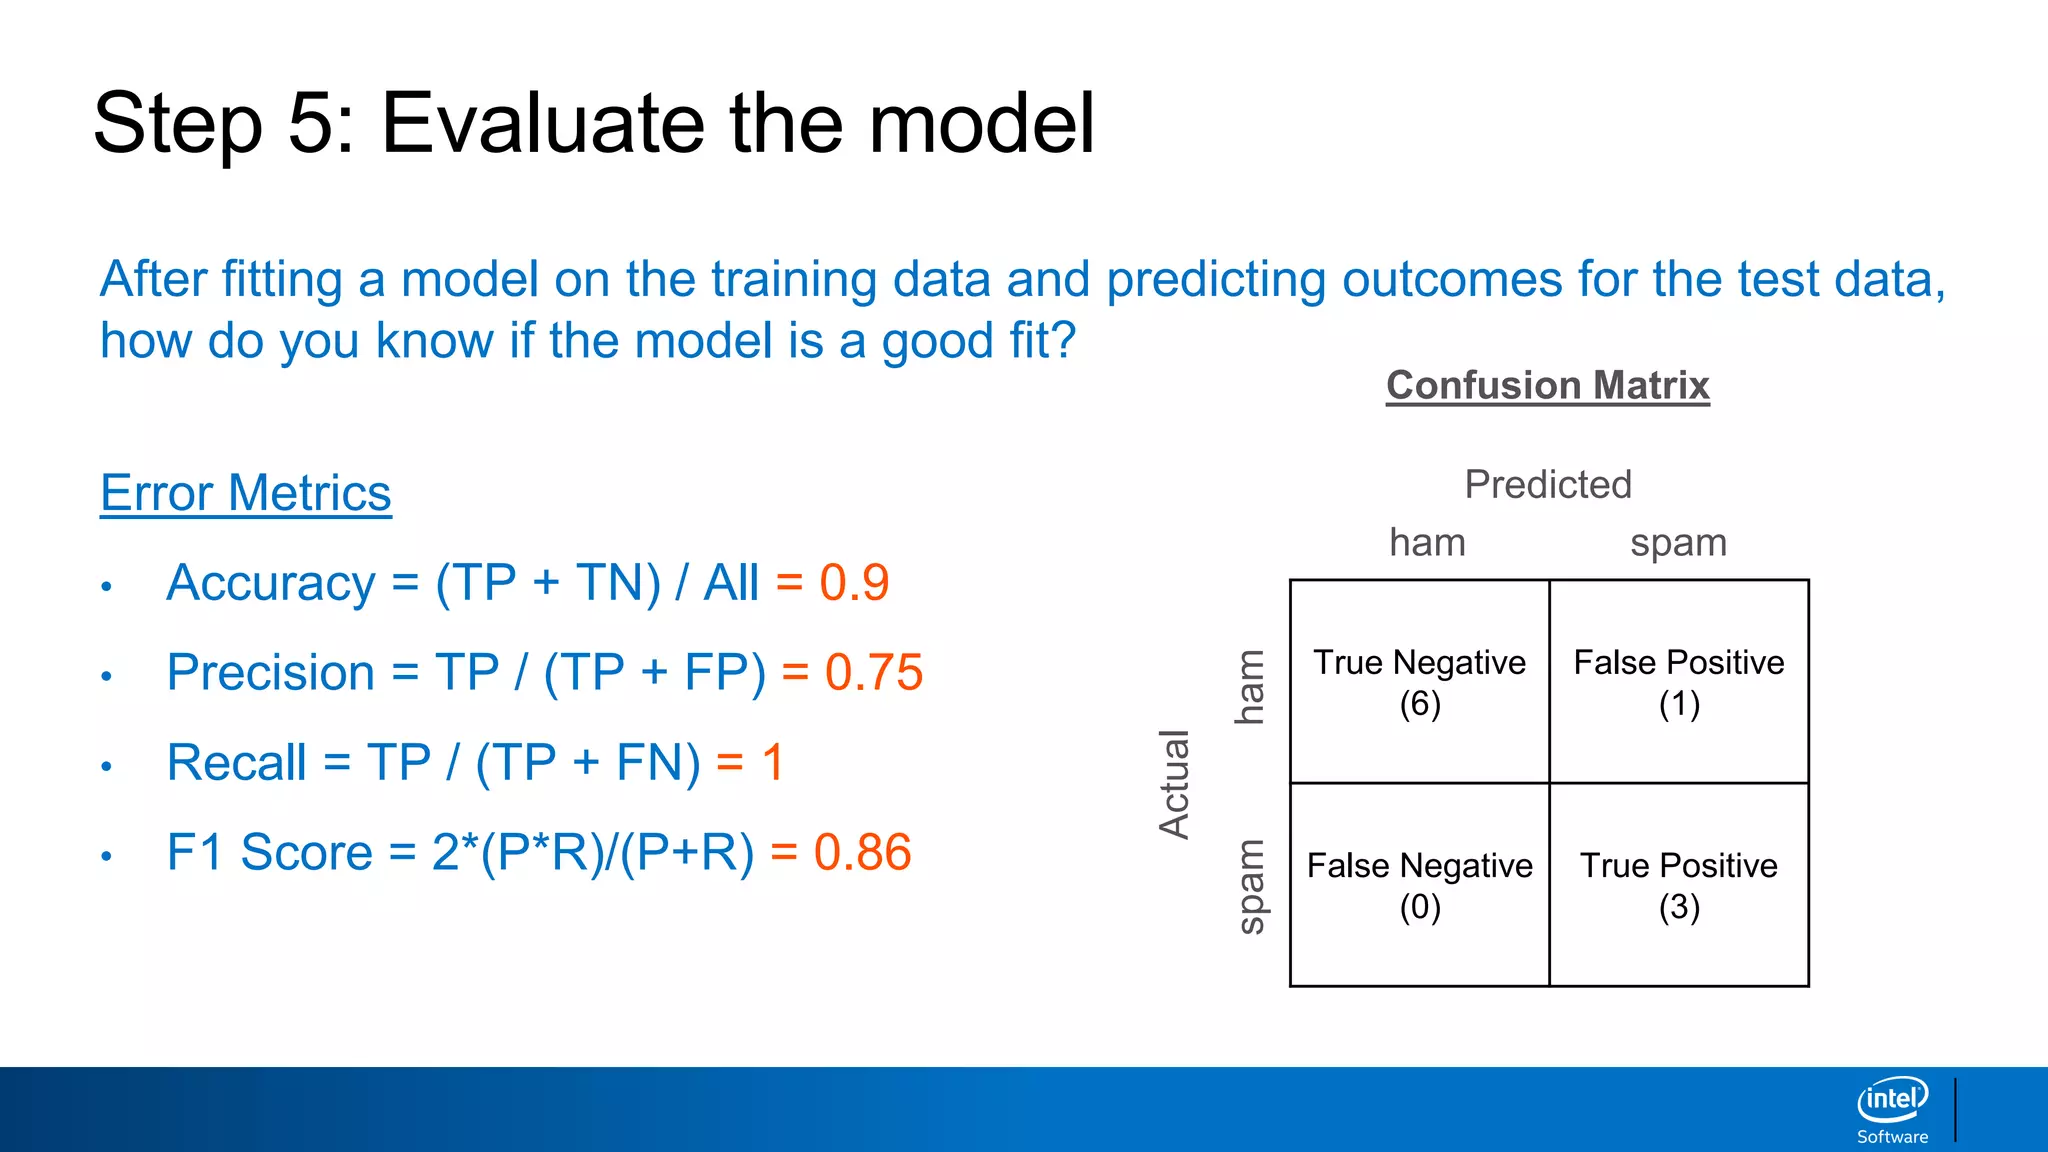
![Step 5: Evaluate the model [Code]
from sklearn.metrics import confusion_matrix
import matplotlib.pyplot as plt
import seaborn as sns
%matplotlib inline
cm = confusion_matrix(y_test, y_pred_cv)
sns.heatmap(cm, xticklabels=['predicted_ham', ‘predicted_spam'], yticklabels=['actual_ham', ‘actual_spam'],
annot=True, fmt='d', annot_kws={'fontsize':20}, cmap=“YlGnBu");
true_neg, false_pos = cm[0]
false_neg, true_pos = cm[1]
accuracy = round((true_pos + true_neg) / (true_pos + true_neg + false_pos + false_neg),3)
precision = round((true_pos) / (true_pos + false_pos),3)
recall = round((true_pos) / (true_pos + false_neg),3)
f1 = round(2 * (precision * recall) / (precision + recall),3)
print('Accuracy: {}'.format(accuracy))
print('Precision: {}'.format(precision))
print('Recall: {}'.format(recall))
print(‘F1 Score: {}’.format(f1))
Input:](https://image.slidesharecdn.com/machinelearningandnlp-190218095531/85/Machine-learning-and_nlp-40-320.jpg)
![Step 5: Evaluate the model [Code]
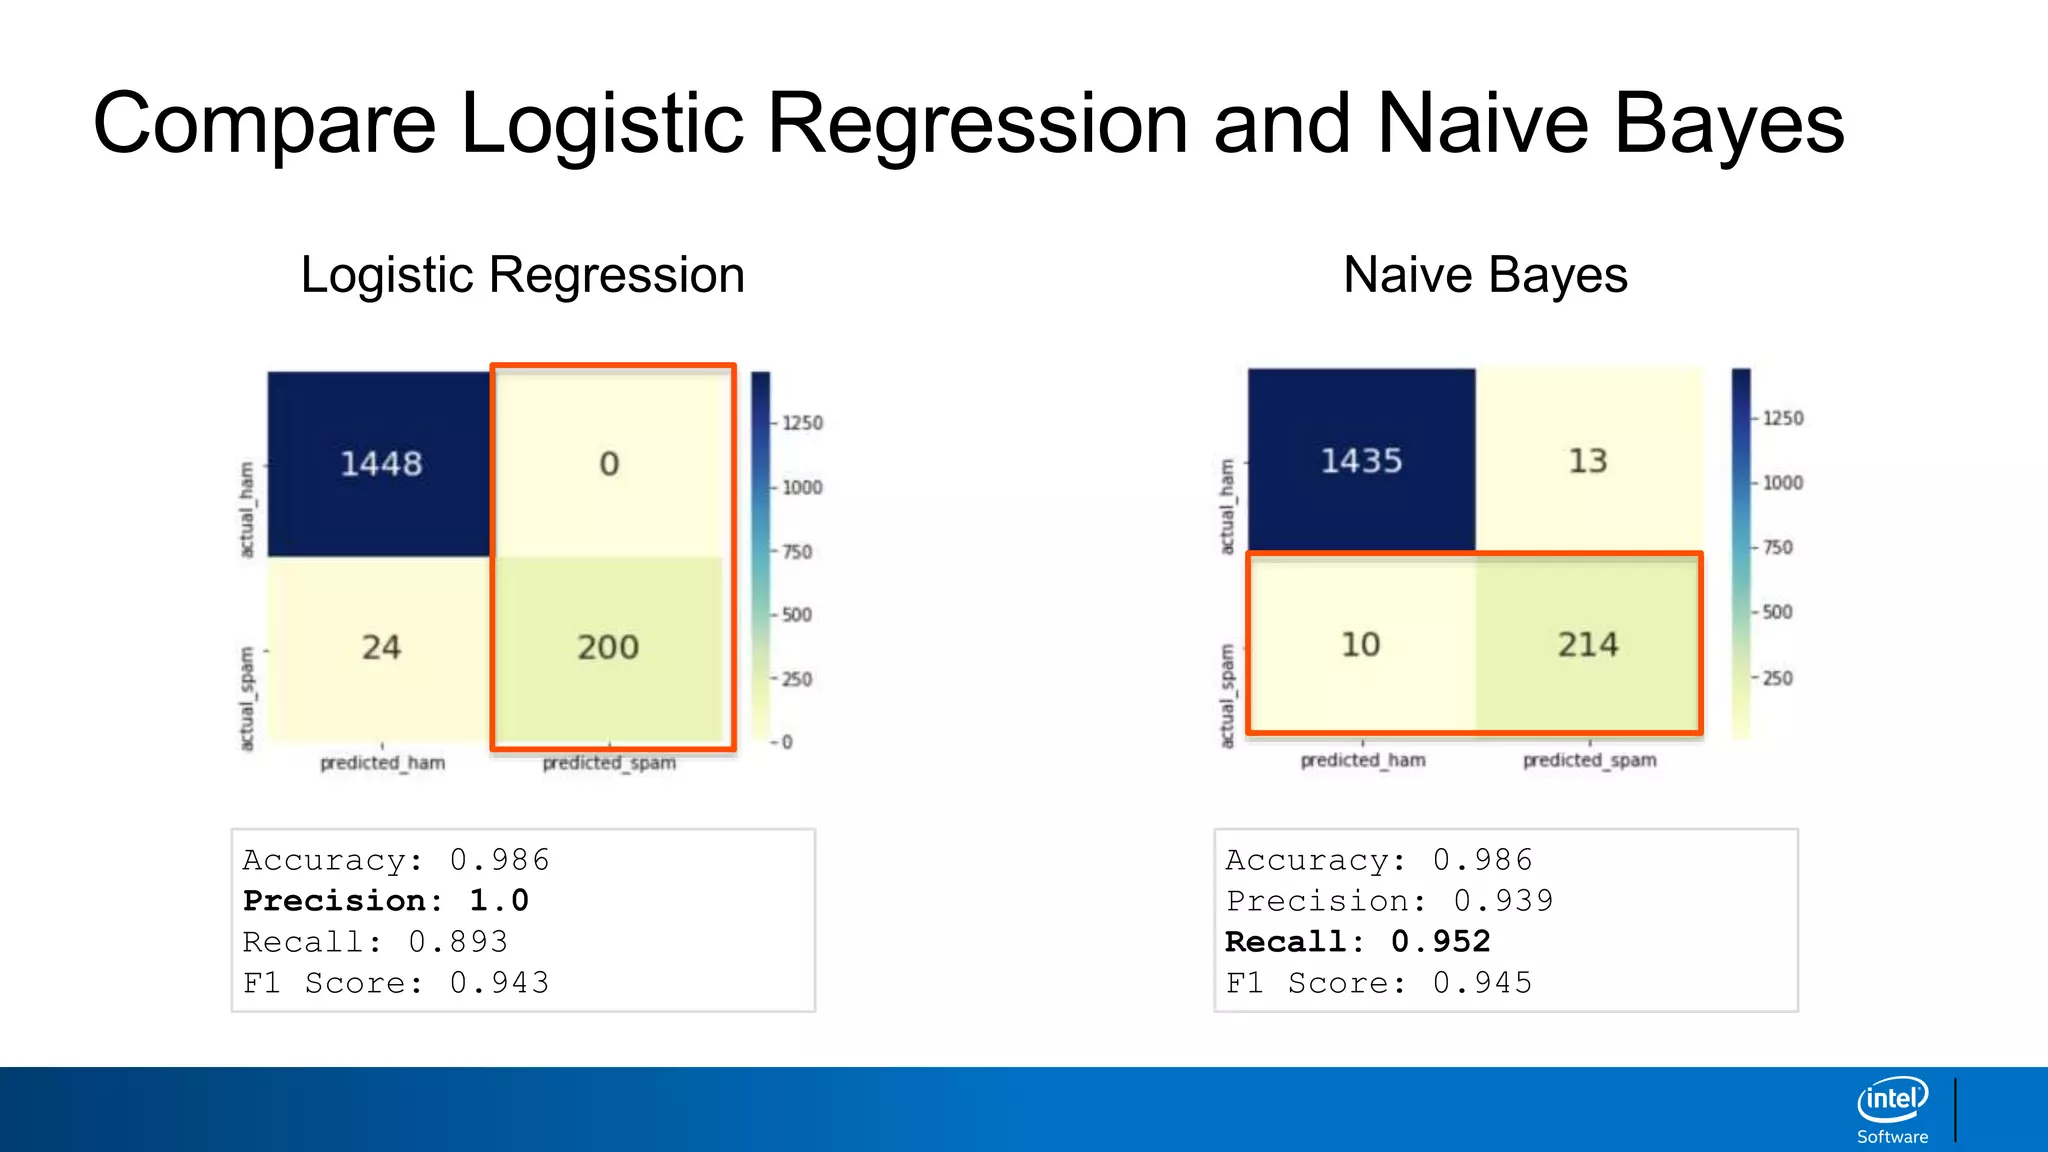
Output:
Accuracy: 0.986
Precision: 1.0
Recall: 0.893
F1 Score: 0.943](https://image.slidesharecdn.com/machinelearningandnlp-190218095531/85/Machine-learning-and_nlp-41-320.jpg)

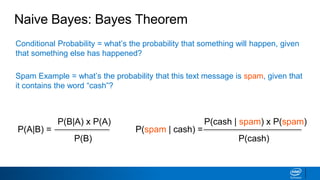
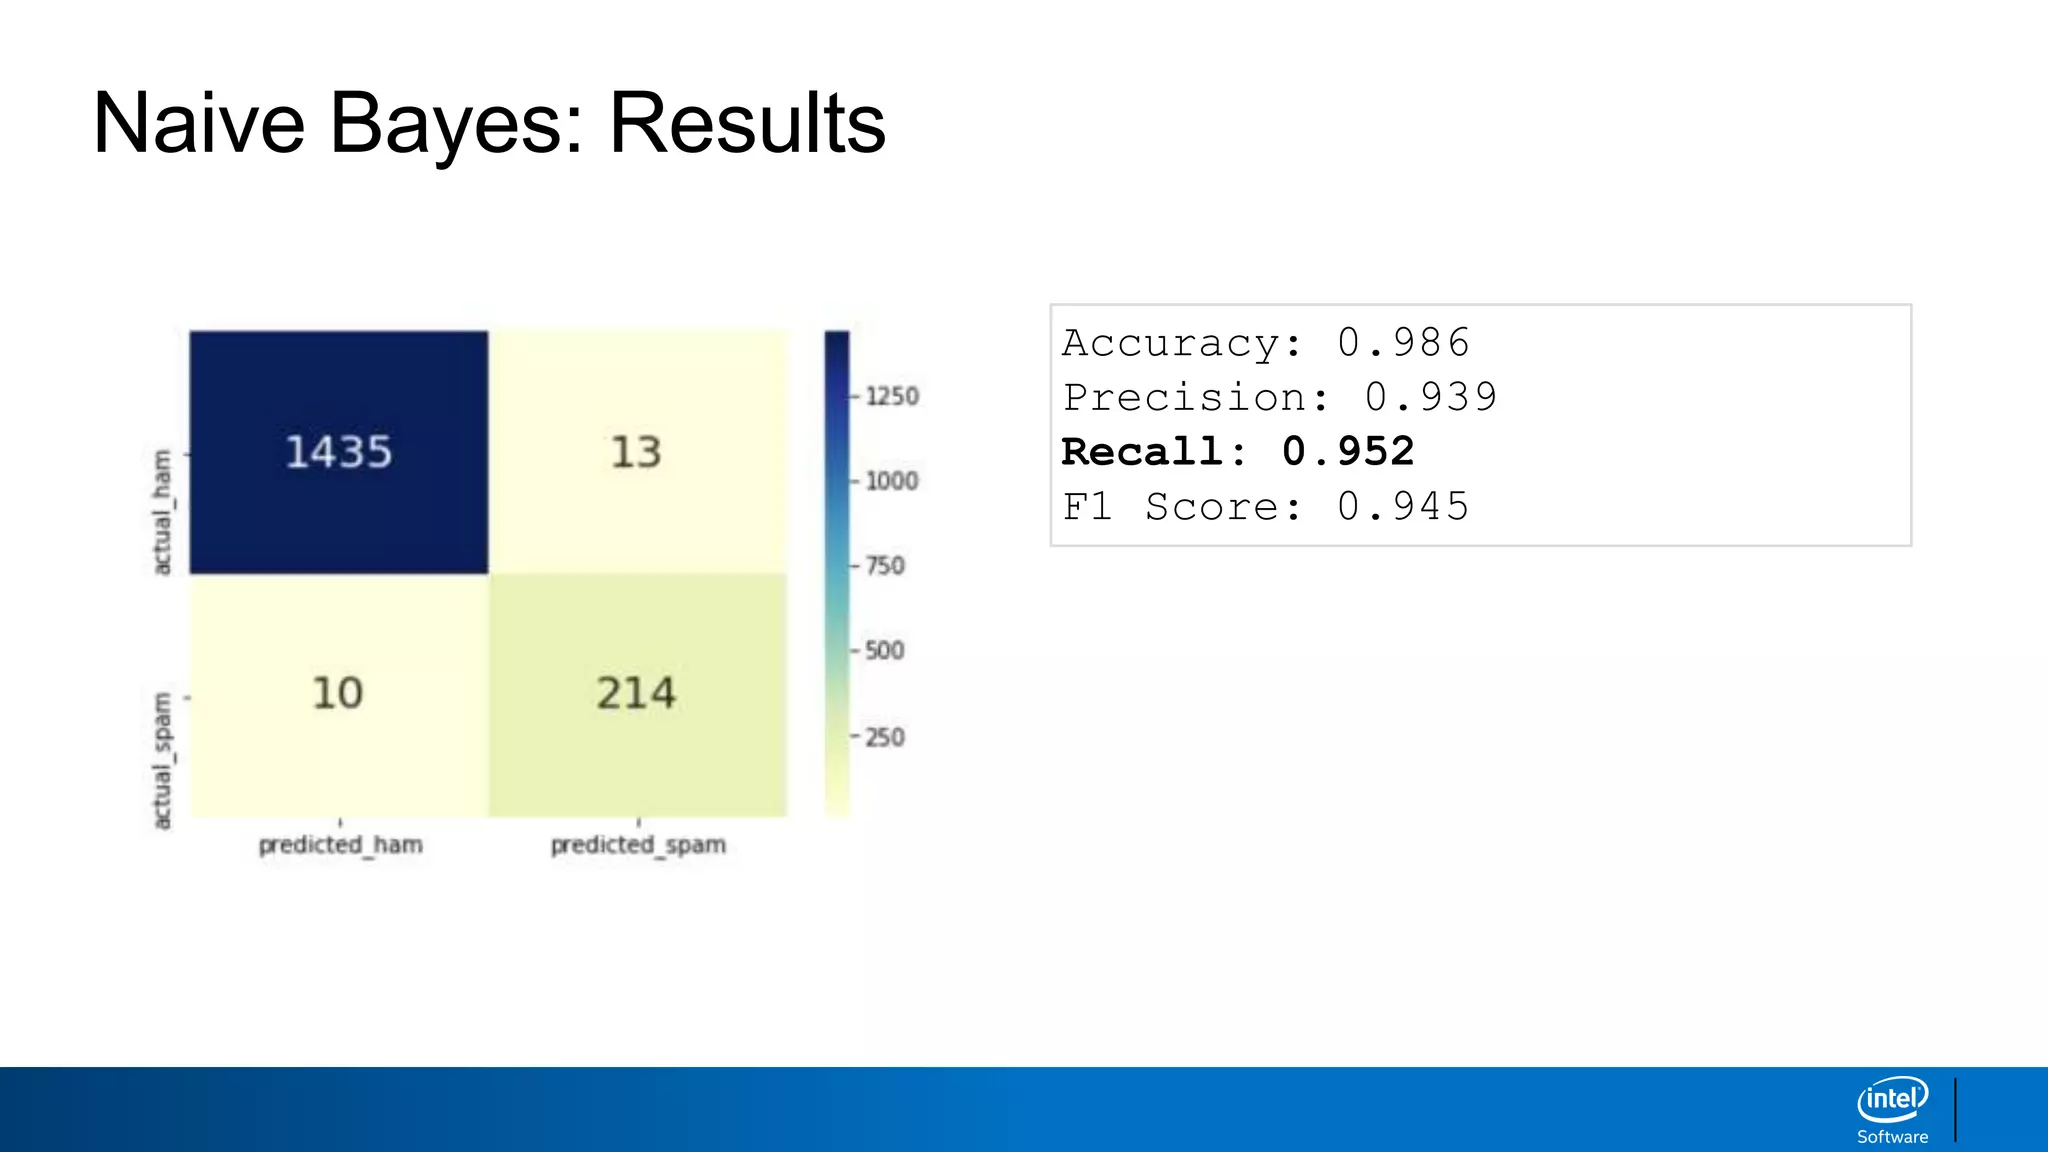
![Naive Bayes: Fit model [Code]
# Use a Naive Bayes model
from sklearn.naive_bayes import MultinomialNB
nb = MultinomialNB()
# Train the model
nb.fit(X_train_cv, y_train)
# Take the model that was trained on the X_train_cv data and apply it to the X_test_cv
data
y_pred_cv_nb = nb.predict(X_test_cv)
y_pred_cv_nb # The output is all of the predictions
Input:
Output:
array(['ham', 'ham', 'ham', ..., 'ham', 'spam', ‘ham'], dtype='<U4')](https://image.slidesharecdn.com/machinelearningandnlp-190218095531/85/Machine-learning-and_nlp-47-320.jpg)


![Step 1: Prepare the data [Code]
# make sure the data is labeled
import pandas as pd
data = pd.read_table('SMSSpamCollection.txt', header=None)
data.columns = ['label', 'text']
print(data.head()) # print function requires Python 3
Input:
Output:](https://image.slidesharecdn.com/machinelearningandnlp-190218095531/75/Machine-learning-and_nlp-28-2048.jpg)
![Step 1: Prepare the data [Code]
# remove words with numbers, punctuation and capital letters
import re
import string
alphanumeric = lambda x: re.sub(r"""w*dw*""", ' ', x)
punc_lower = lambda x: re.sub('[%s]' % re.escape(string.punctuation), ' ', x.lower())
data['text'] = data.text.map(alphanumeric).map(punc_lower)
print(data.head())
Input:
Output:](https://image.slidesharecdn.com/machinelearningandnlp-190218095531/75/Machine-learning-and_nlp-29-2048.jpg)

![Step 2: Split the data [Code]
# split the data into inputs and outputs
X = data.text # inputs into model
y = data.label # output of model
Input:
Output:](https://image.slidesharecdn.com/machinelearningandnlp-190218095531/75/Machine-learning-and_nlp-31-2048.jpg)
![Step 2: Split the data [Code]
# split the data into a training and test set
from sklearn.model_selection import train_test_split
X_train, X_test, y_train, y_test = train_test_split(X, y, test_size=0.3, random_state=42)
# test size = 30% of observations, which means training size = 70% of observations
# random state = 42, so we all get the same random train / test split
Input:
Output:](https://image.slidesharecdn.com/machinelearningandnlp-190218095531/75/Machine-learning-and_nlp-34-2048.jpg)
![Step 3: Numerically encode the input data [Code]
from sklearn.feature_extraction.text import CountVectorizer
cv = CountVectorizer(stop_words=‘english’)
X_train_cv = cv.fit_transform(X_train) # fit_transform learns the vocab and one-hot
encodes
X_test_cv = cv.transform(X_test) # transform uses the same vocab and one-hot encodes
# print the dimensions of the training set (text messages, terms)
print(X_train_cv.toarray().shape)
Input:
Output:
(3900, 6103)](https://image.slidesharecdn.com/machinelearningandnlp-190218095531/75/Machine-learning-and_nlp-35-2048.jpg)
![Step 4: Fit model and predict outcomes [Code]
# Use a logistic regression model
from sklearn.linear_model import LogisticRegression
lr = LogisticRegression()
# Train the model
lr.fit(X_train_cv, y_train)
# Take the model that was trained on the X_train_cv data and apply it to the X_test_cv
data
y_pred_cv = lr.predict(X_test_cv)
y_pred_cv # The output is all of the predictions
Input:
Output:
array(['ham', 'ham', 'ham', ..., 'ham', 'spam', 'ham'], dtype=object)](https://image.slidesharecdn.com/machinelearningandnlp-190218095531/75/Machine-learning-and_nlp-36-2048.jpg)
![Step 5: Evaluate the model [Code]
from sklearn.metrics import confusion_matrix
import matplotlib.pyplot as plt
import seaborn as sns
%matplotlib inline
cm = confusion_matrix(y_test, y_pred_cv)
sns.heatmap(cm, xticklabels=['predicted_ham', ‘predicted_spam'], yticklabels=['actual_ham', ‘actual_spam'],
annot=True, fmt='d', annot_kws={'fontsize':20}, cmap=“YlGnBu");
true_neg, false_pos = cm[0]
false_neg, true_pos = cm[1]
accuracy = round((true_pos + true_neg) / (true_pos + true_neg + false_pos + false_neg),3)
precision = round((true_pos) / (true_pos + false_pos),3)
recall = round((true_pos) / (true_pos + false_neg),3)
f1 = round(2 * (precision * recall) / (precision + recall),3)
print('Accuracy: {}'.format(accuracy))
print('Precision: {}'.format(precision))
print('Recall: {}'.format(recall))
print(‘F1 Score: {}’.format(f1))
Input:](https://image.slidesharecdn.com/machinelearningandnlp-190218095531/75/Machine-learning-and_nlp-40-2048.jpg)
![Step 5: Evaluate the model [Code]
Output:
Accuracy: 0.986
Precision: 1.0
Recall: 0.893
F1 Score: 0.943](https://image.slidesharecdn.com/machinelearningandnlp-190218095531/75/Machine-learning-and_nlp-41-2048.jpg)
![Naive Bayes: Fit model [Code]
# Use a Naive Bayes model
from sklearn.naive_bayes import MultinomialNB
nb = MultinomialNB()
# Train the model
nb.fit(X_train_cv, y_train)
# Take the model that was trained on the X_train_cv data and apply it to the X_test_cv
data
y_pred_cv_nb = nb.predict(X_test_cv)
y_pred_cv_nb # The output is all of the predictions
Input:
Output:
array(['ham', 'ham', 'ham', ..., 'ham', 'spam', ‘ham'], dtype='<U4')](https://image.slidesharecdn.com/machinelearningandnlp-190218095531/75/Machine-learning-and_nlp-47-2048.jpg)