Downloaded 909 times
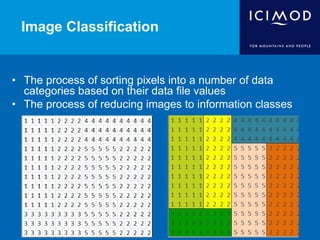
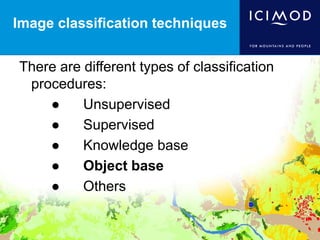
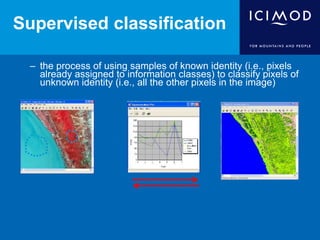
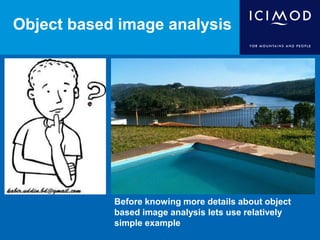
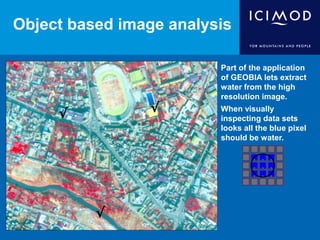
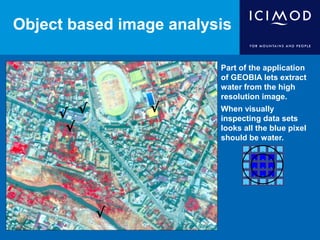
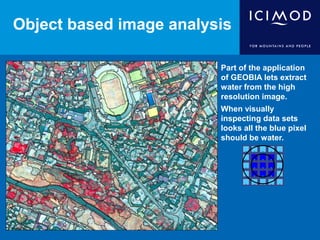

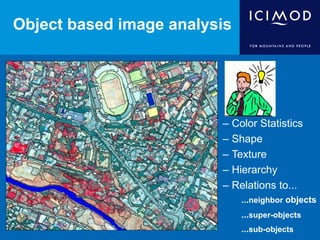
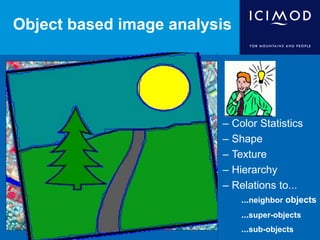
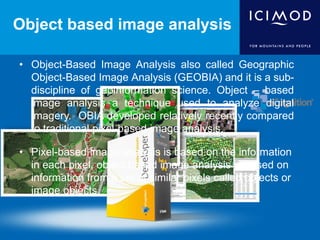

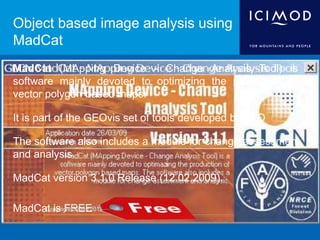
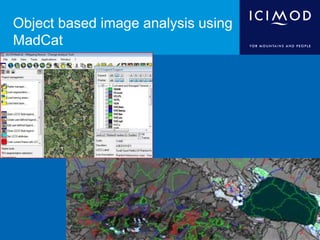


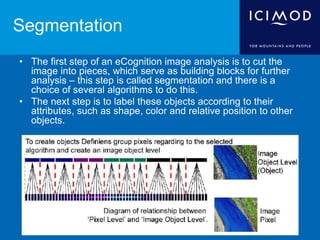

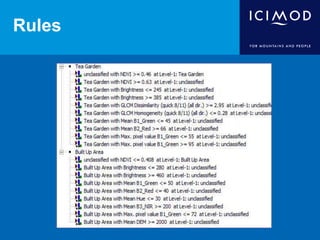


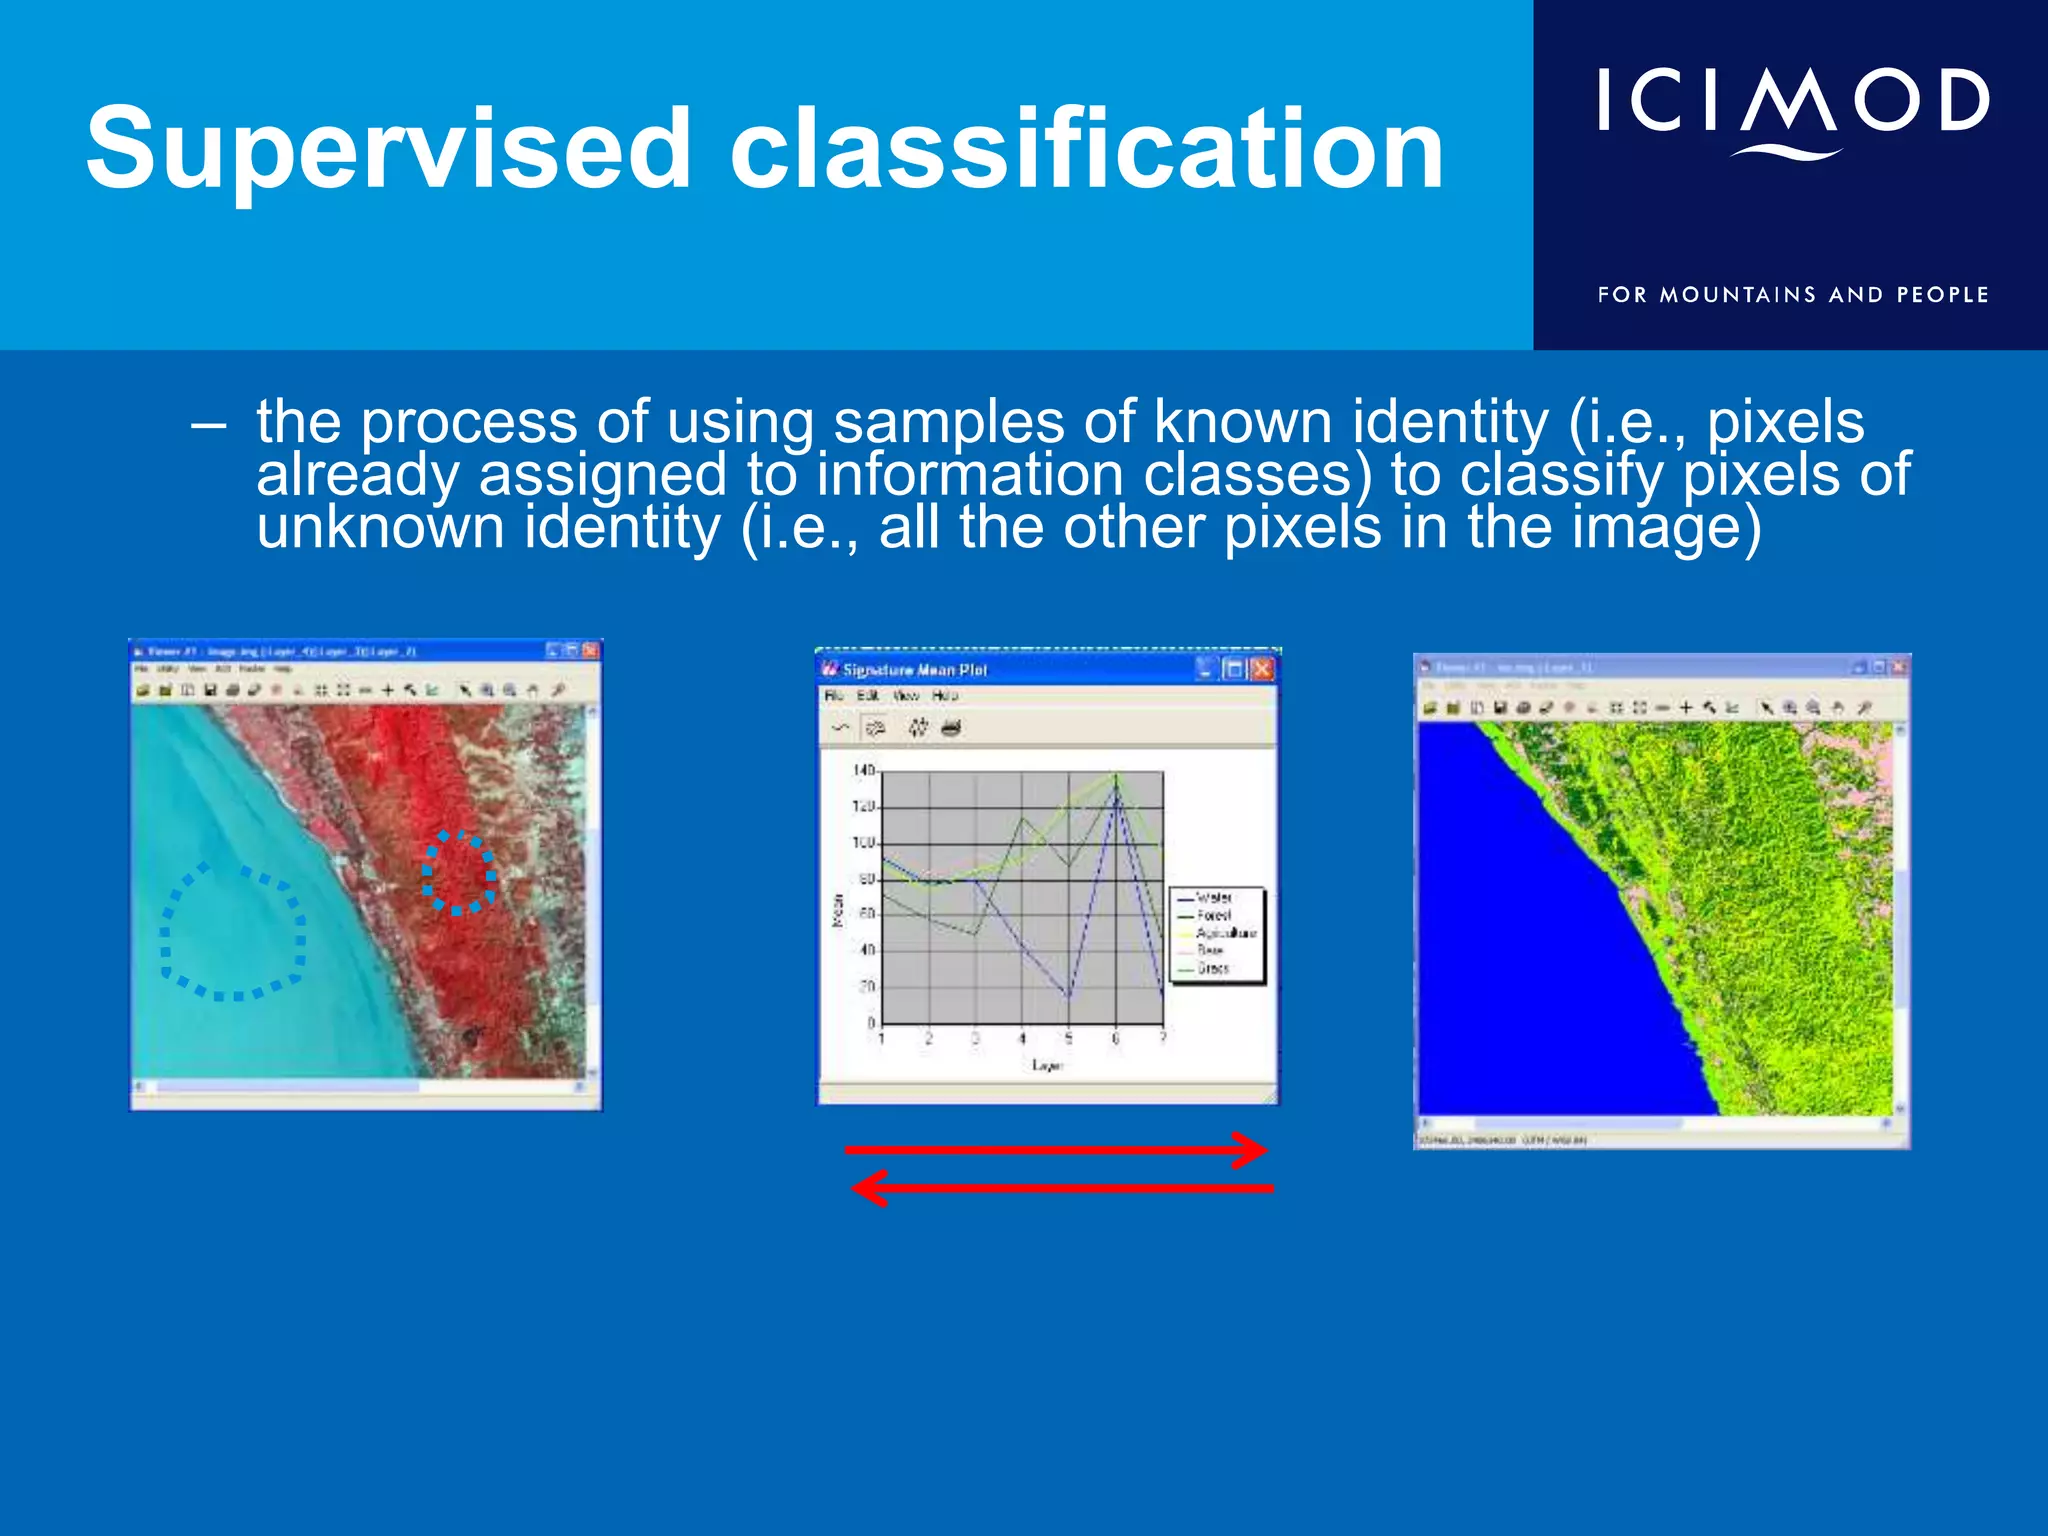
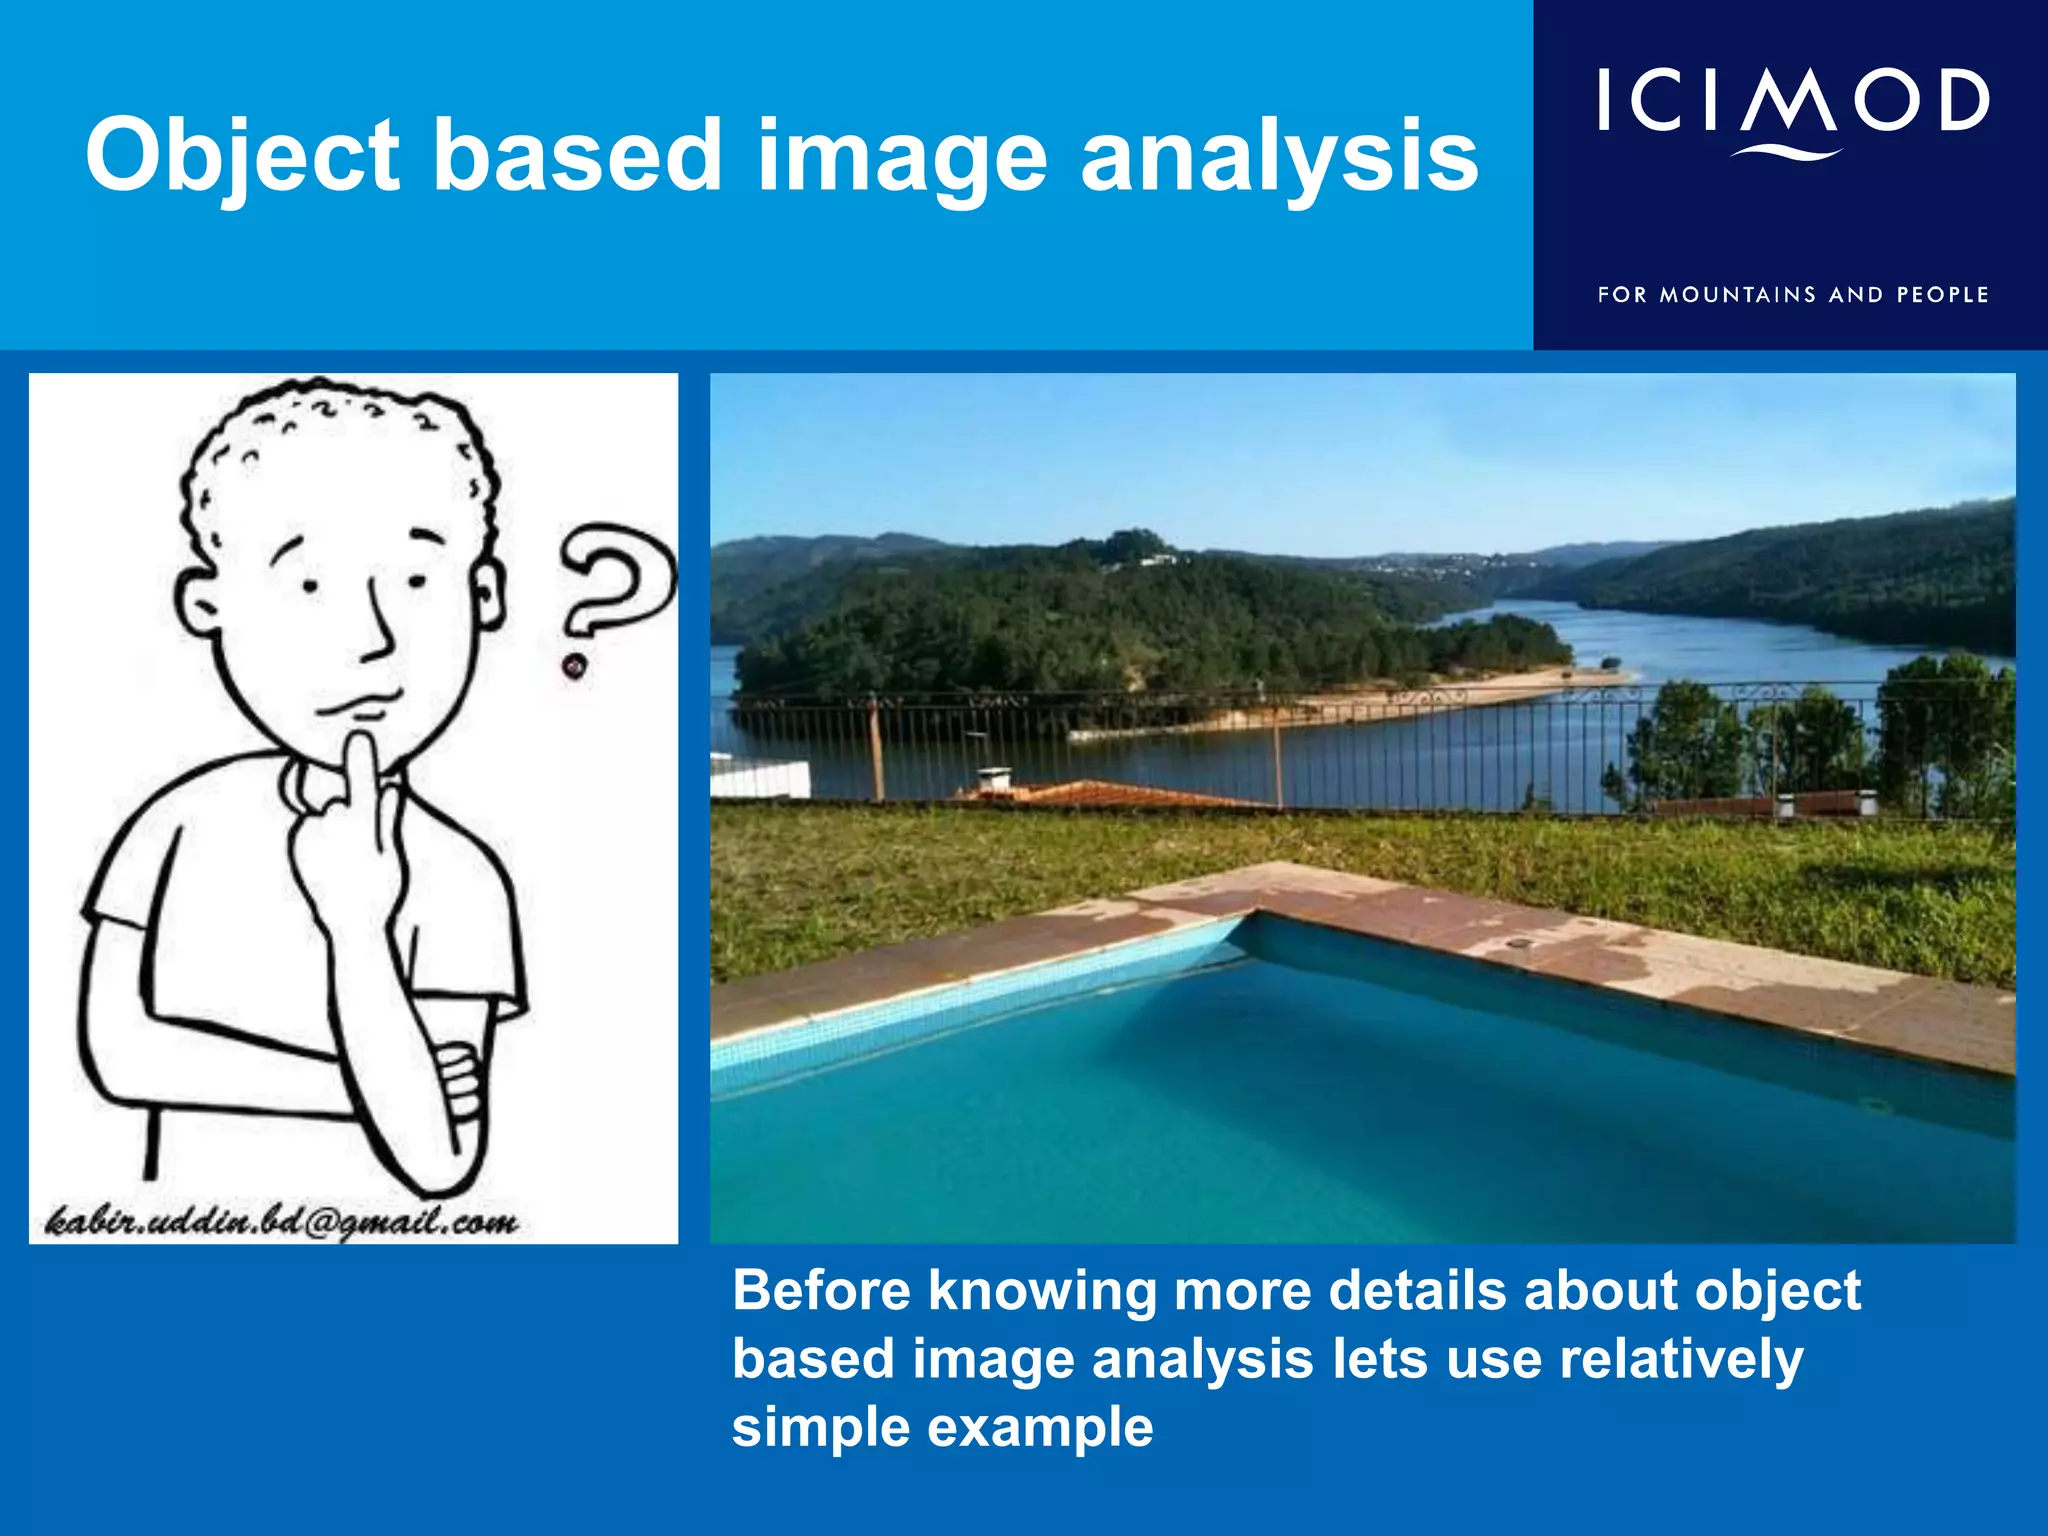
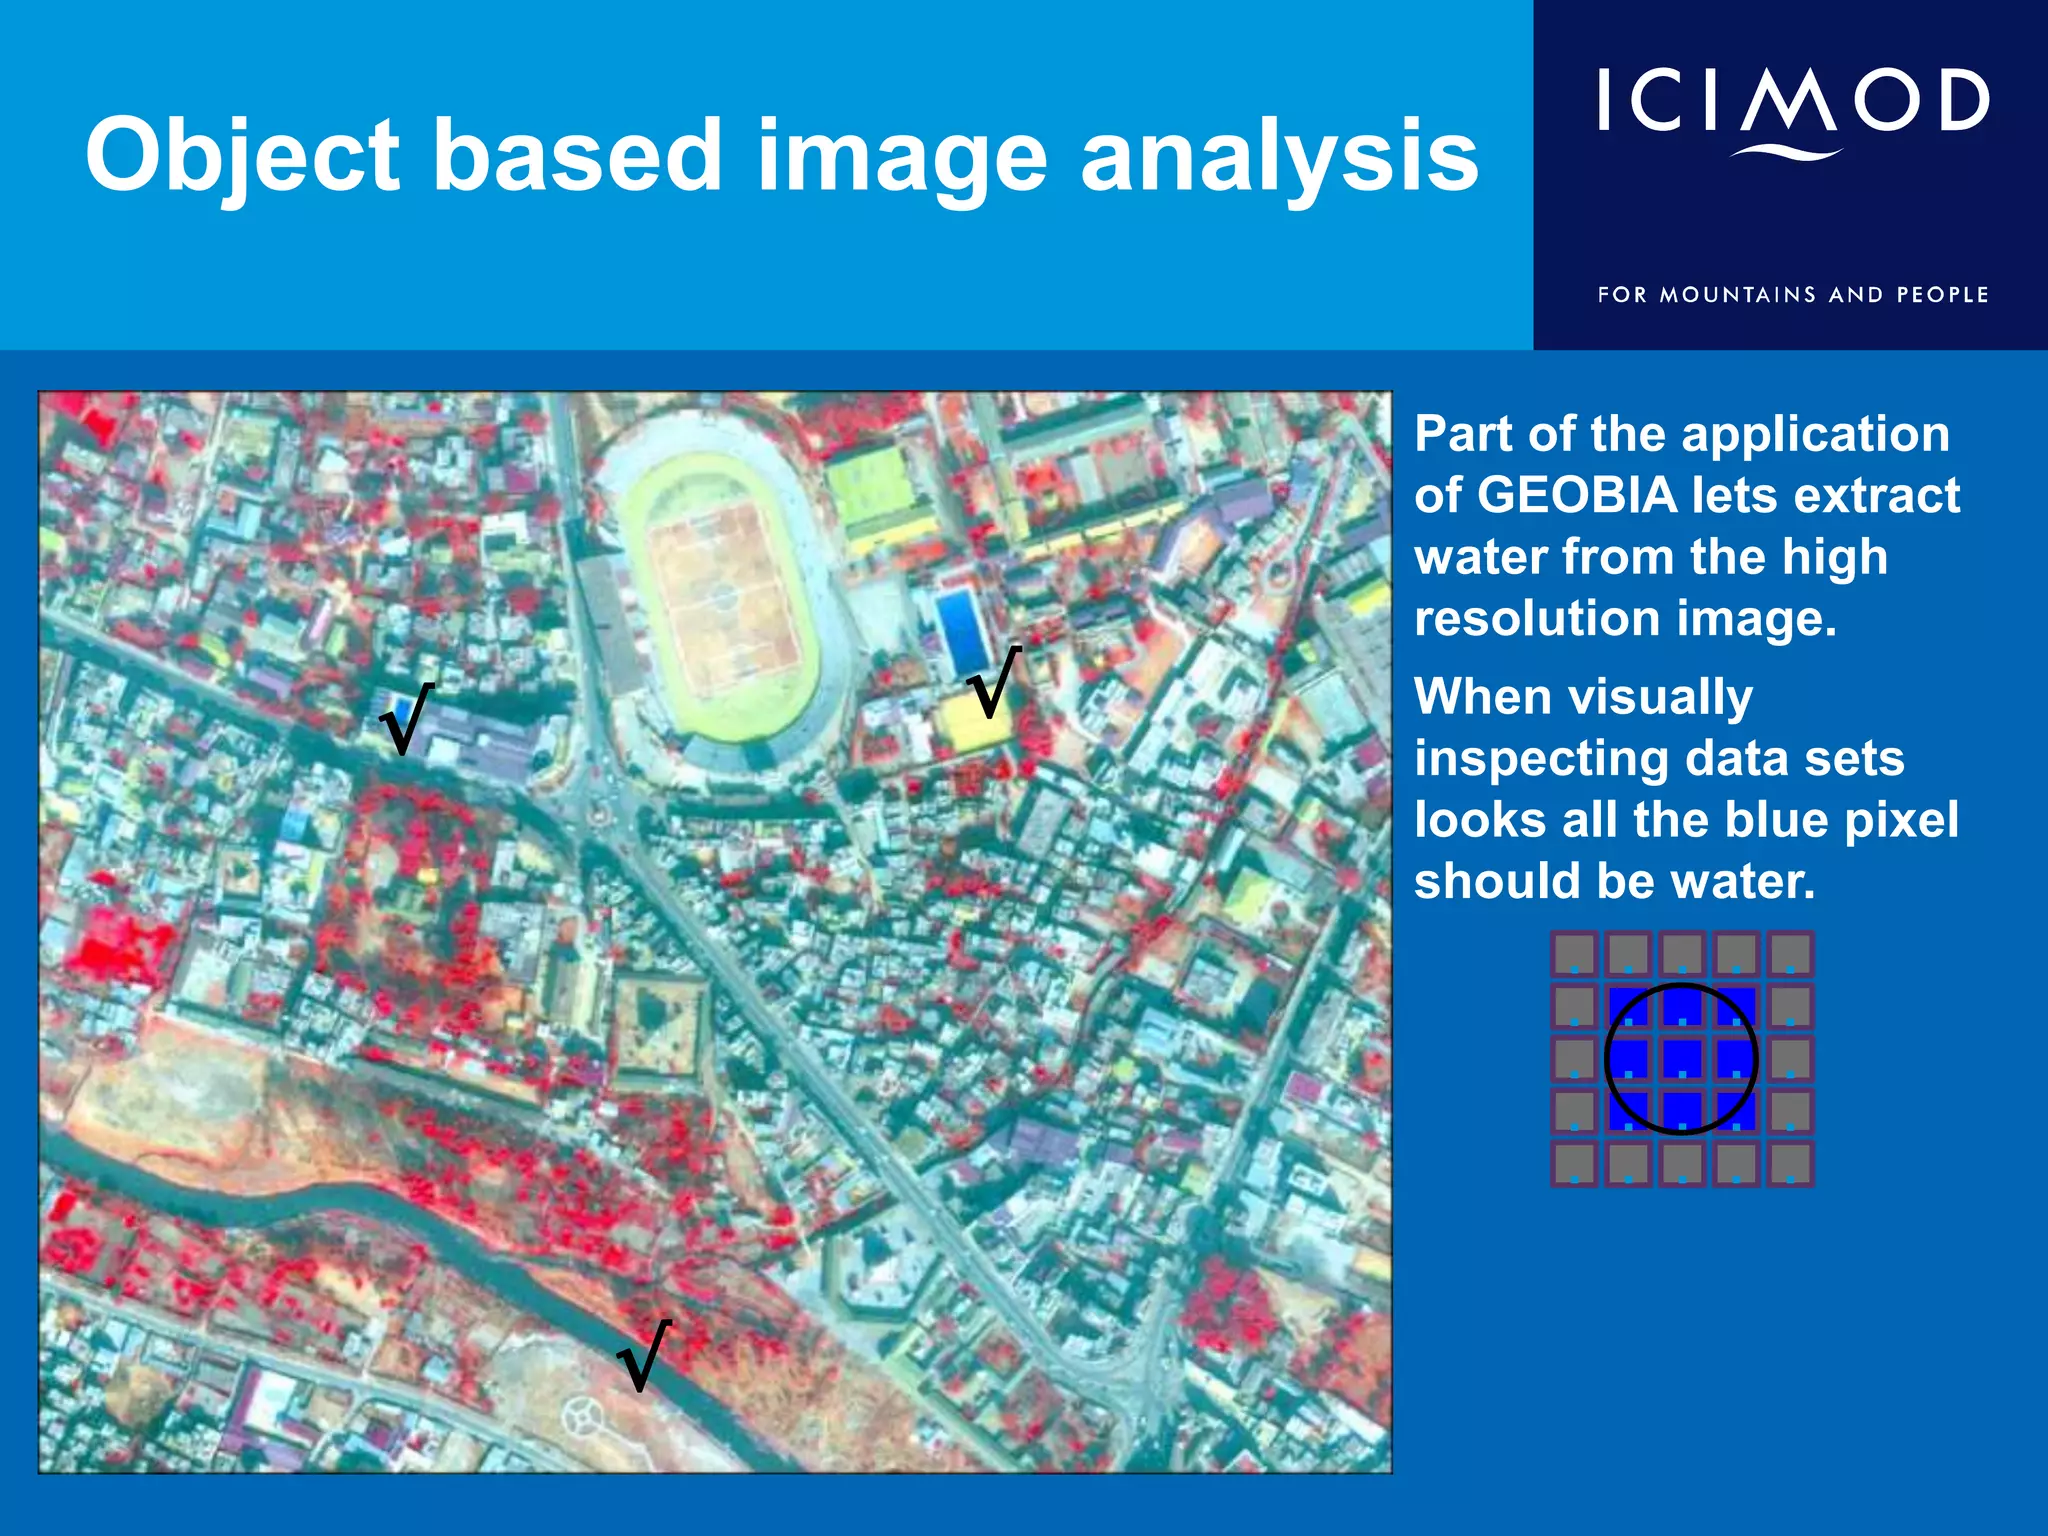
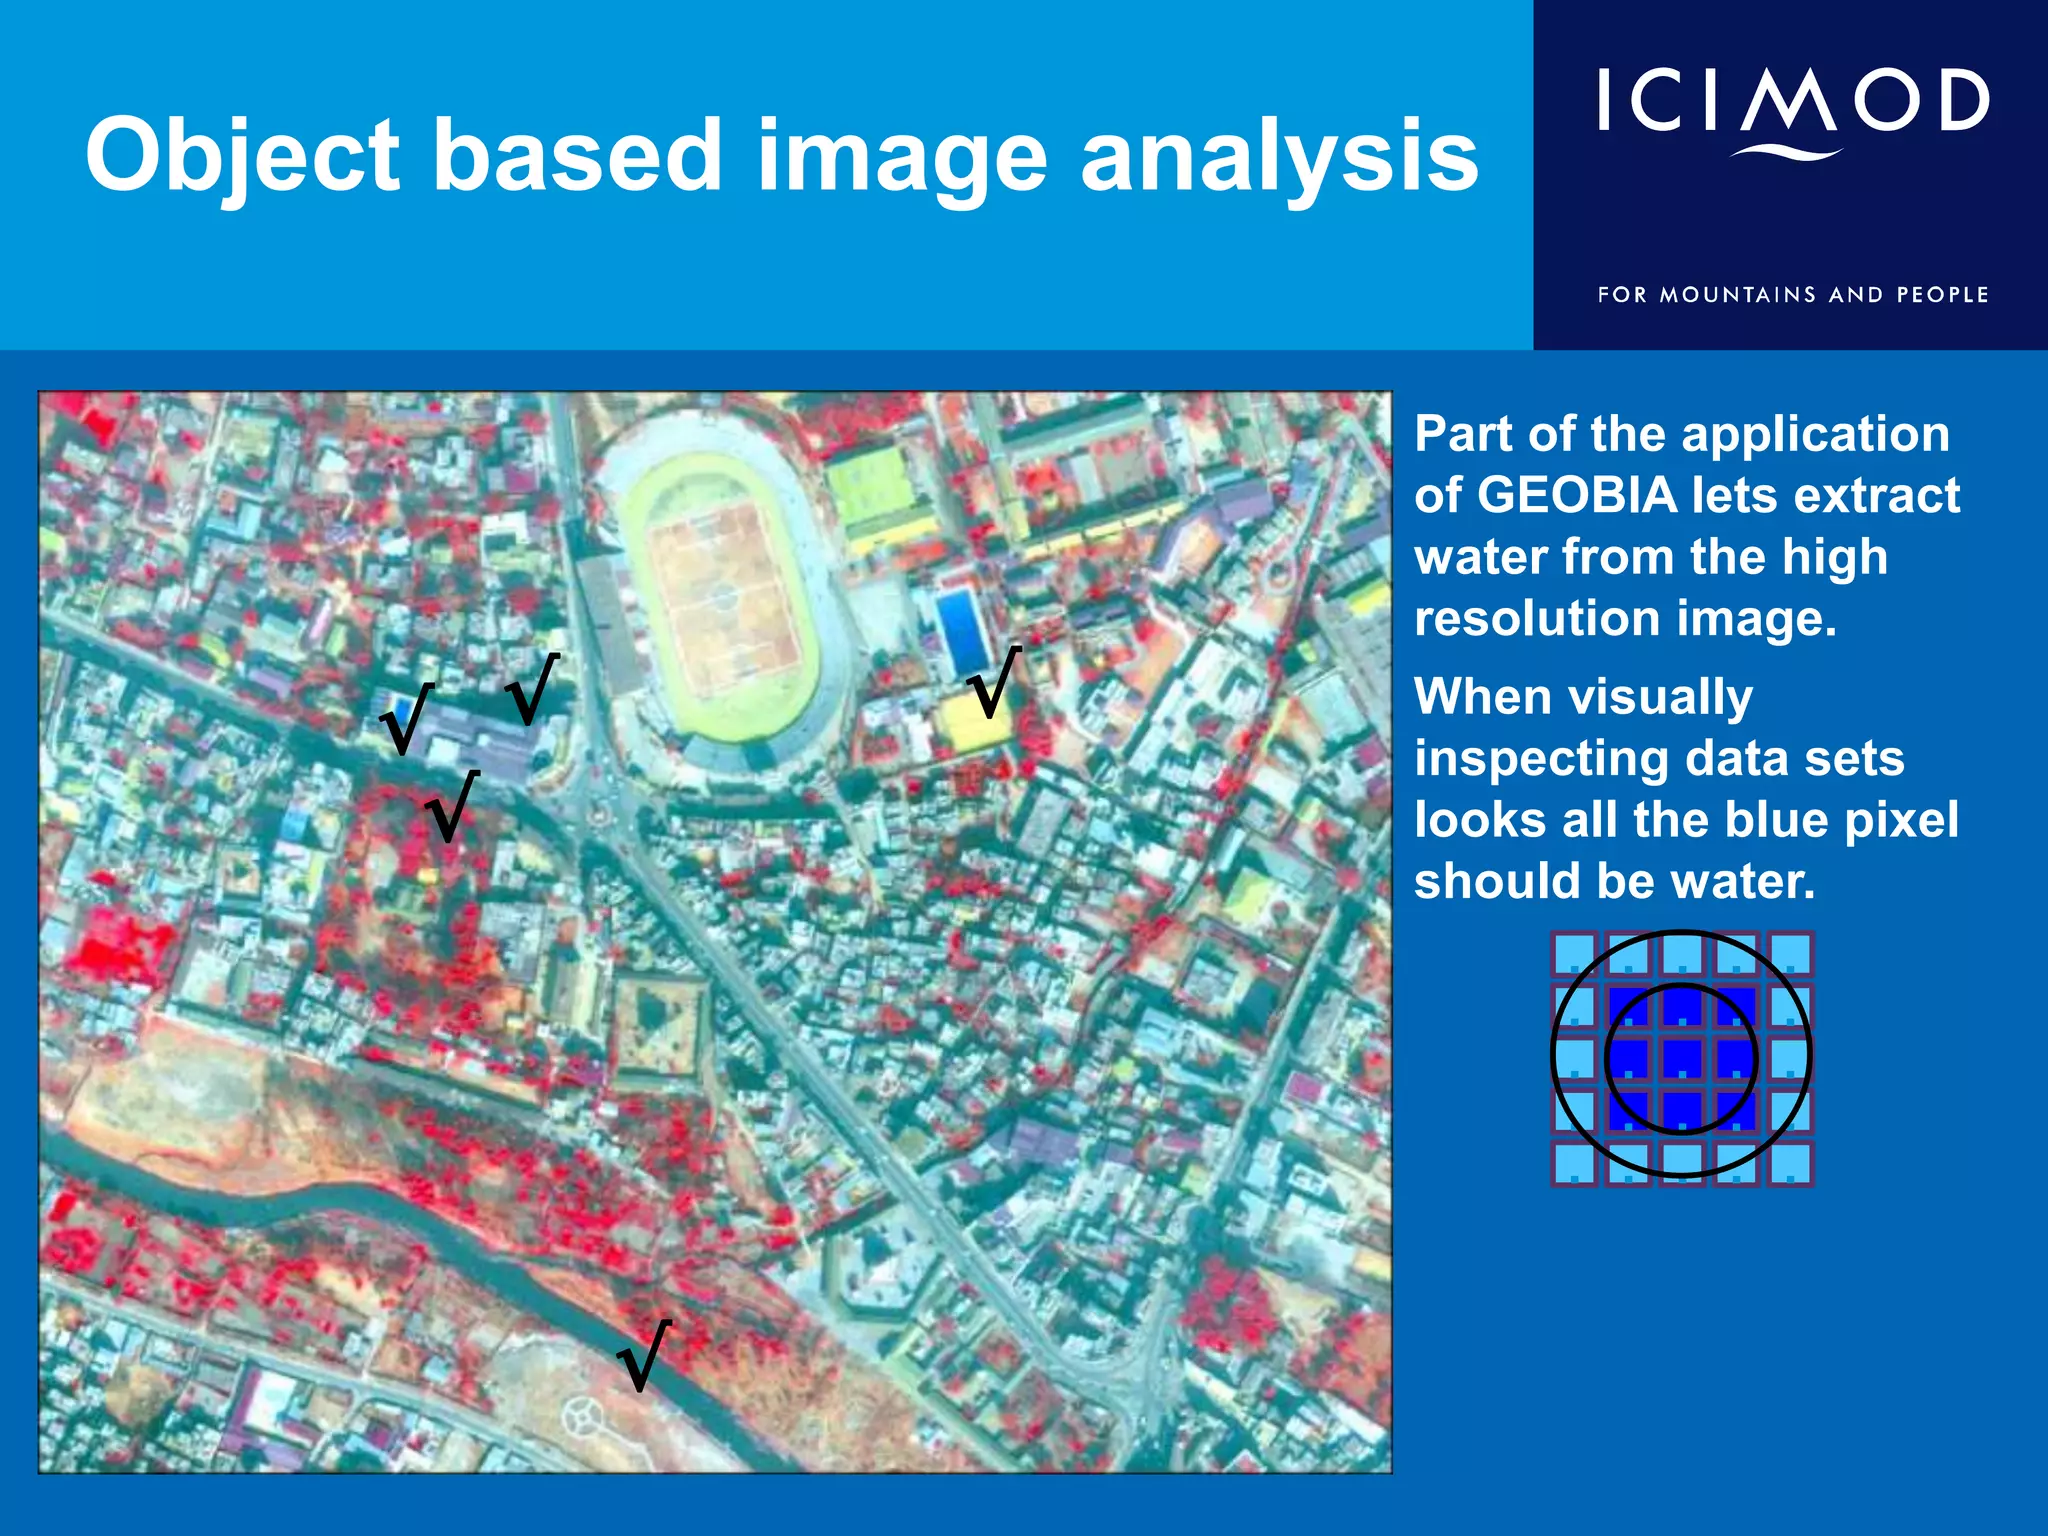
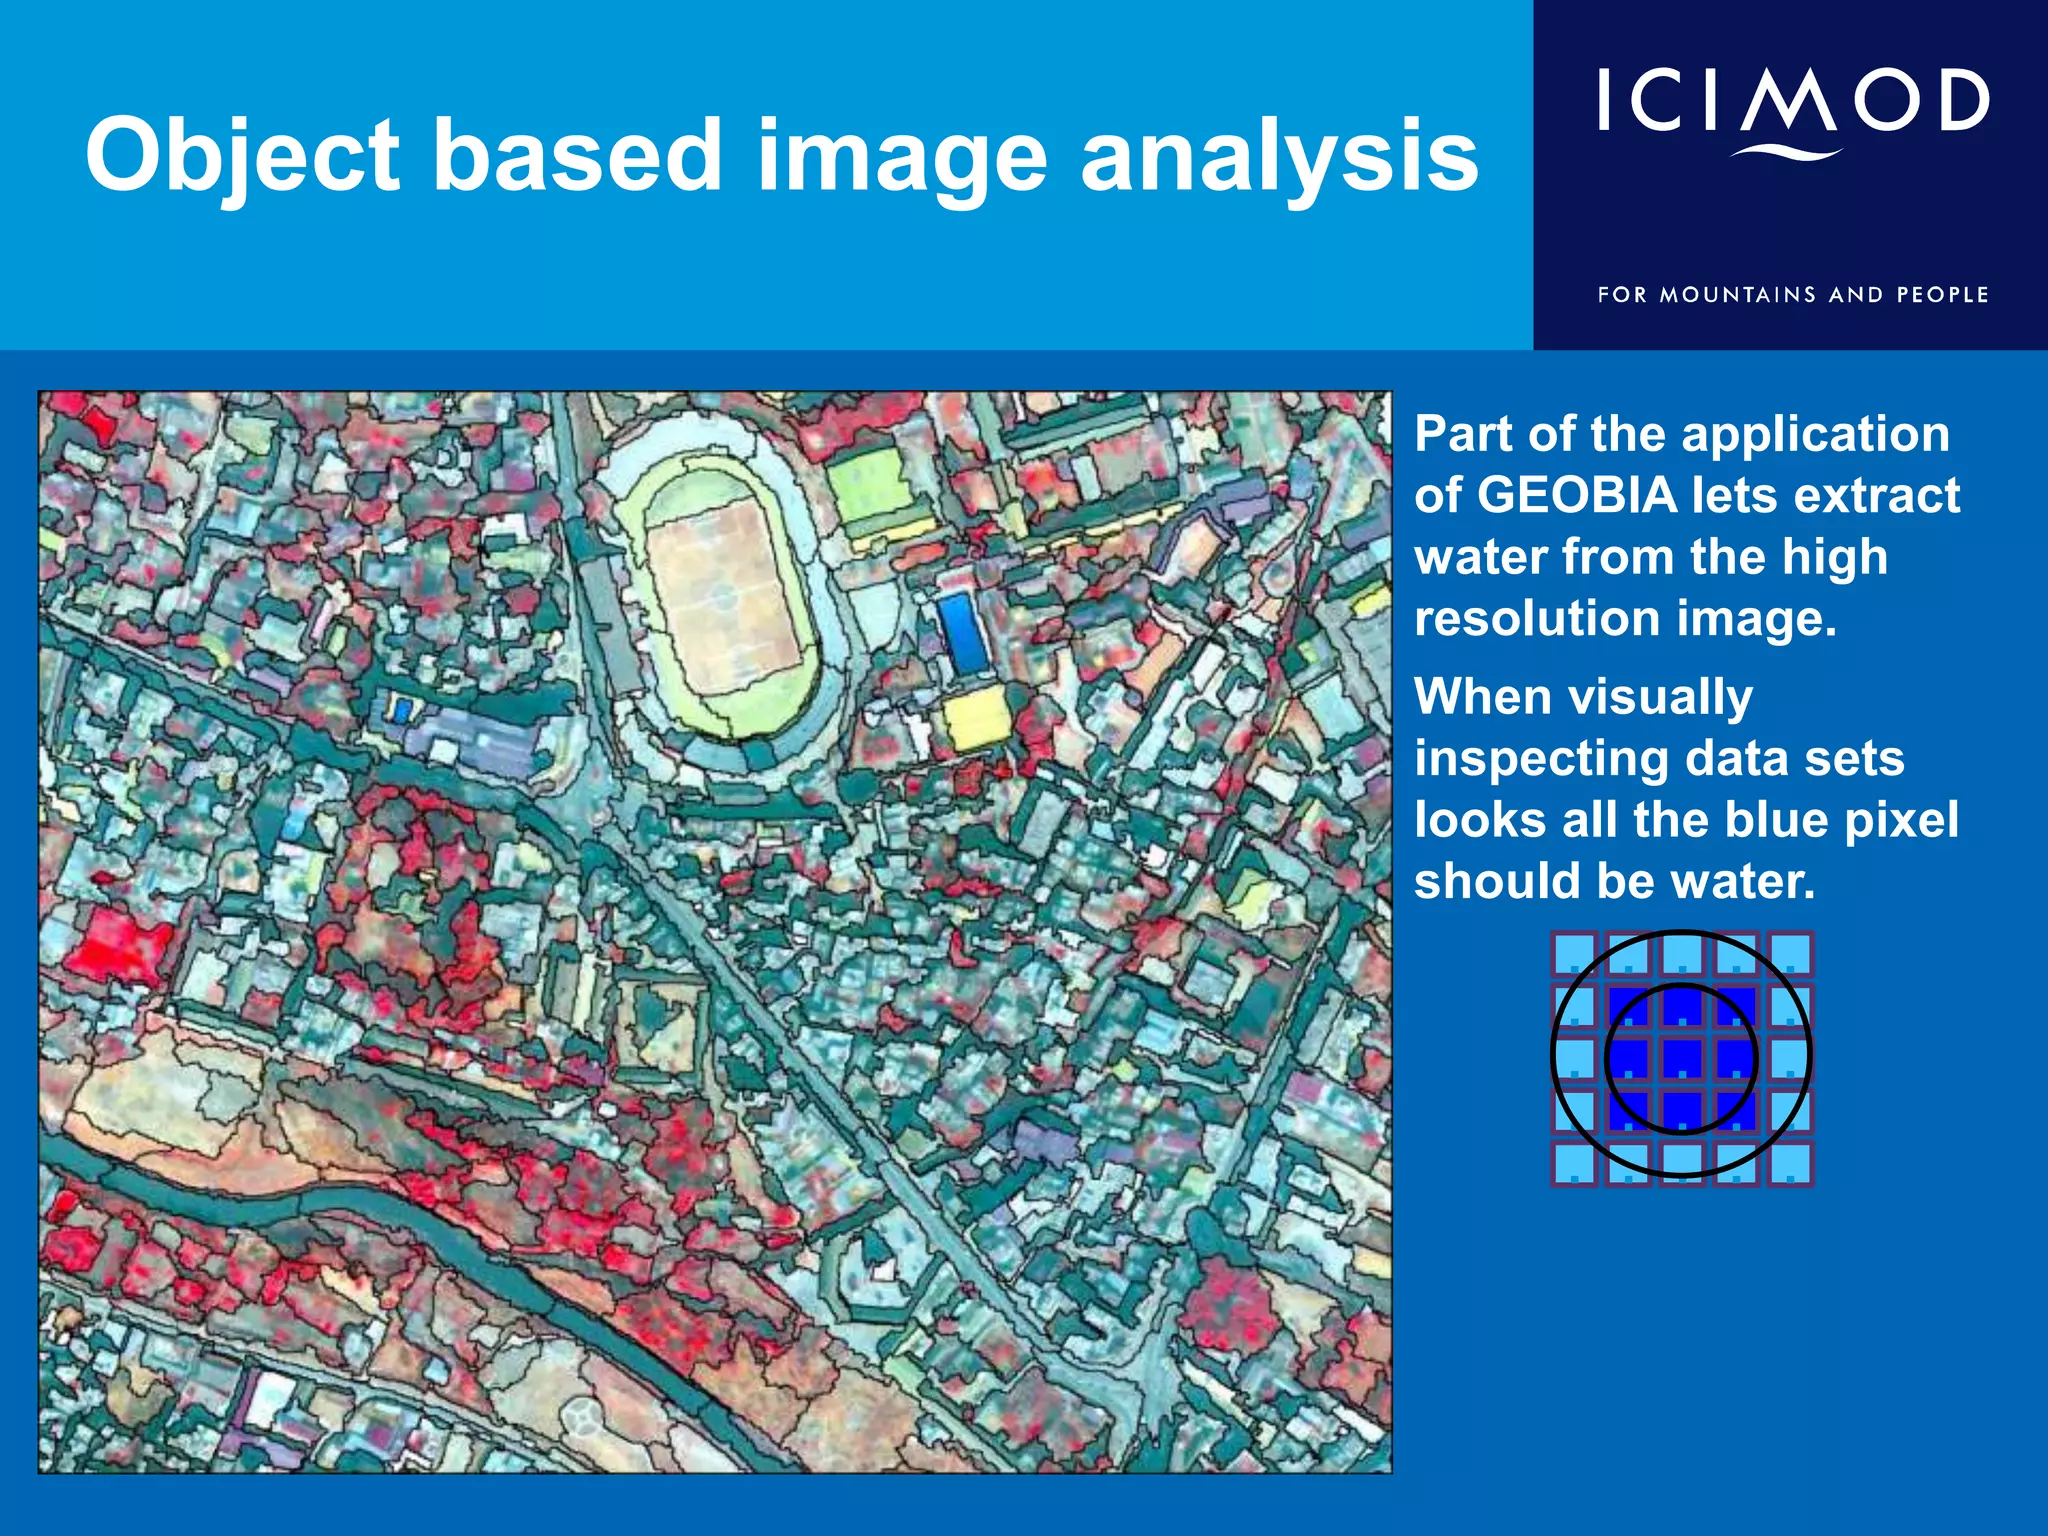
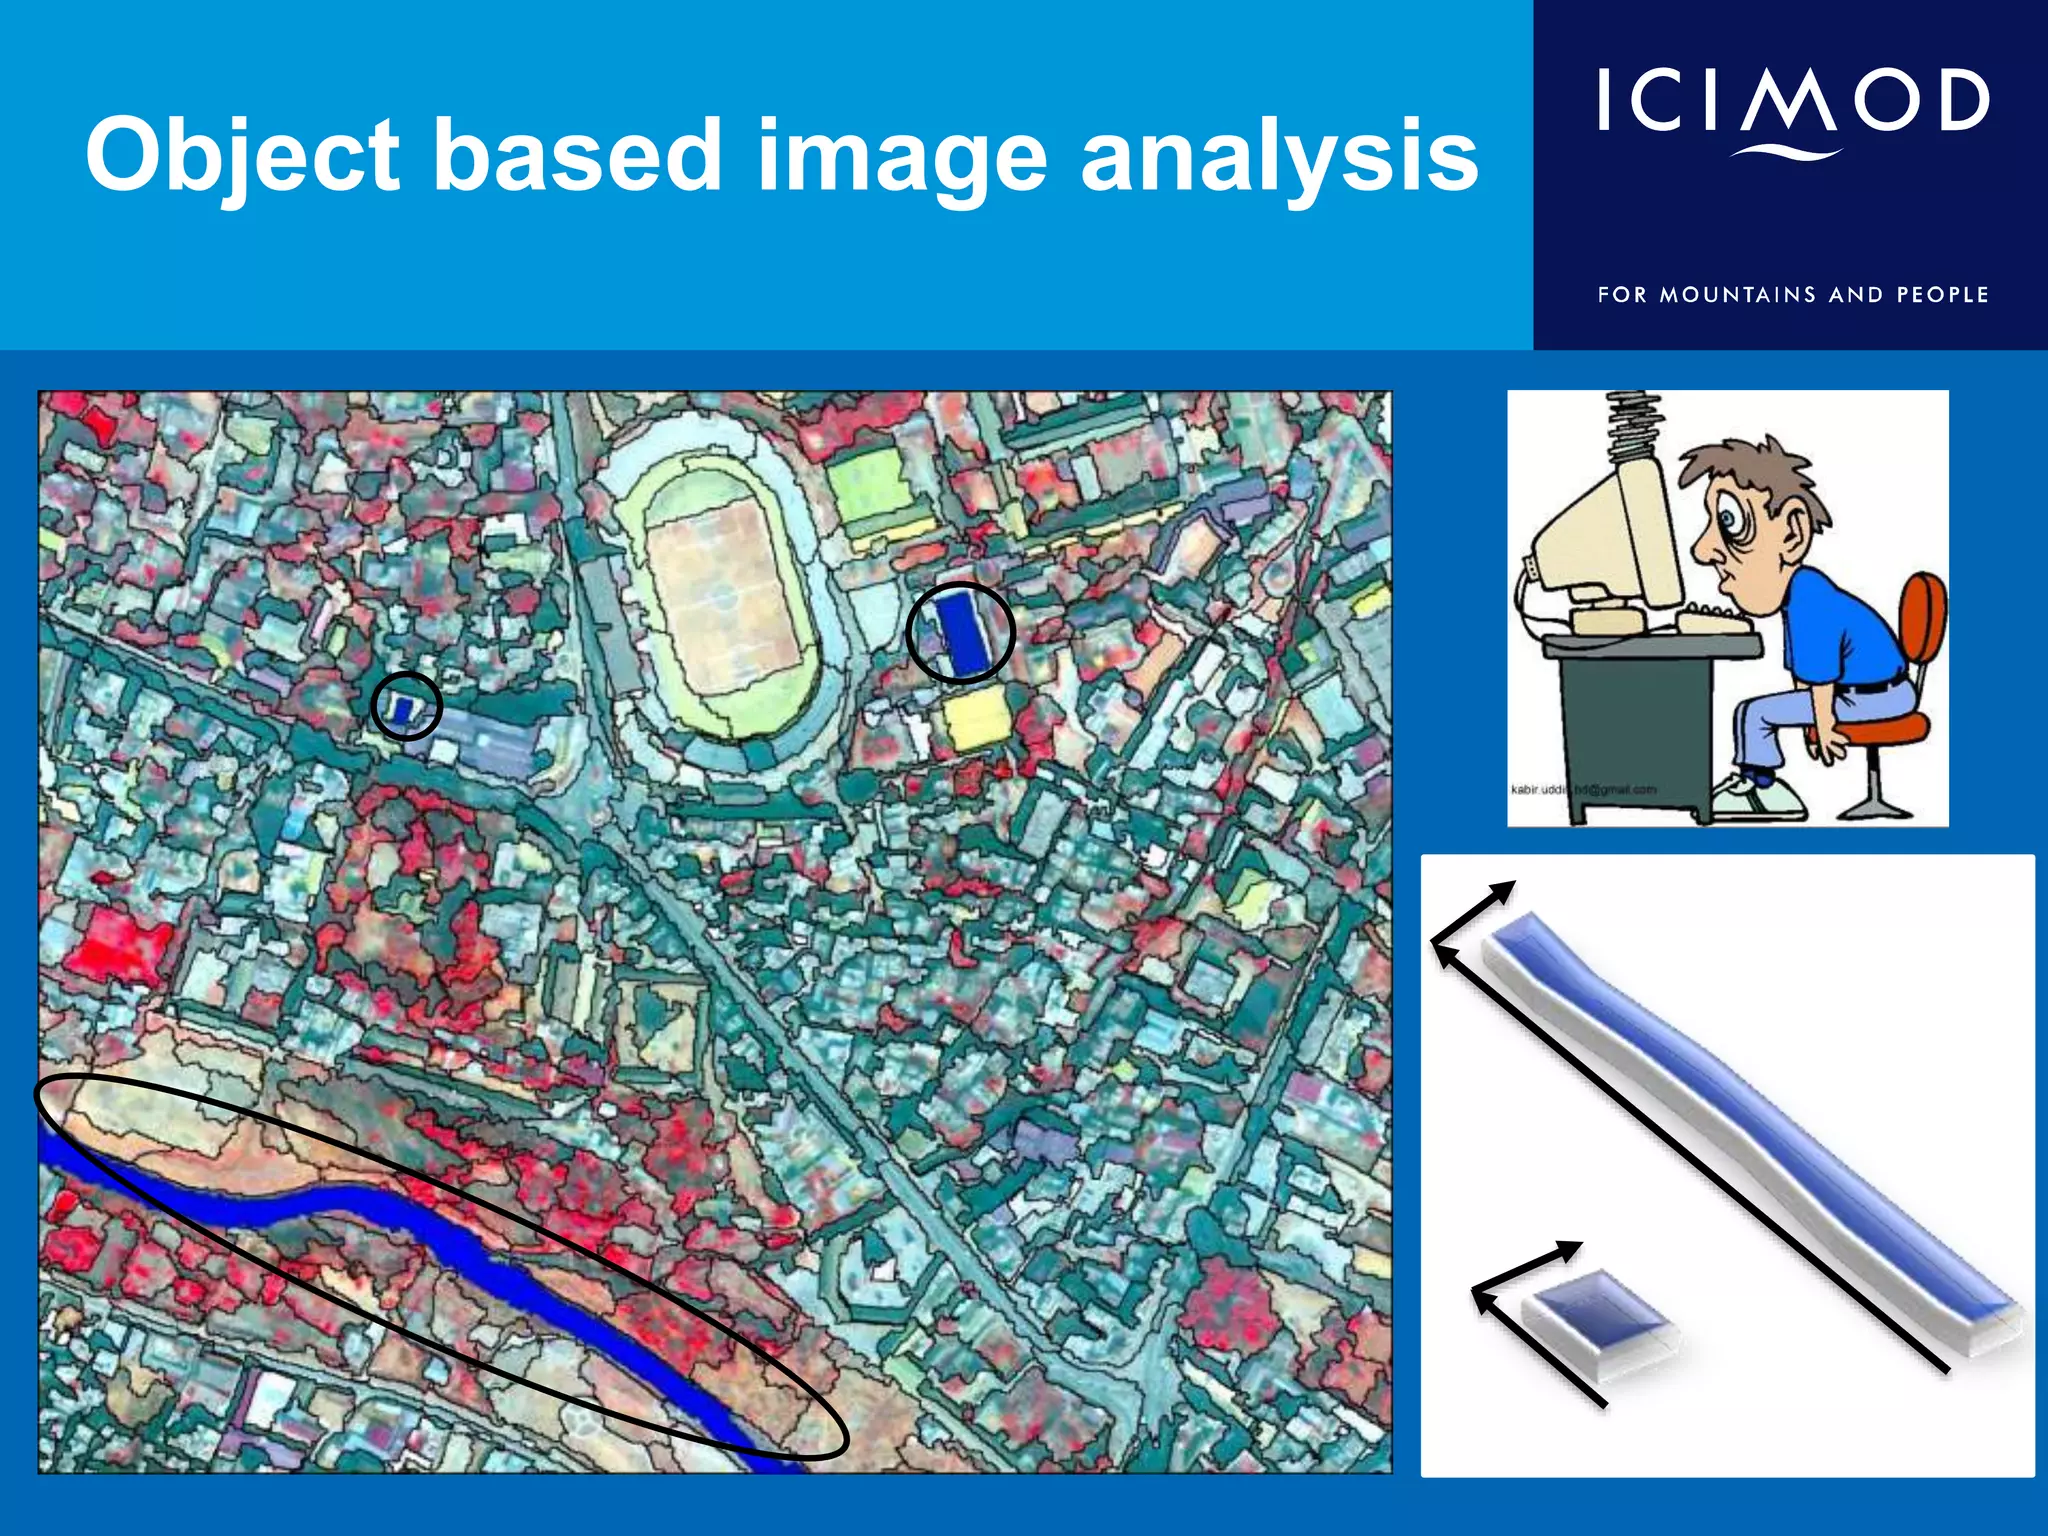
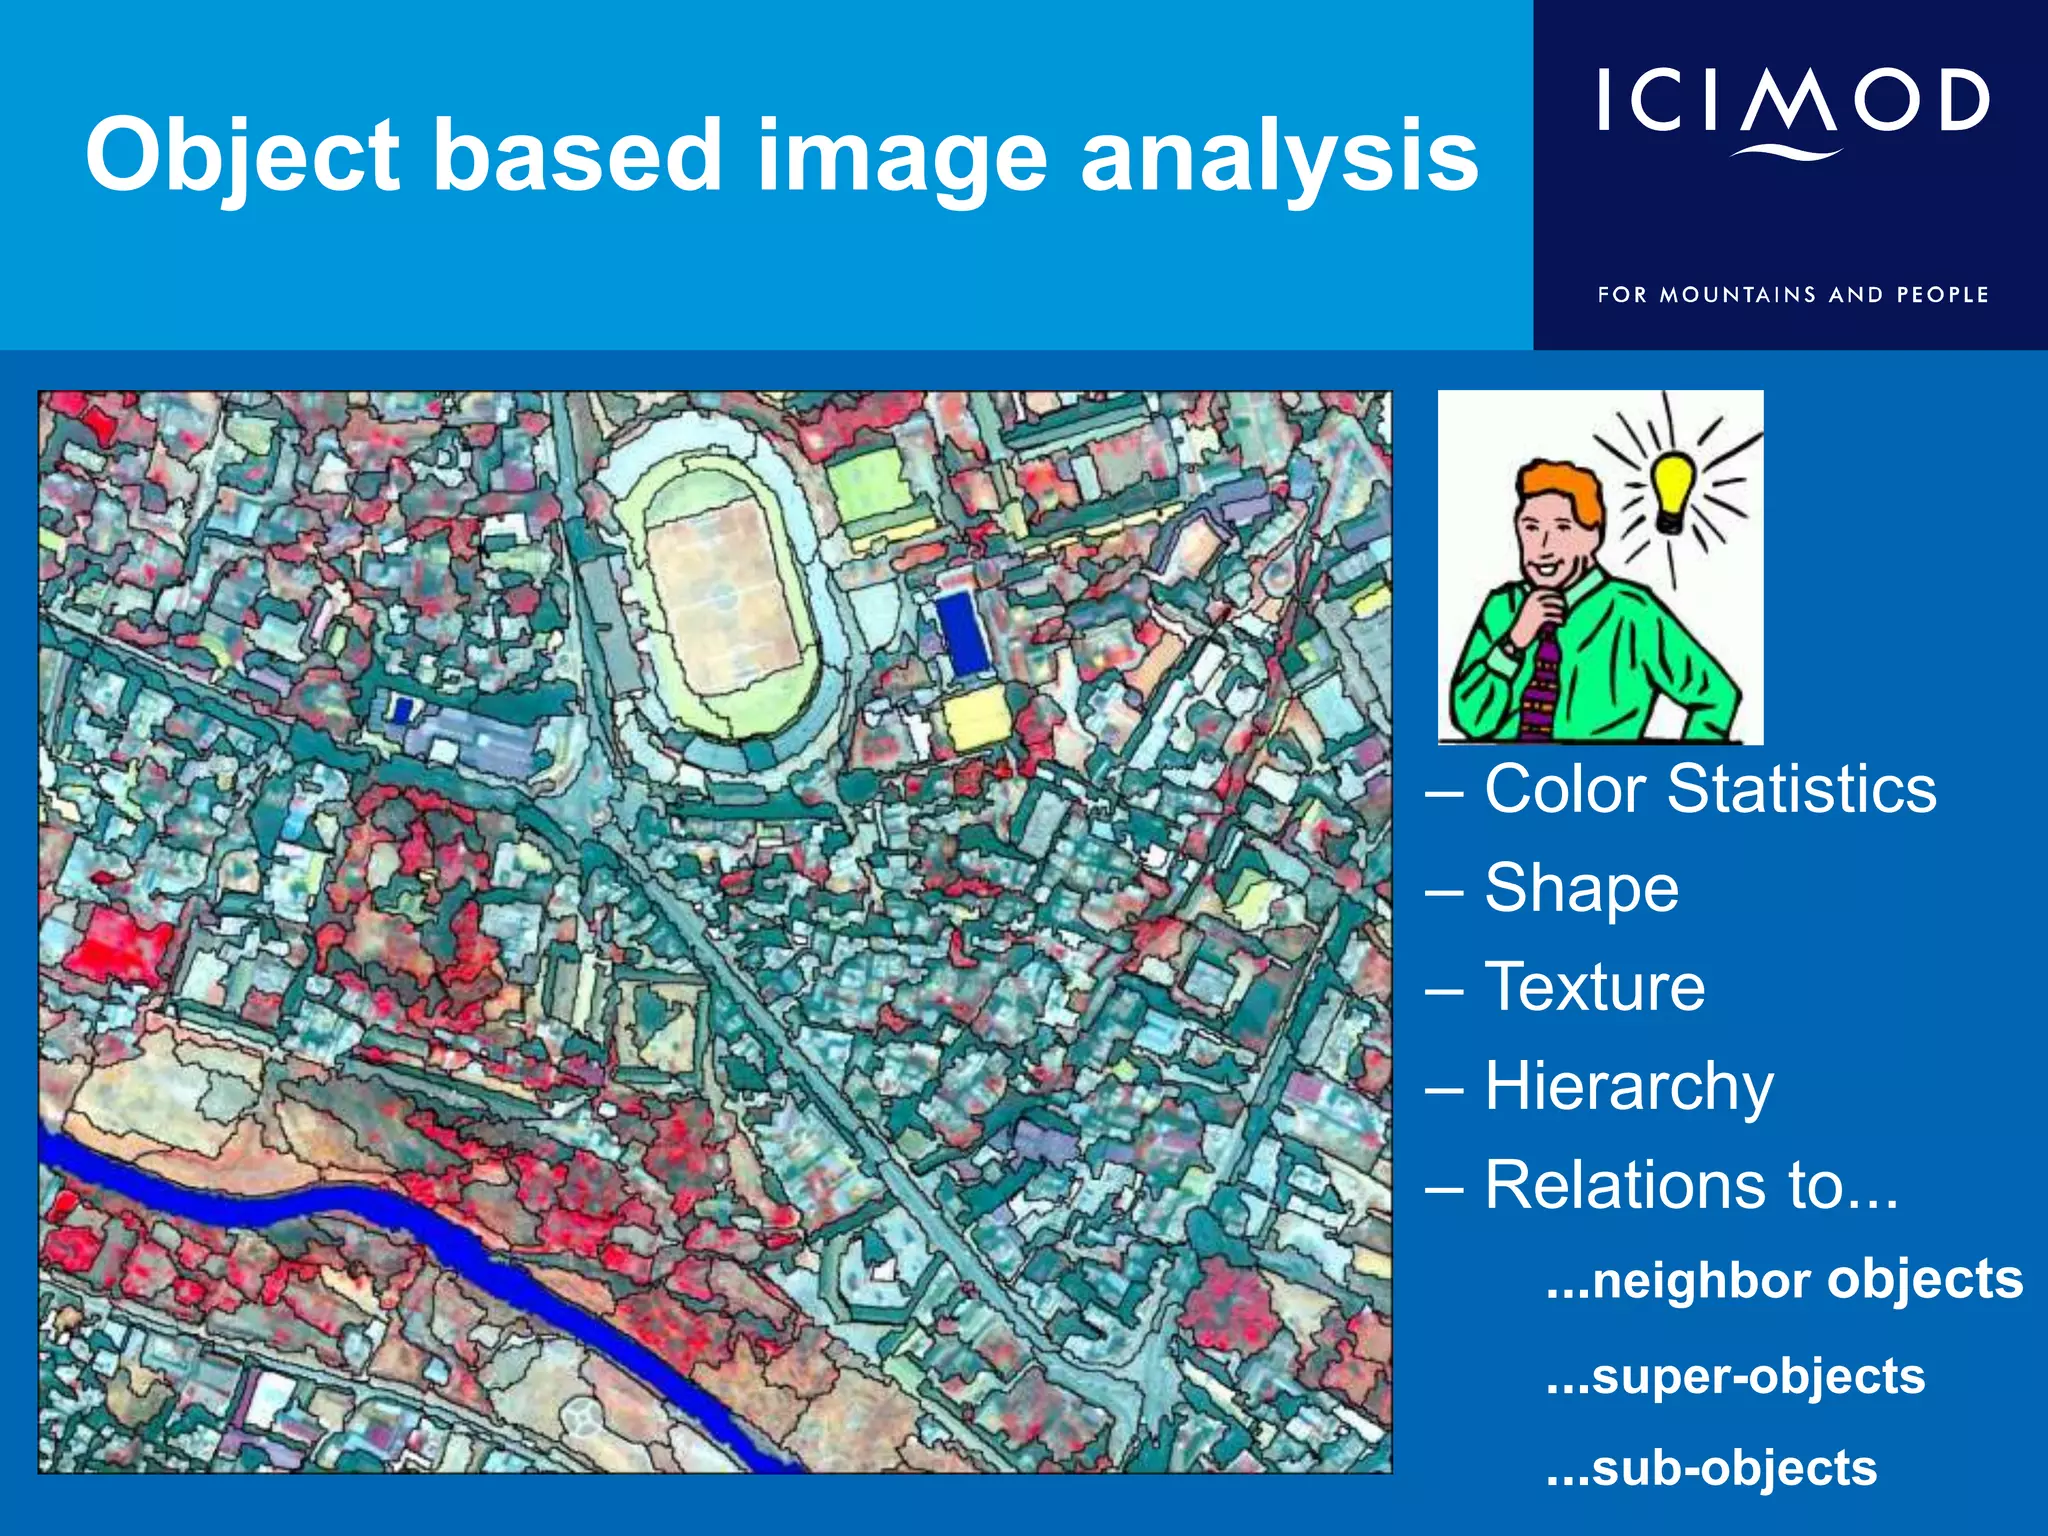

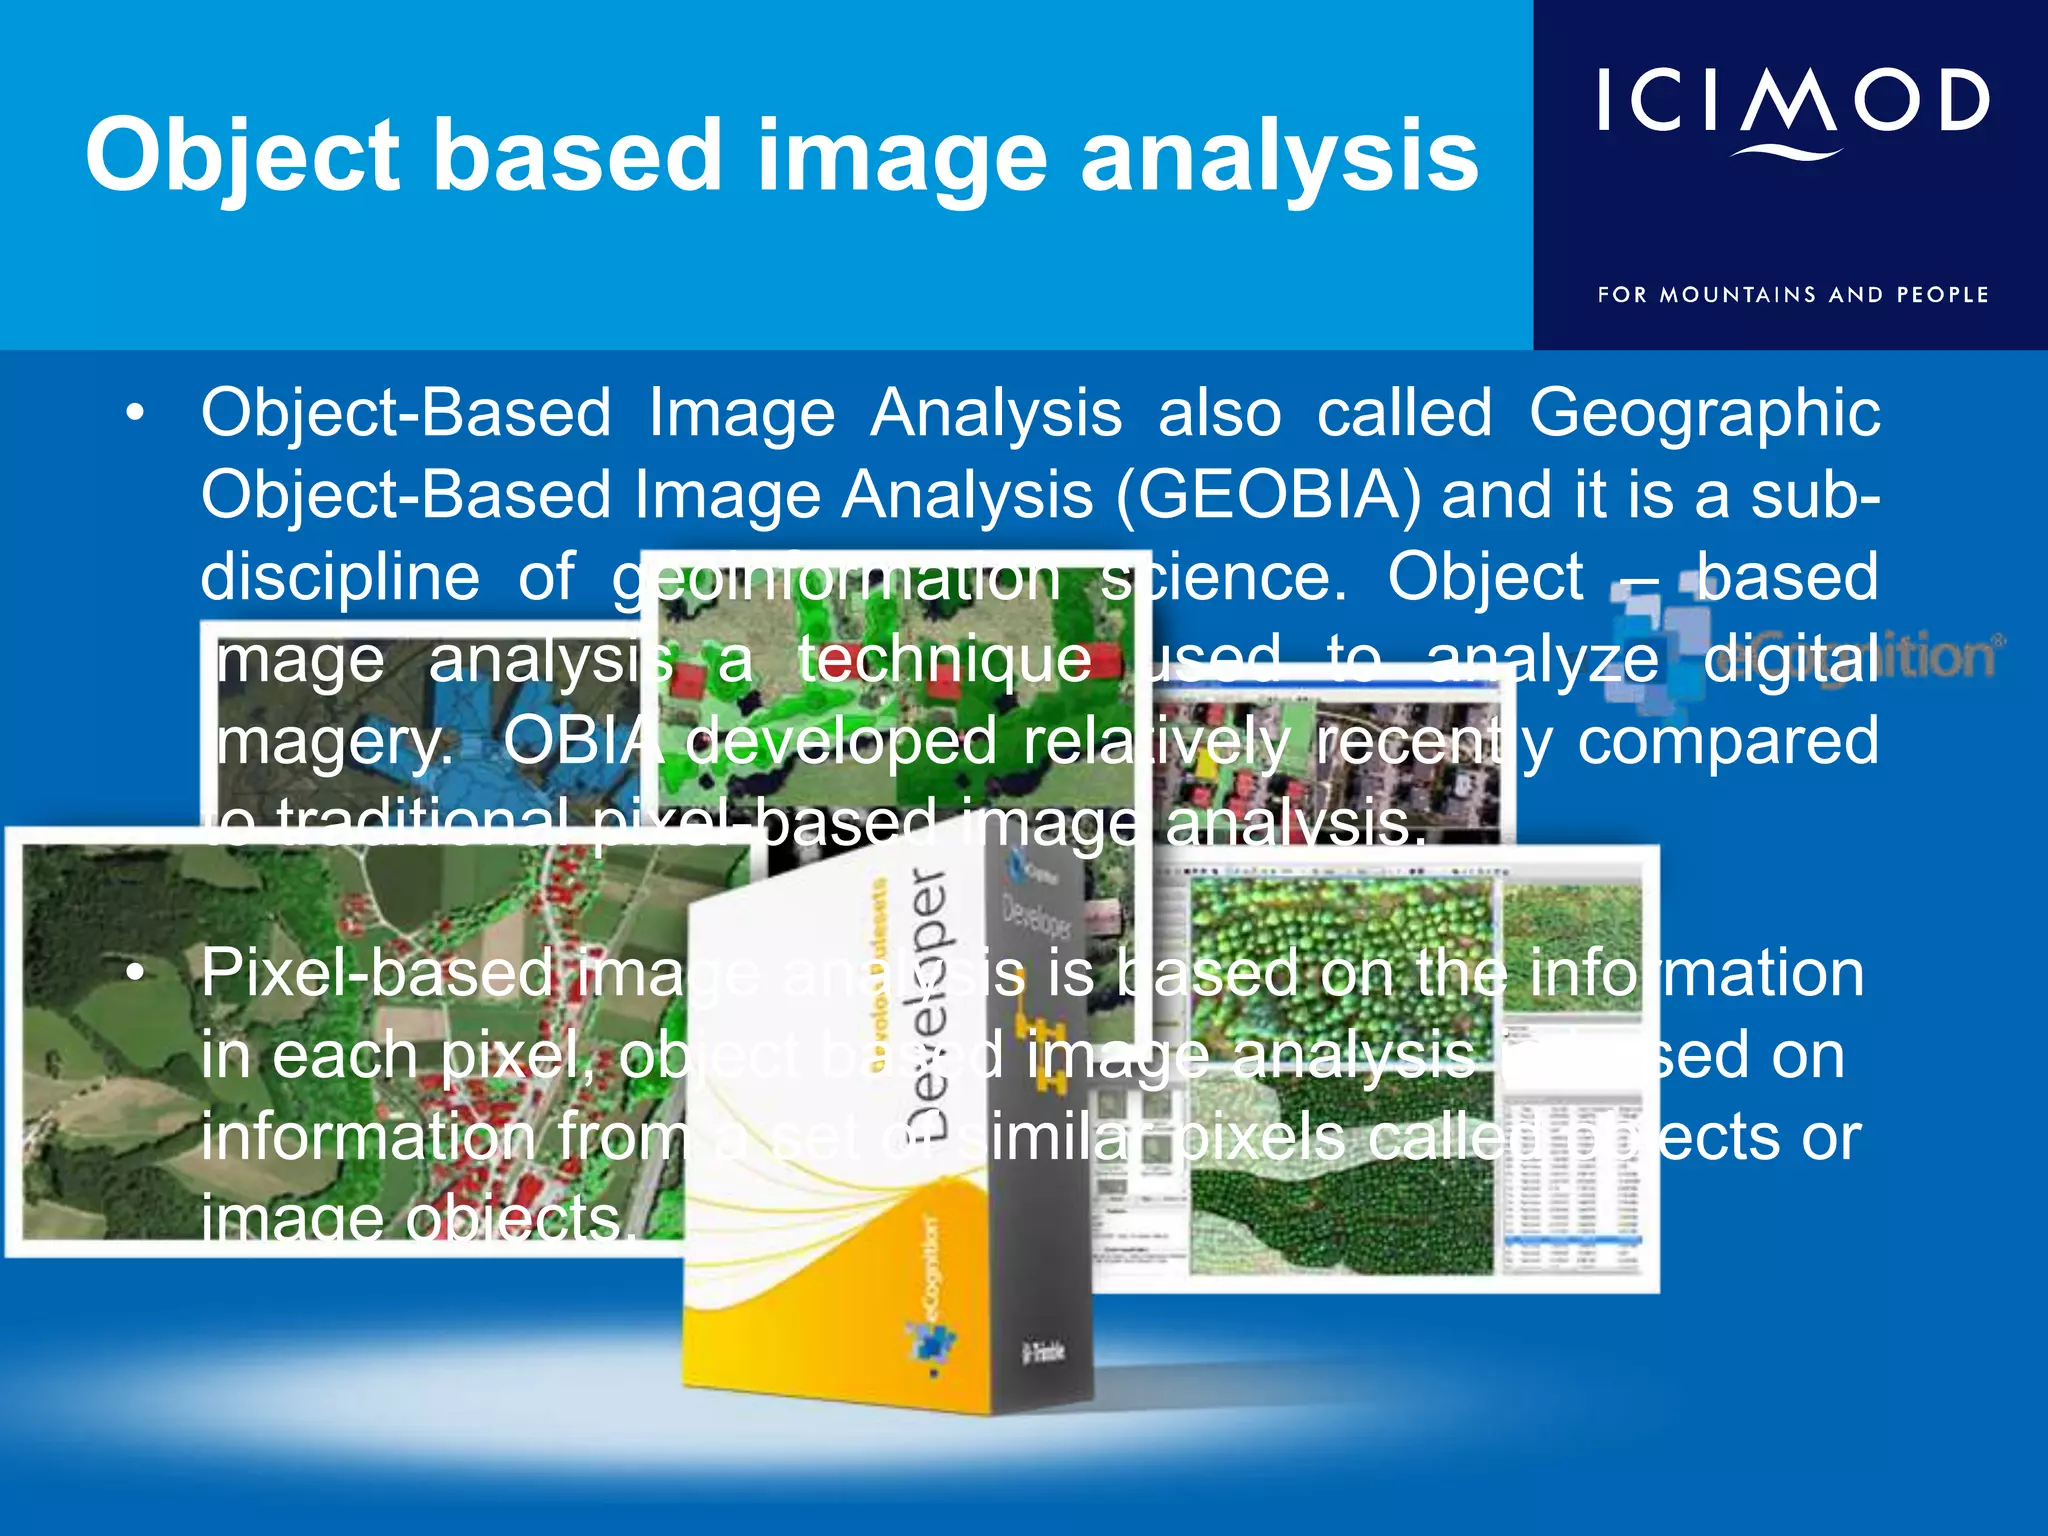
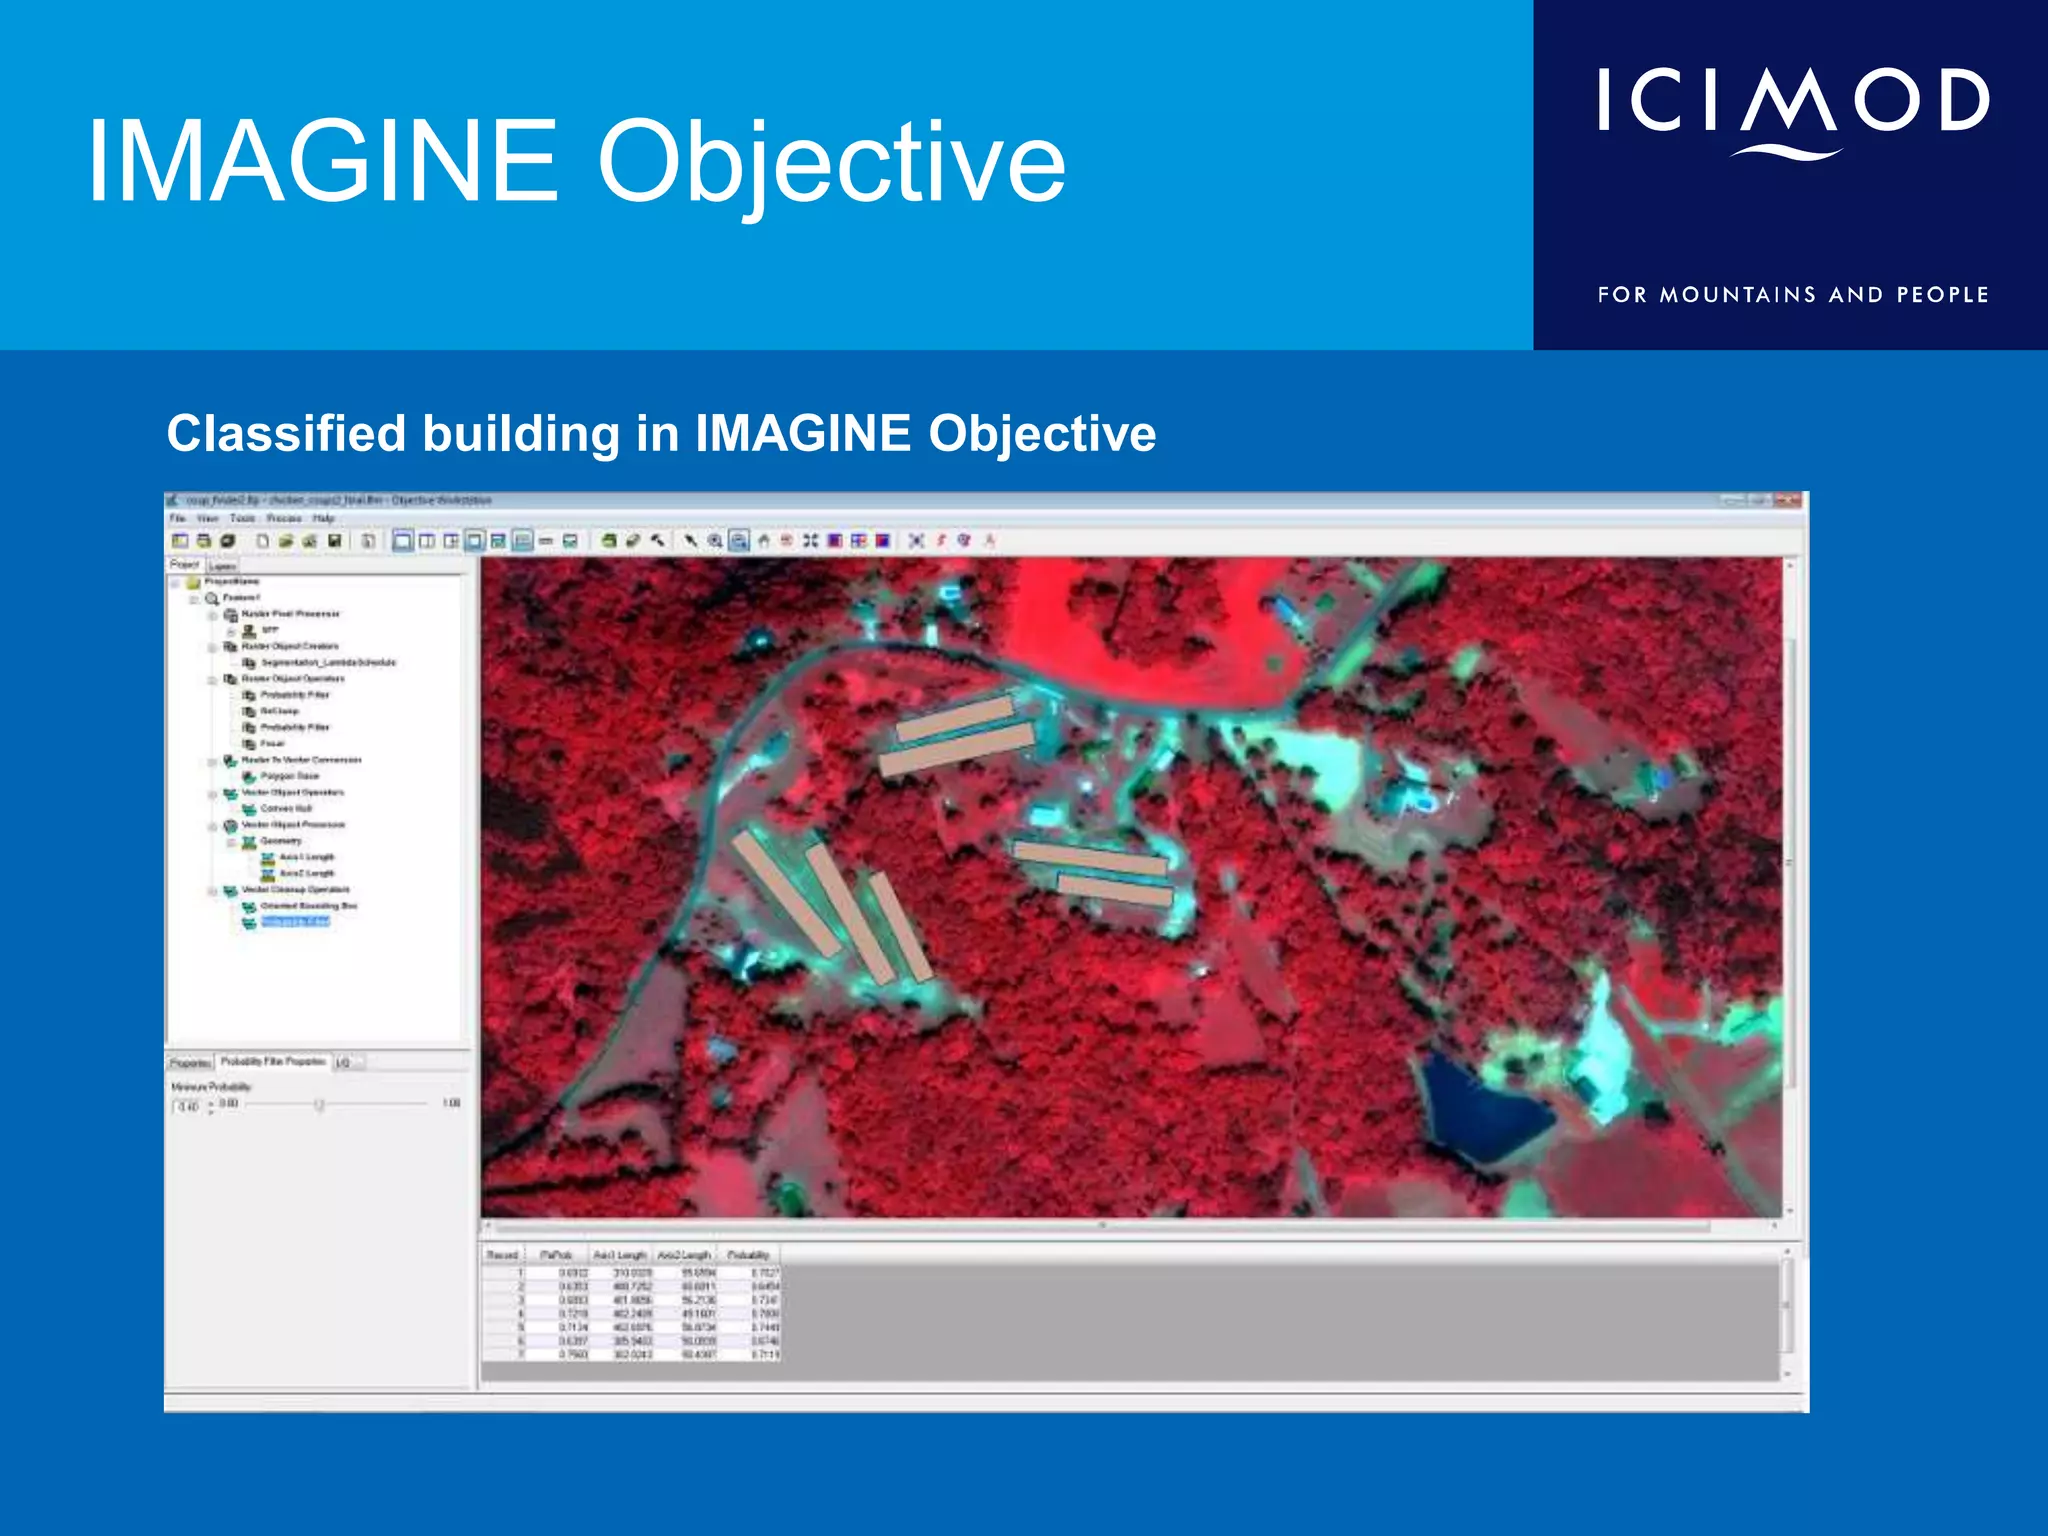

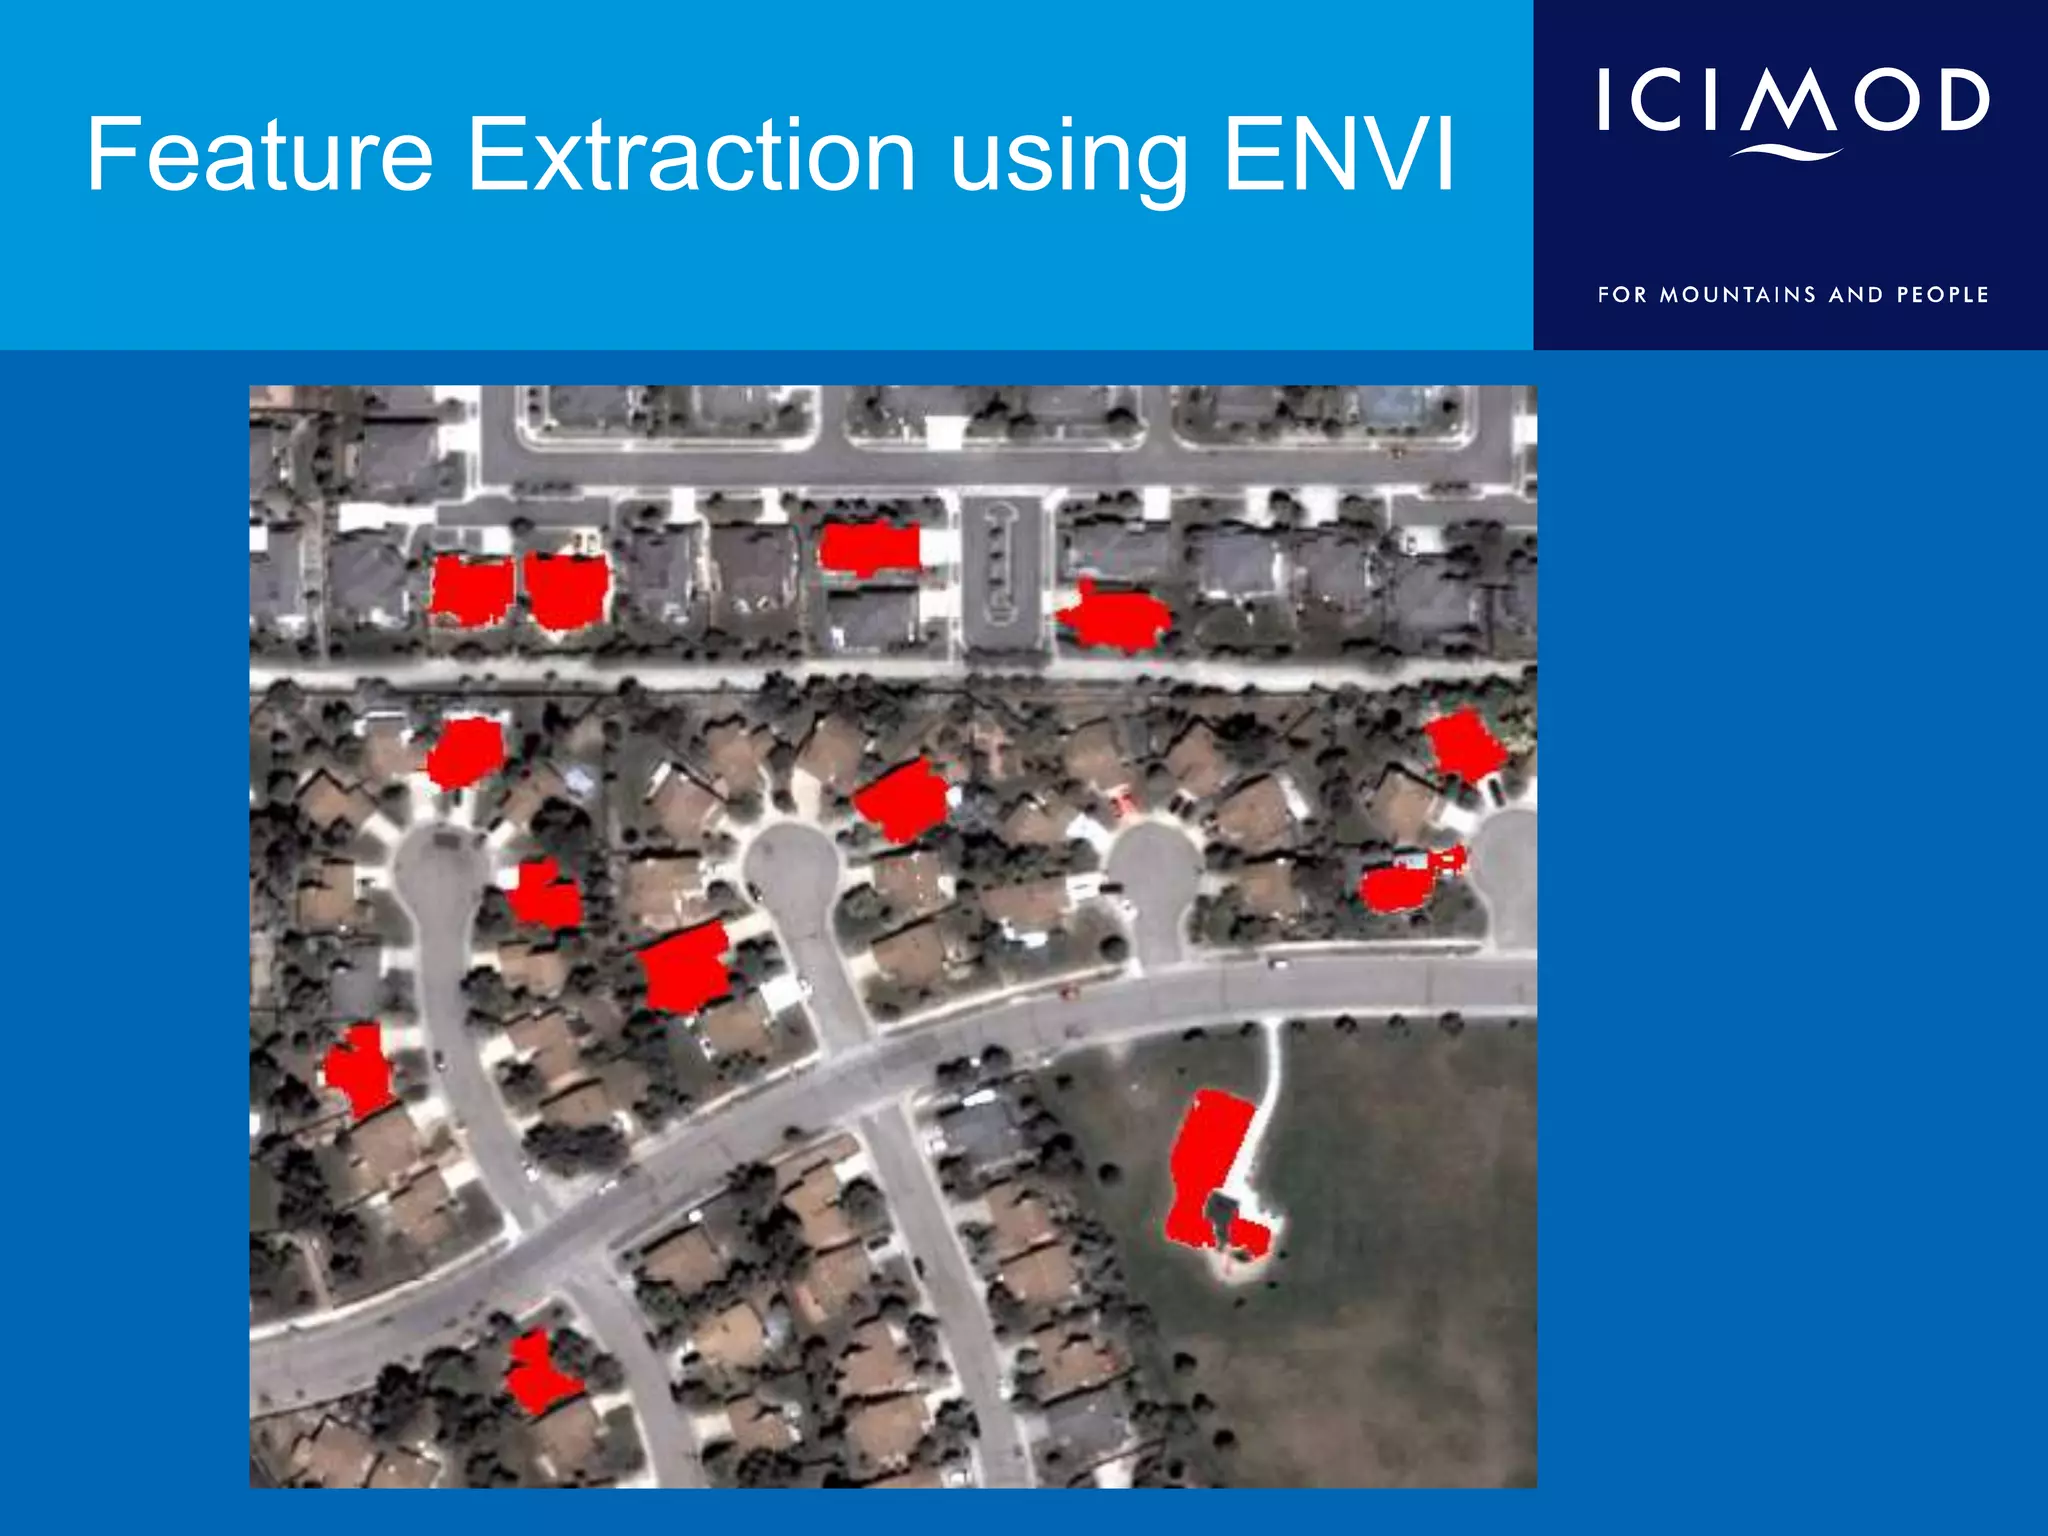
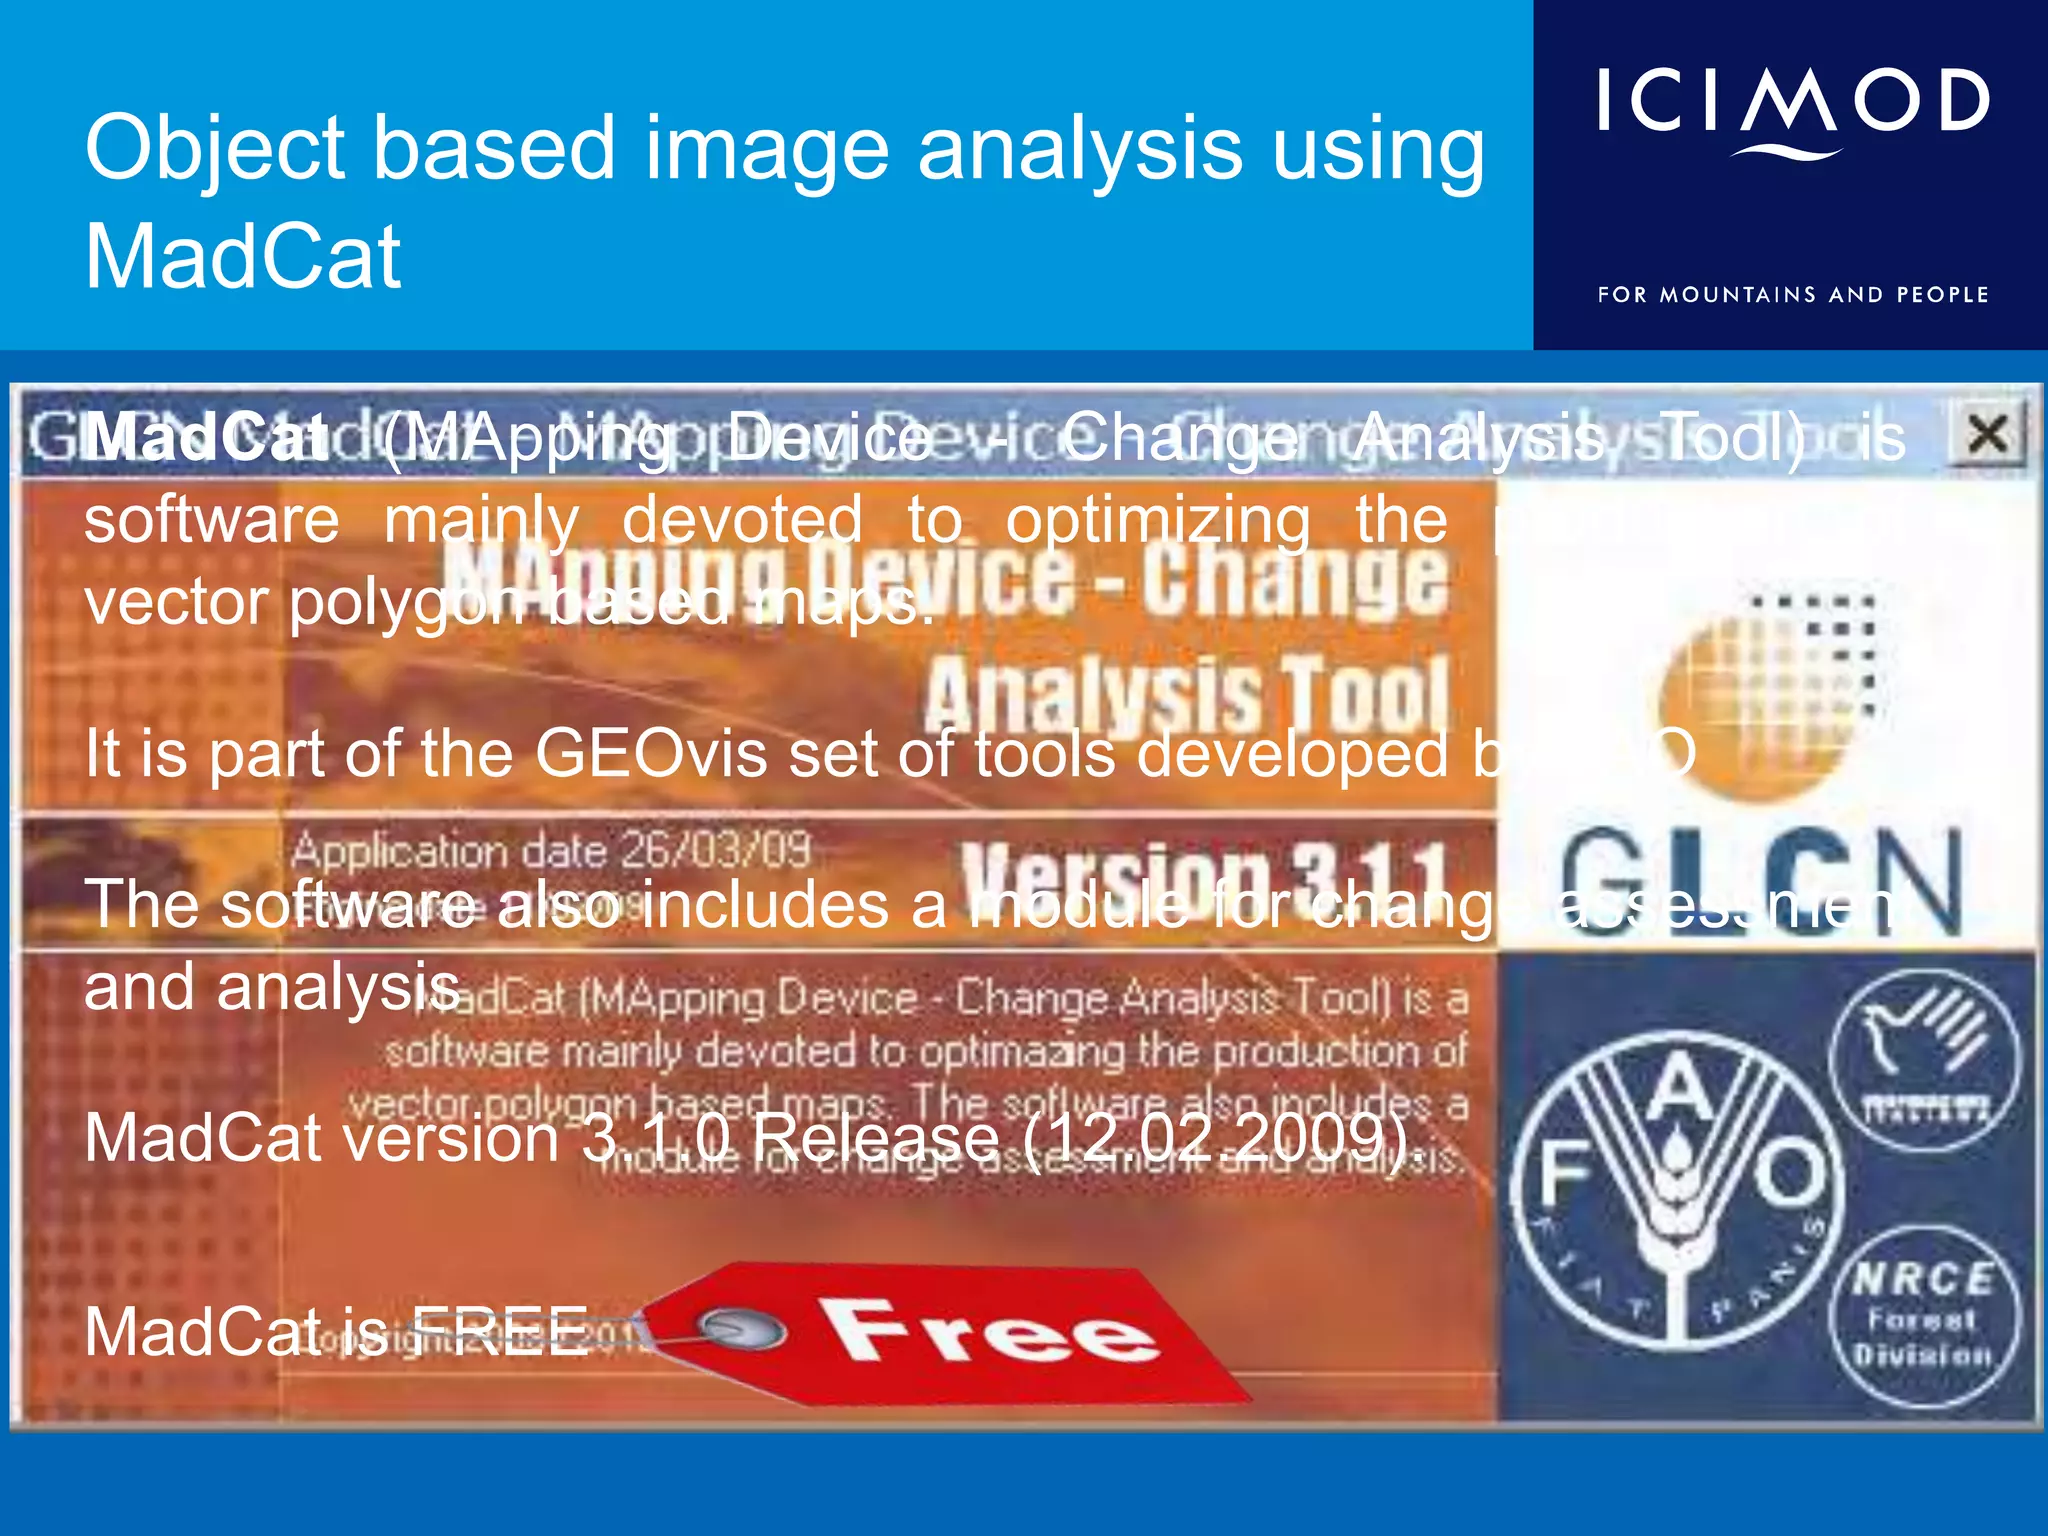
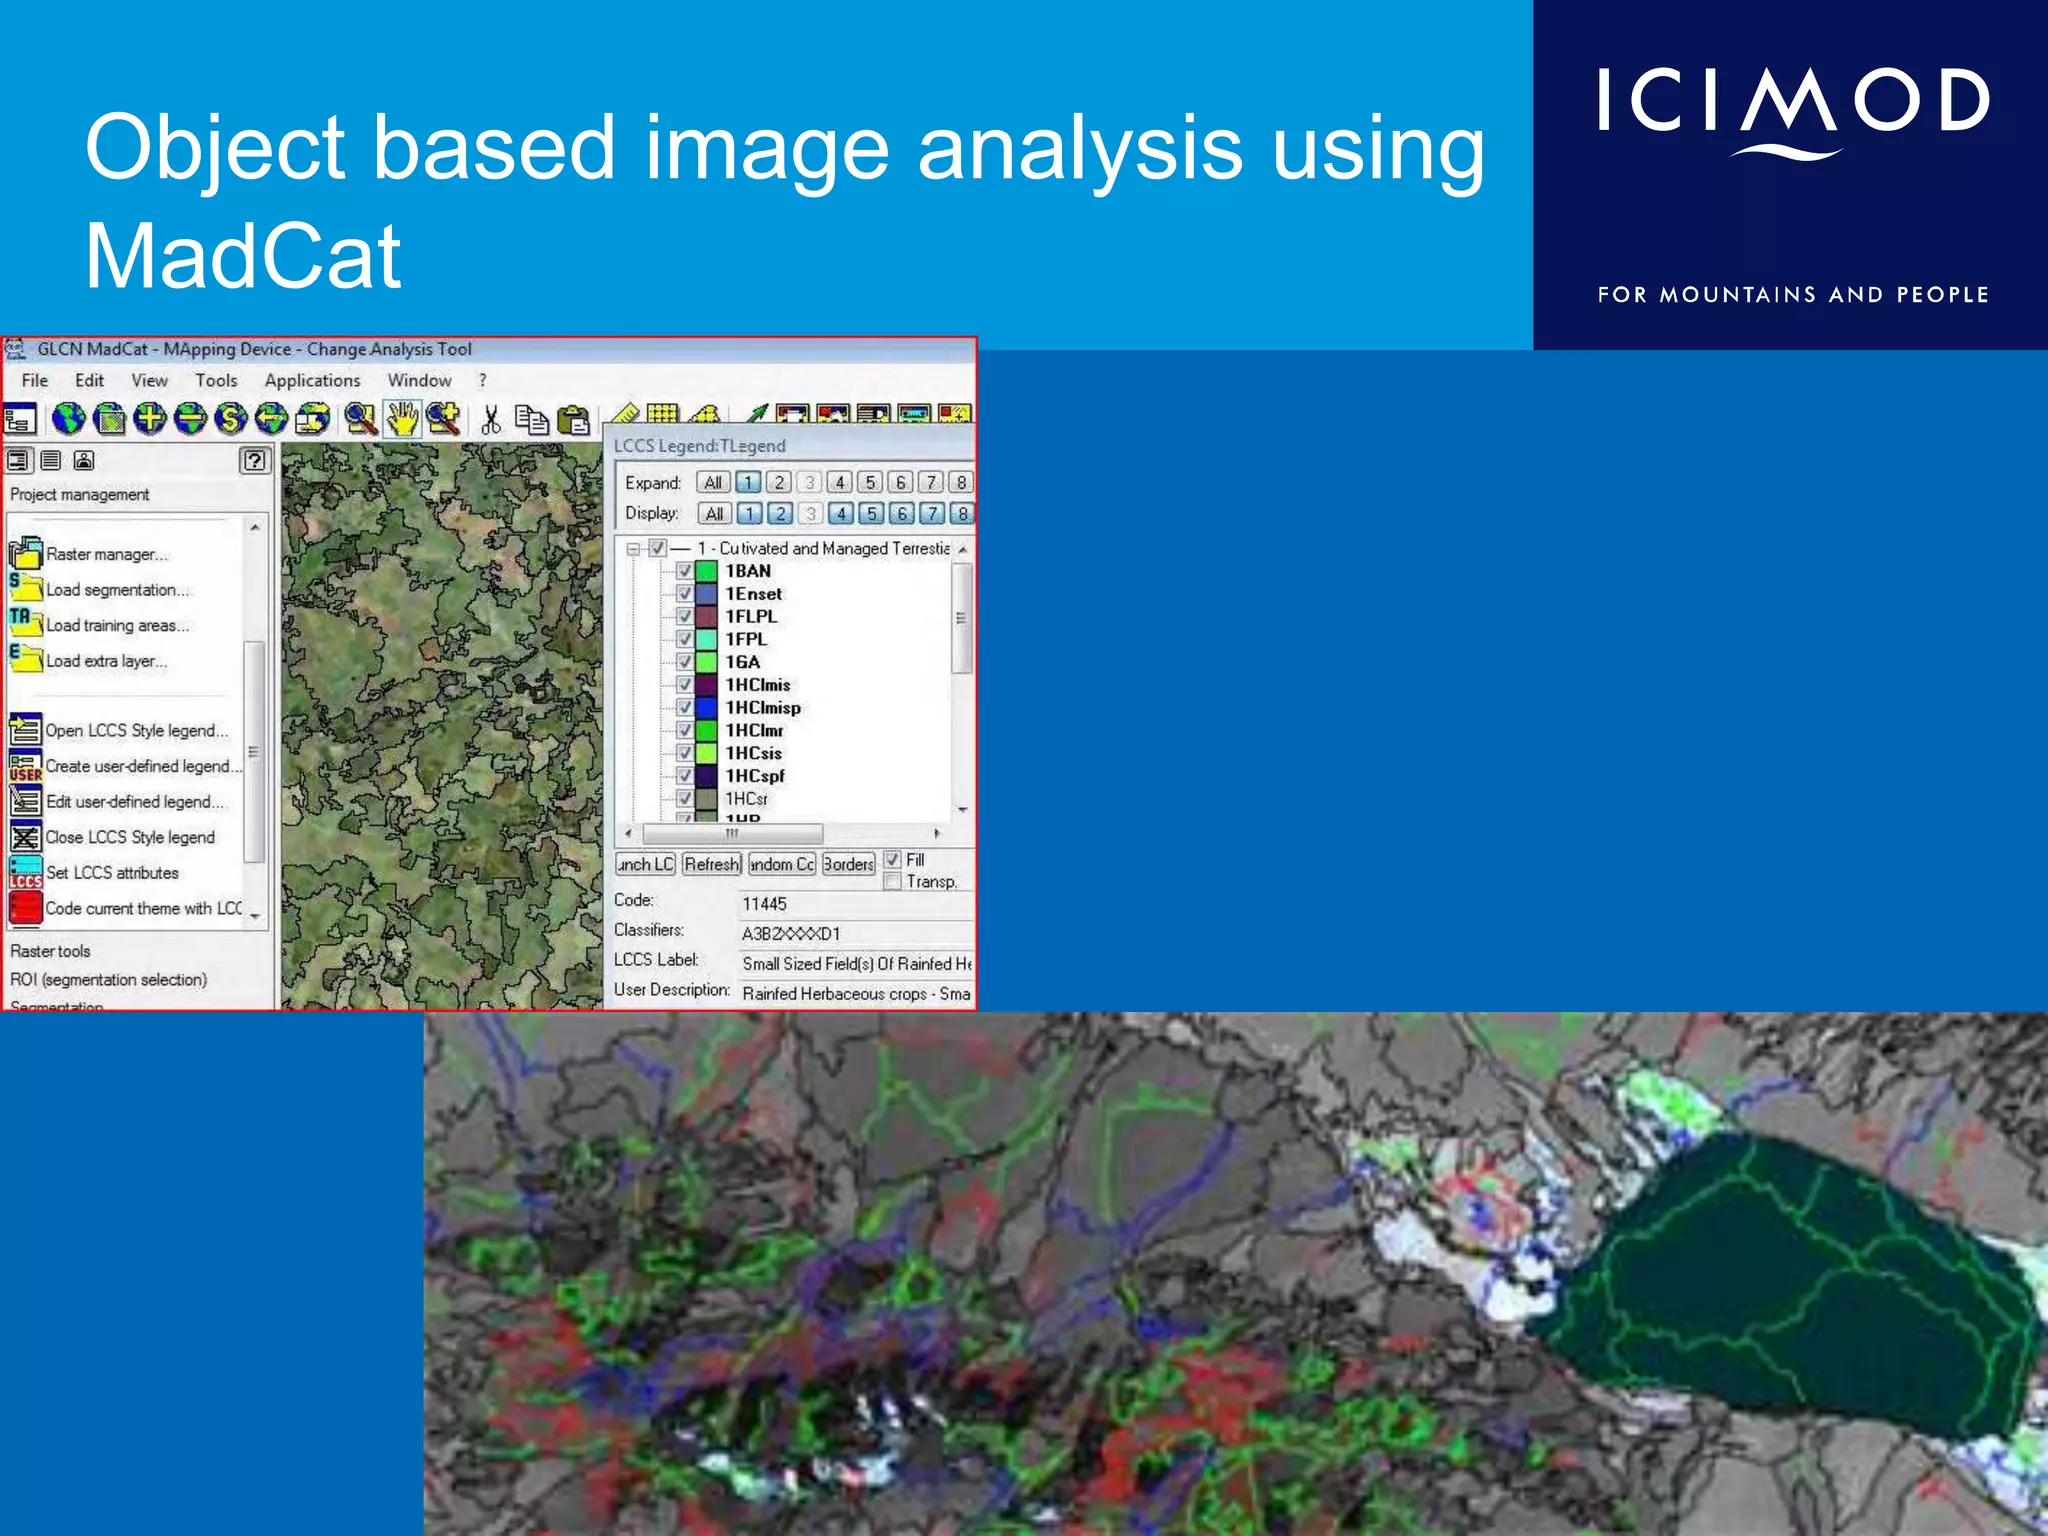


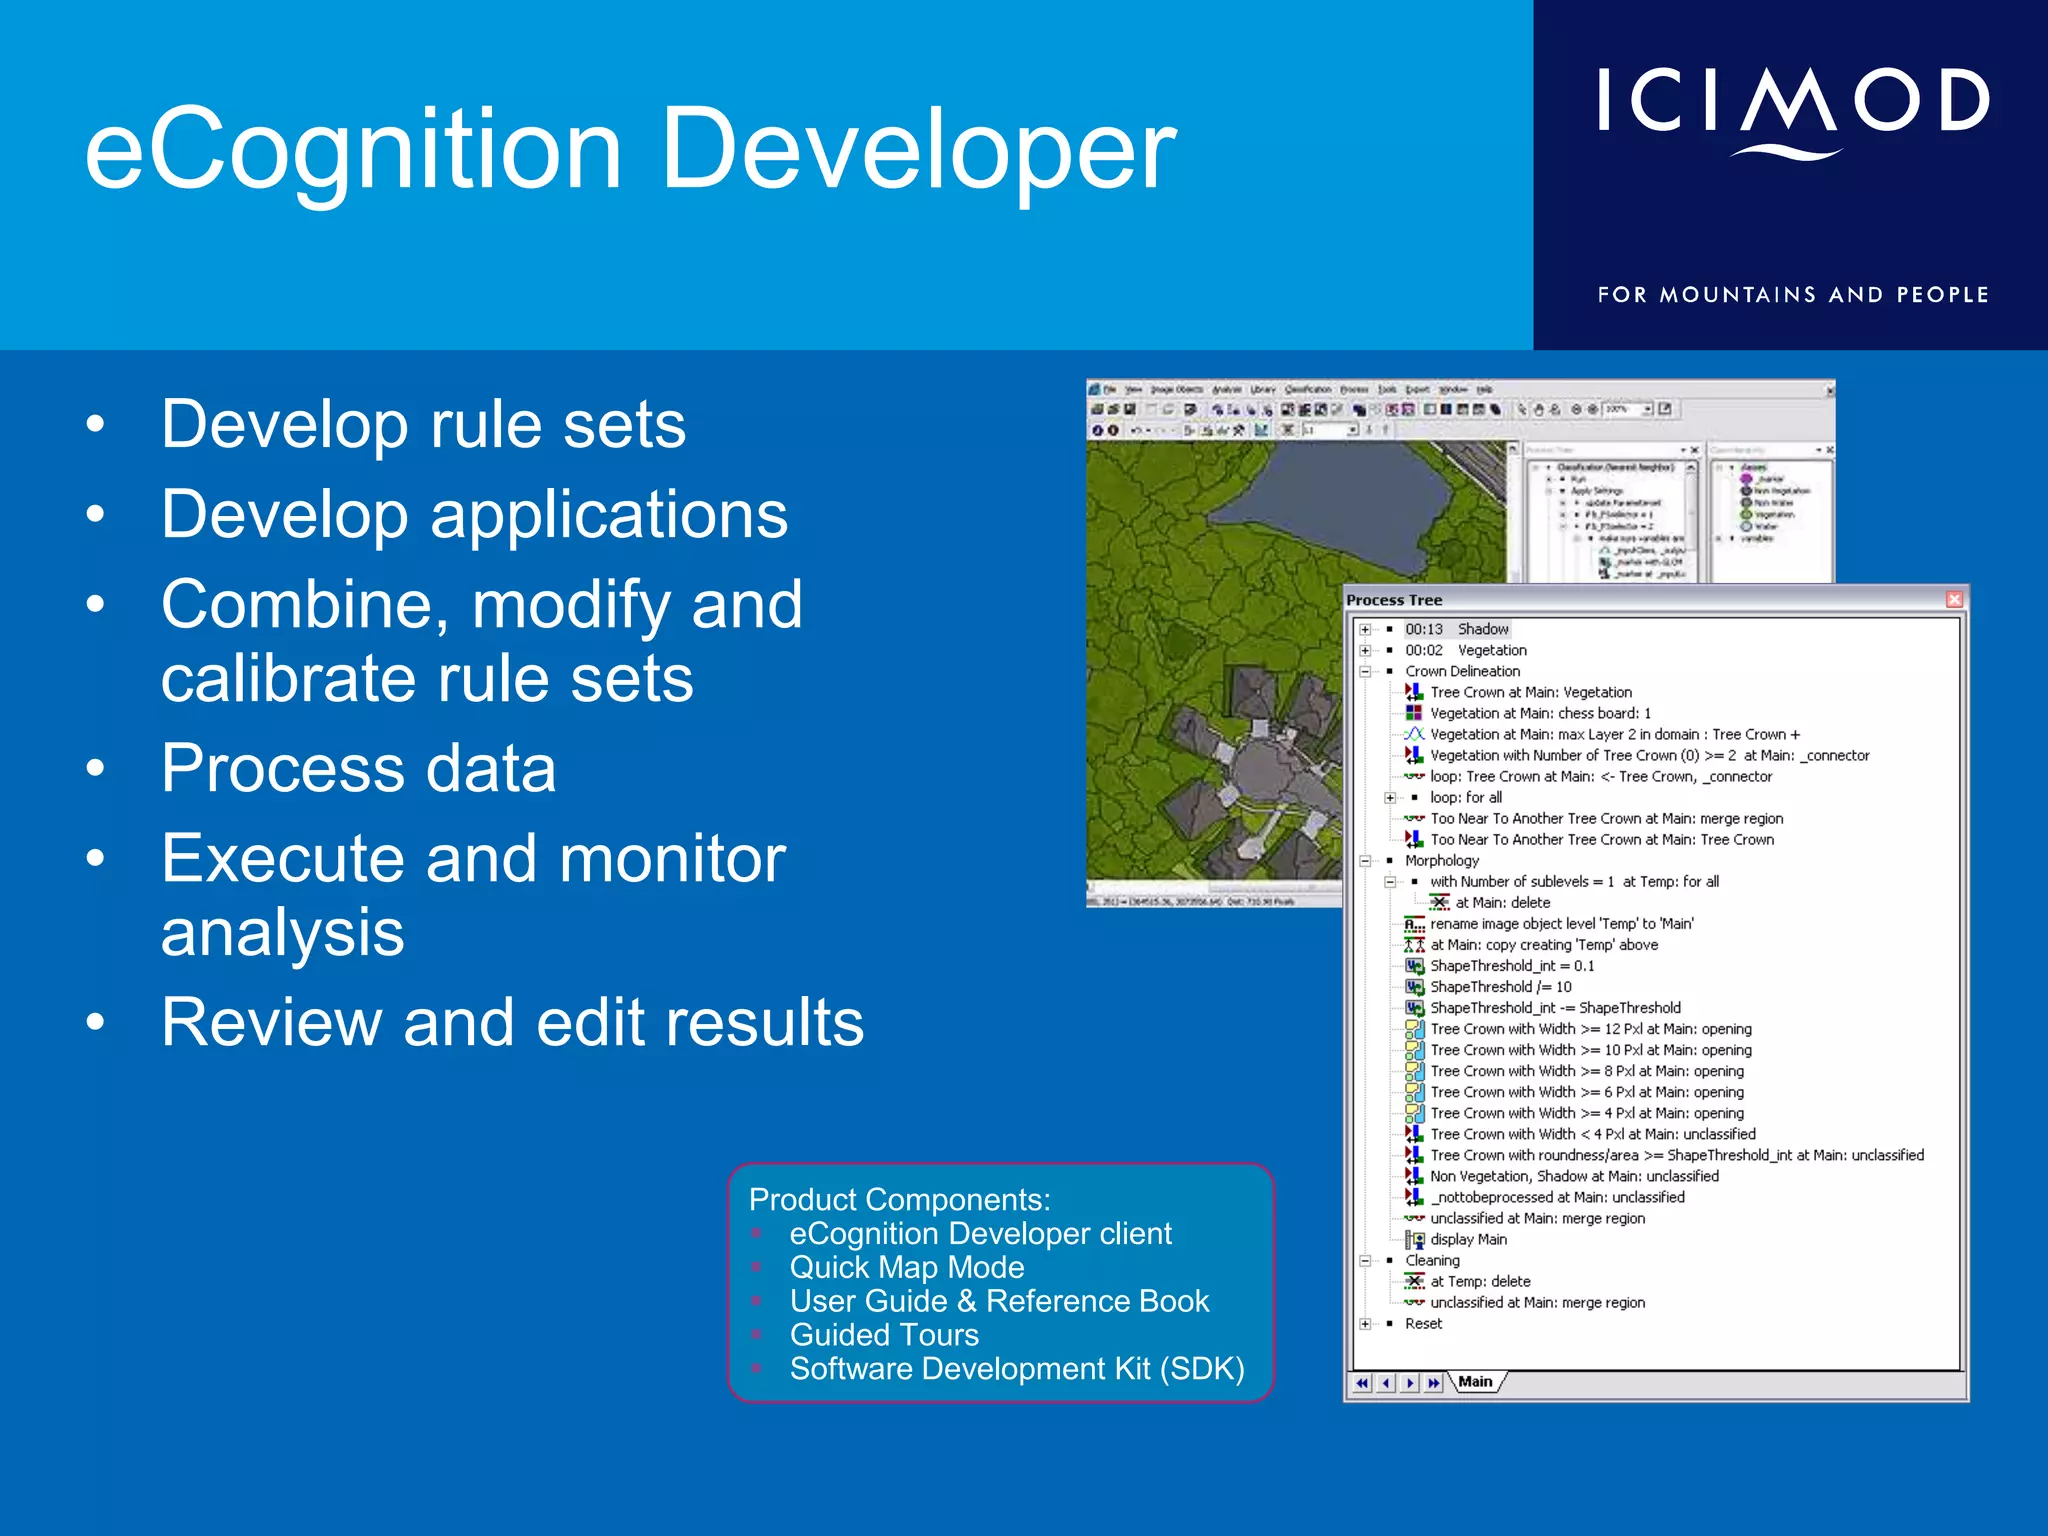
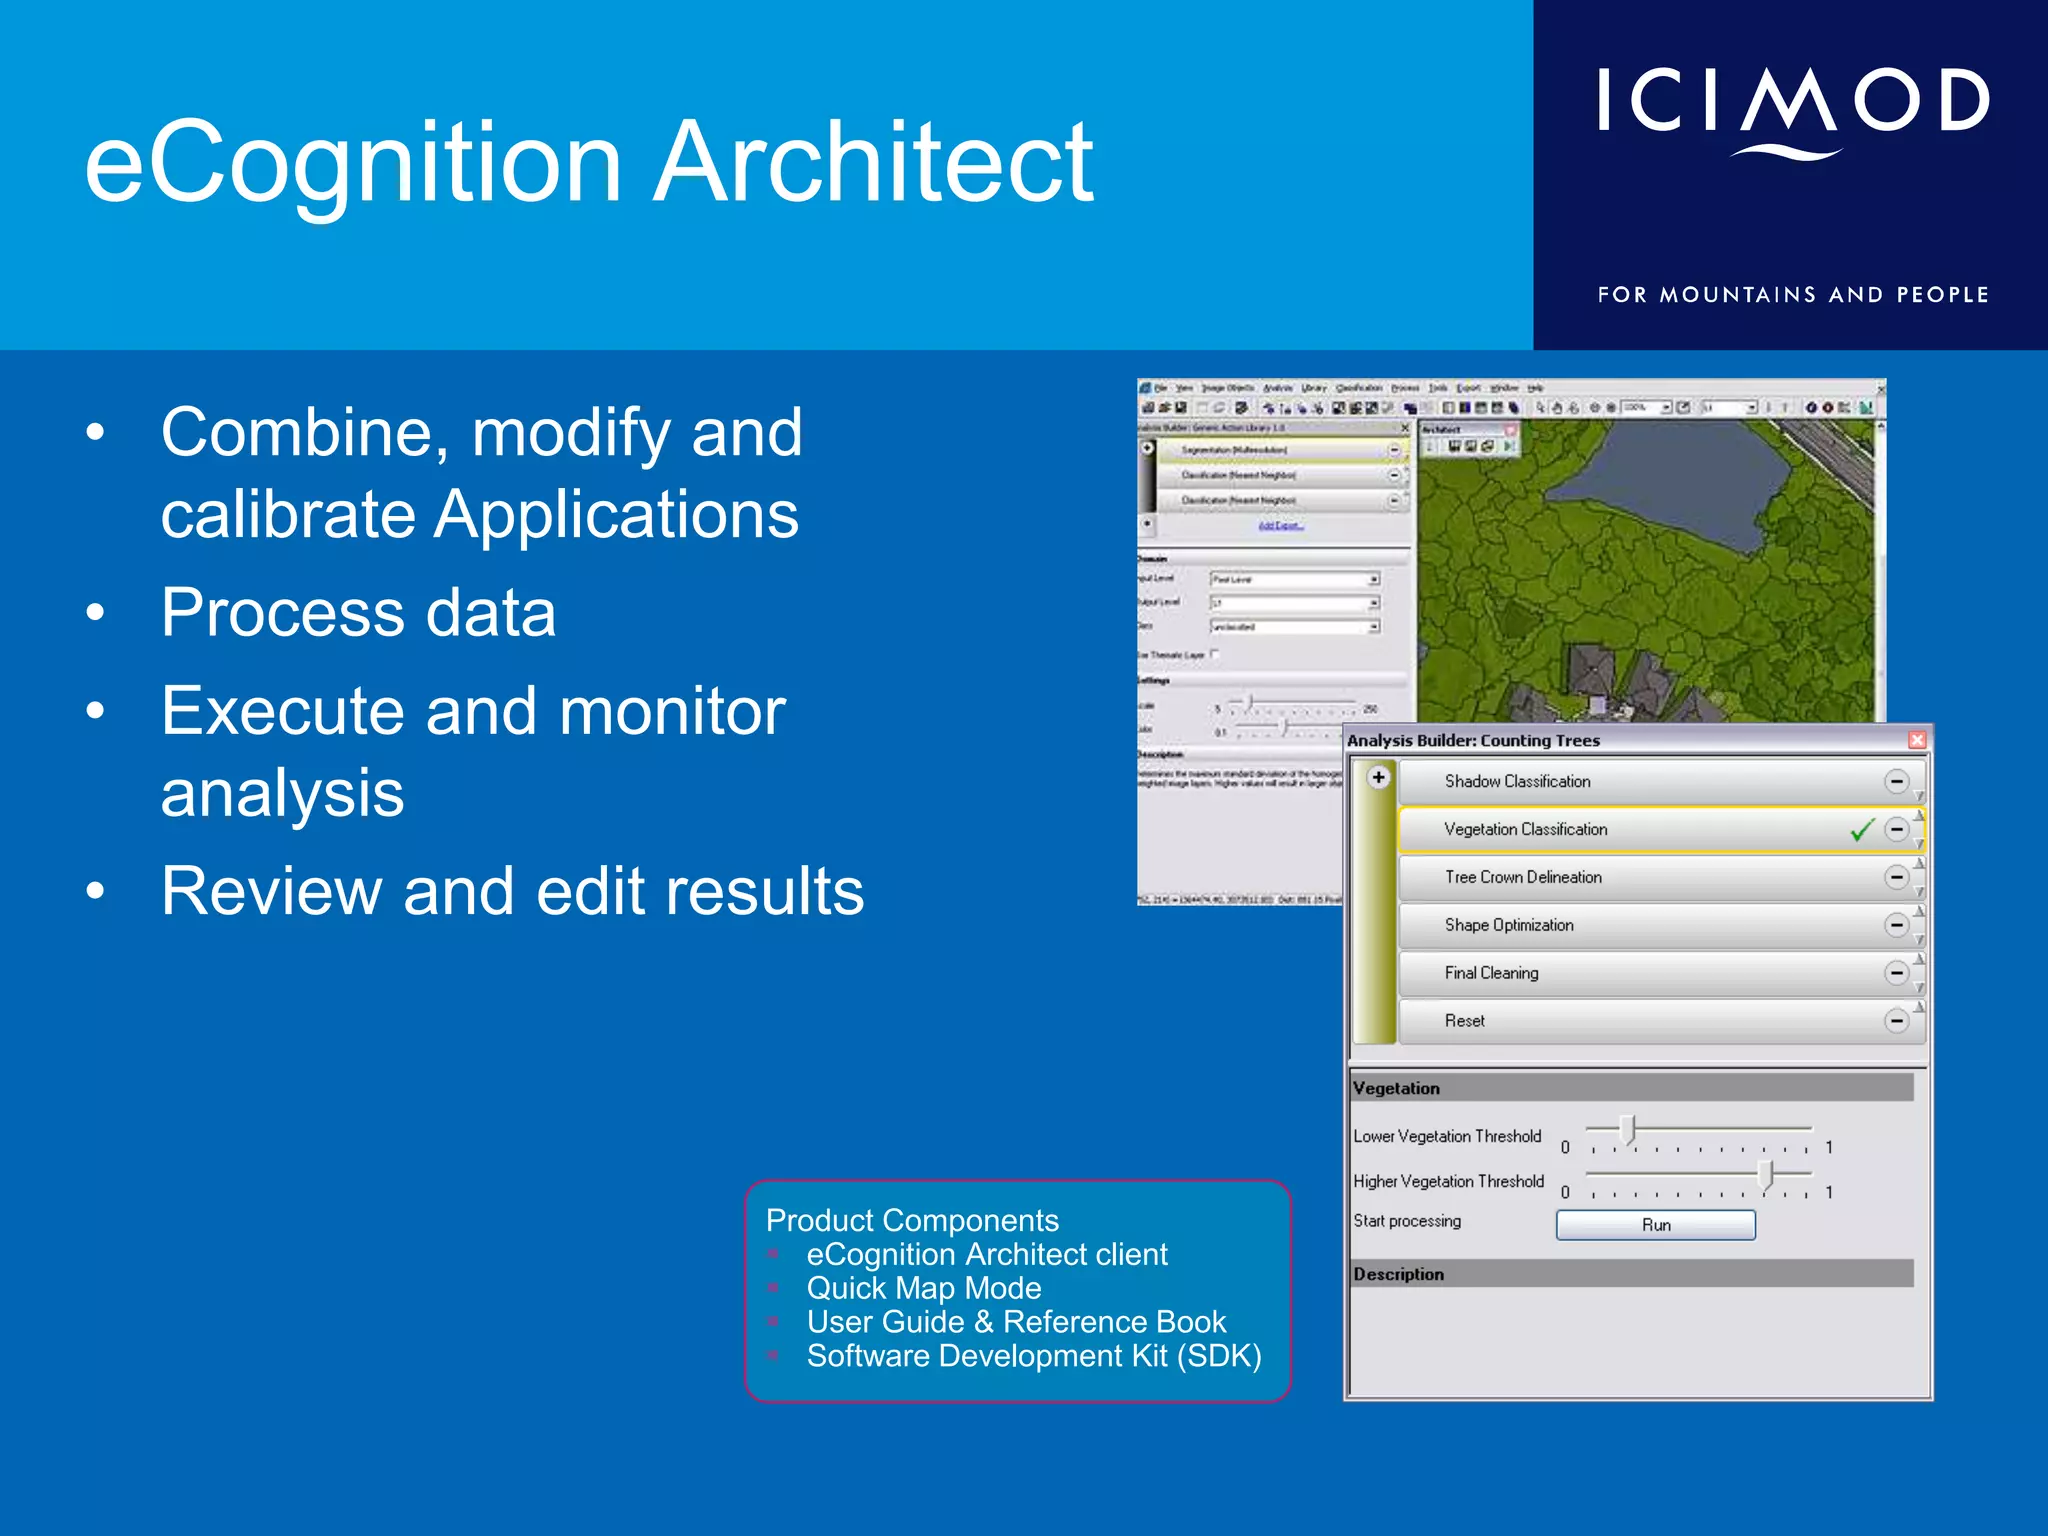
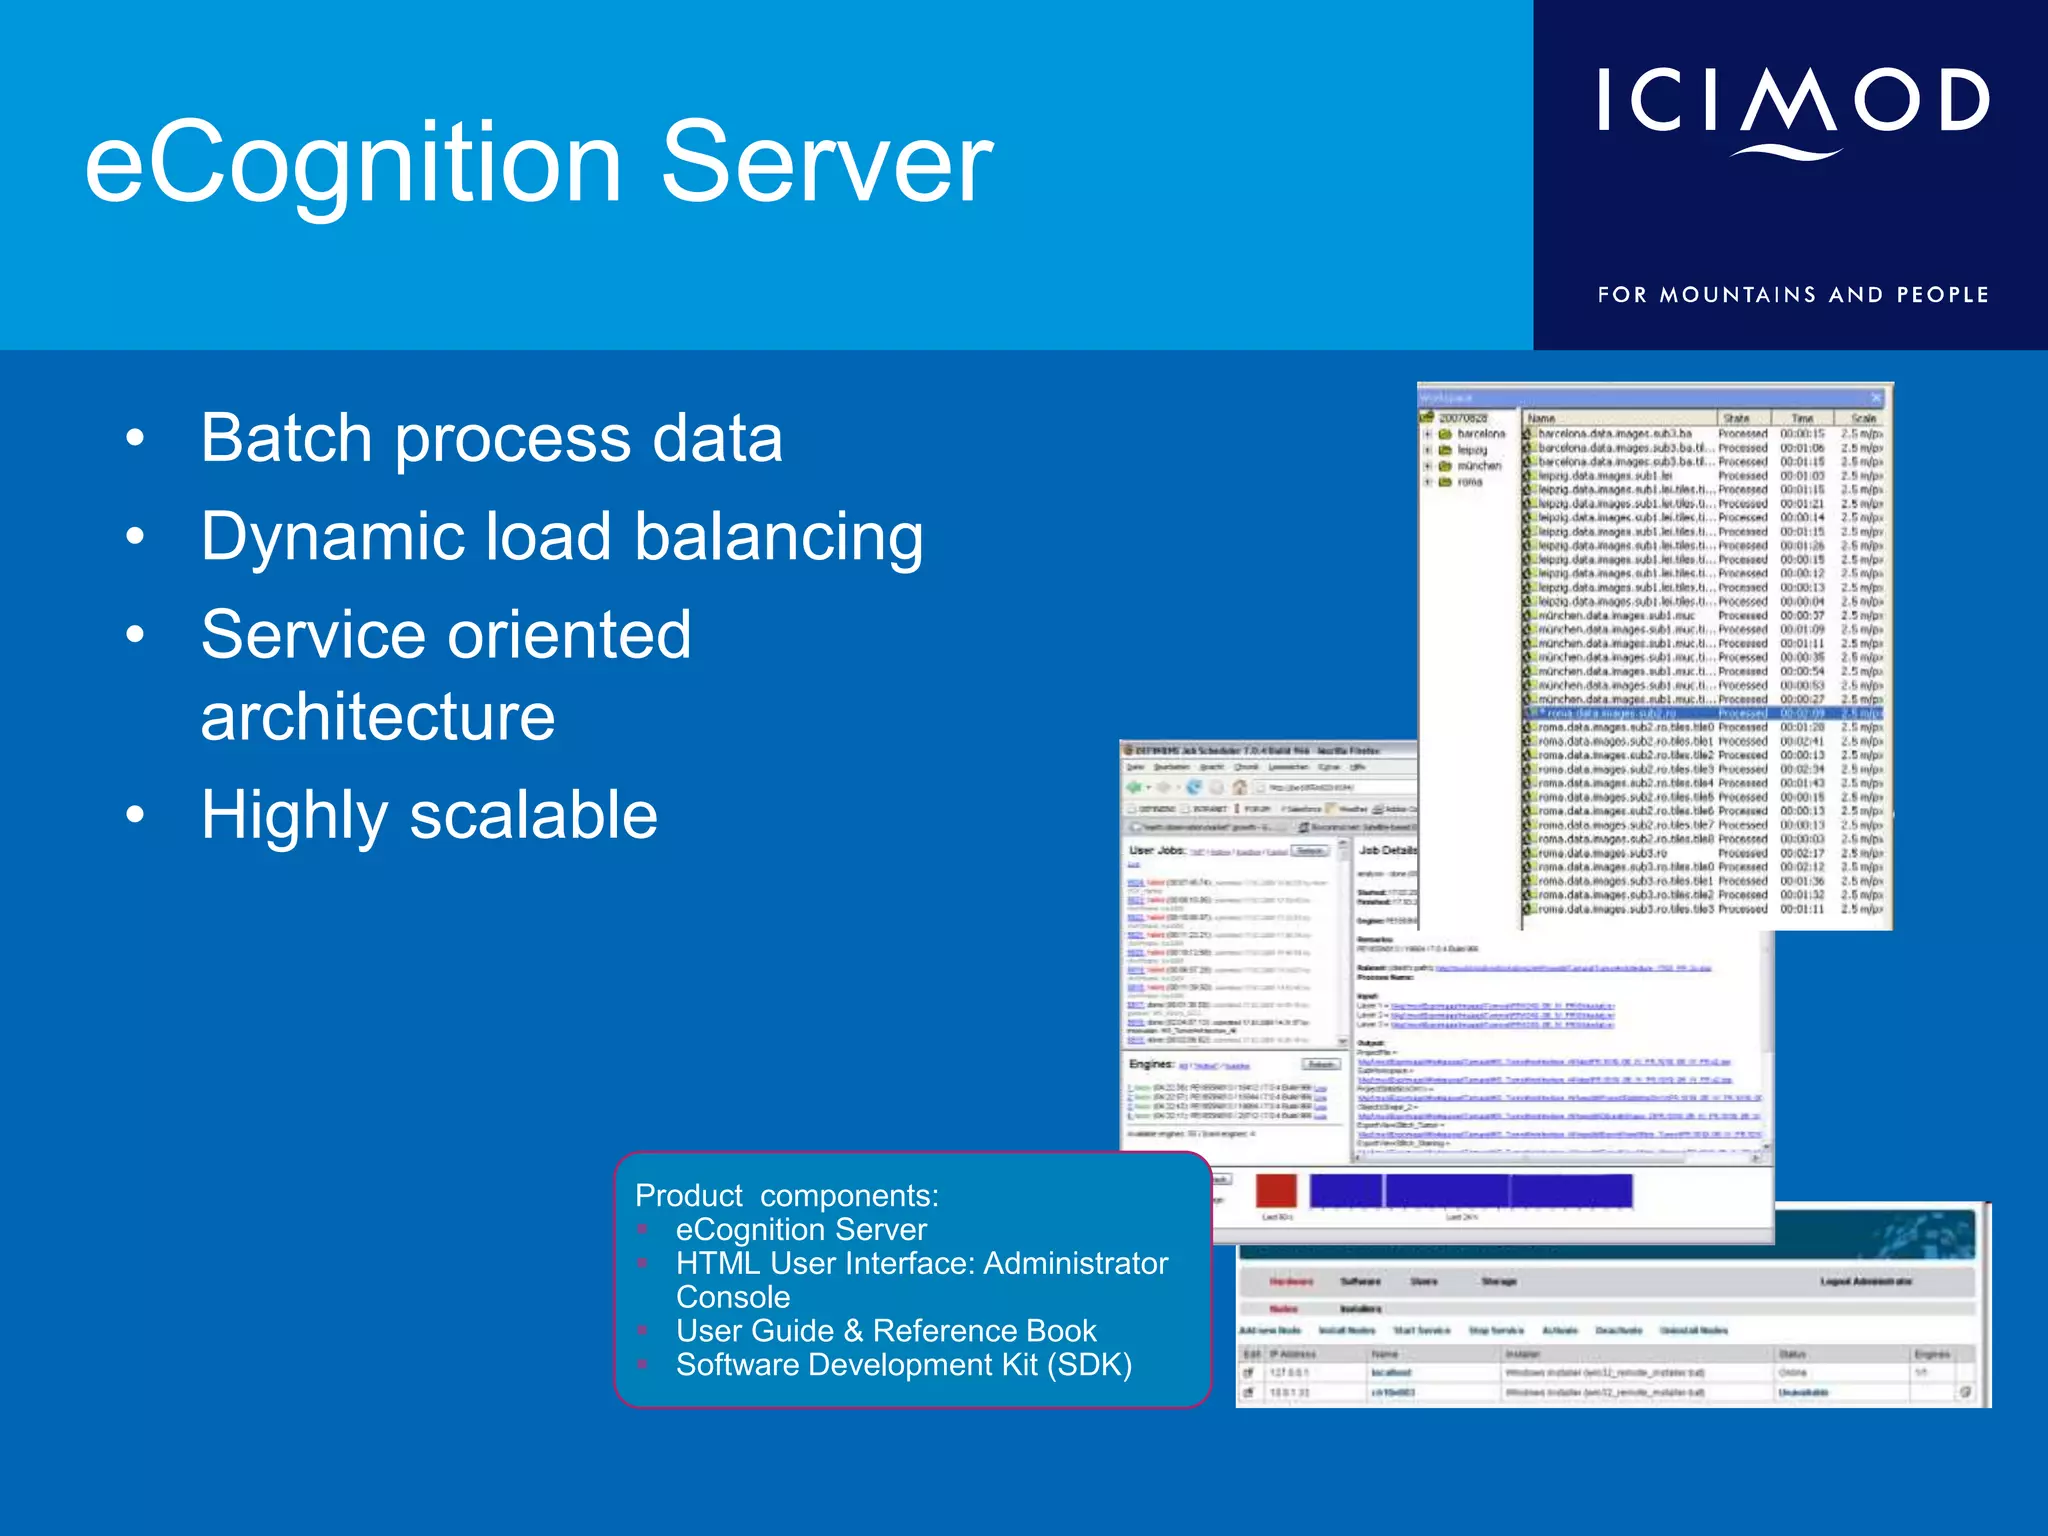
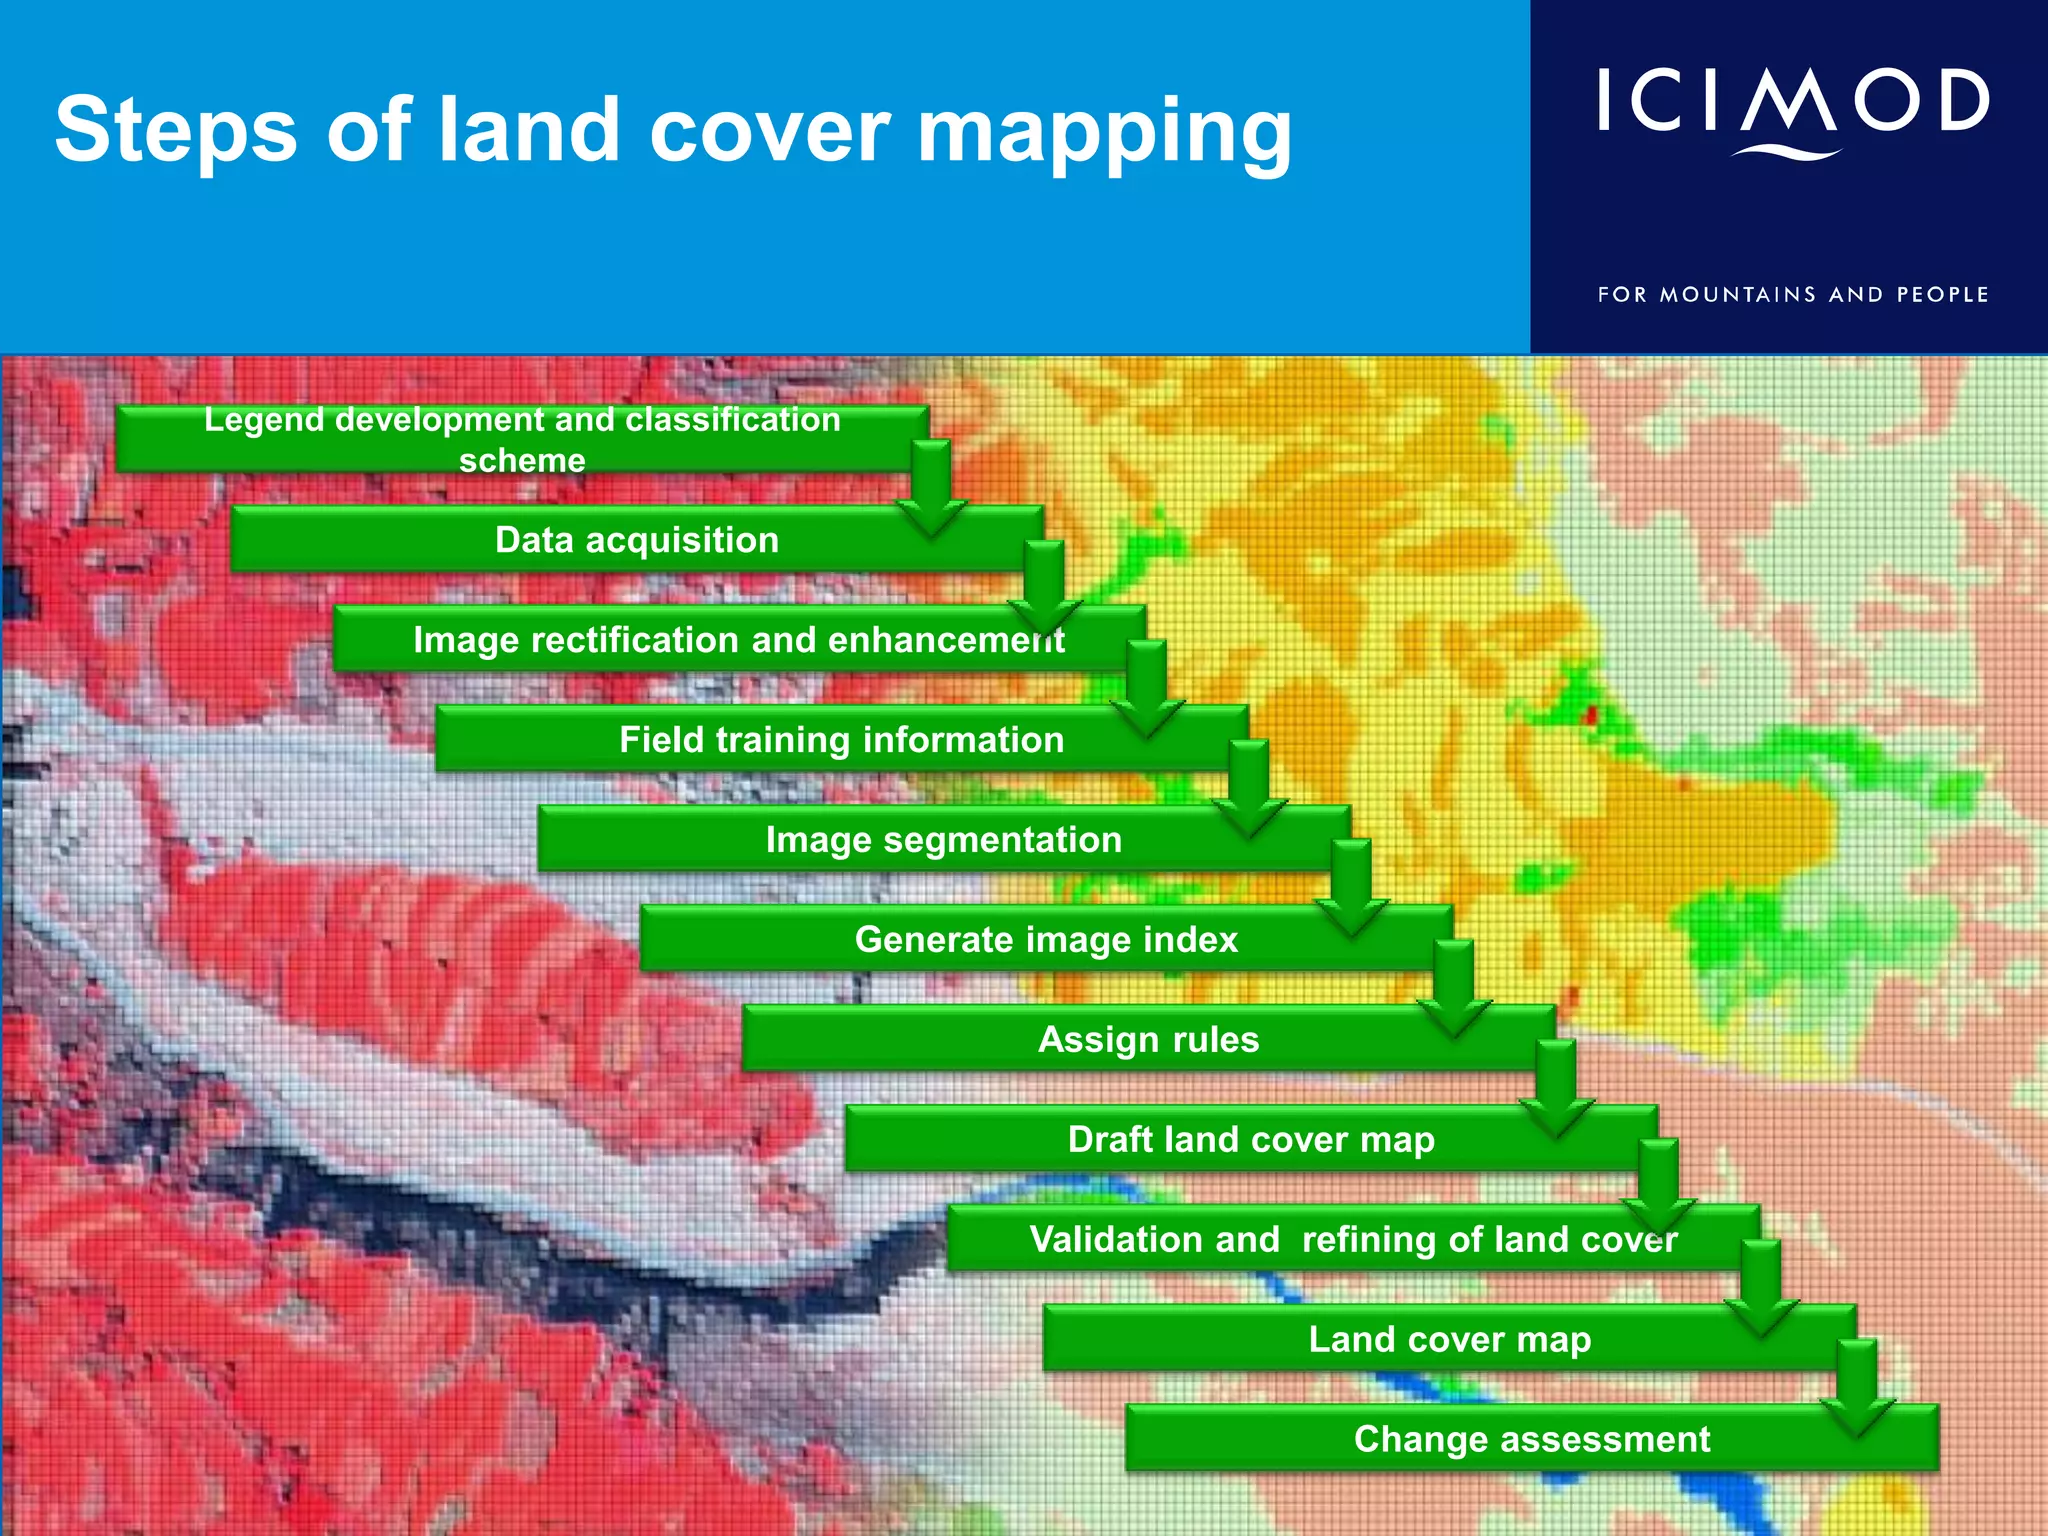
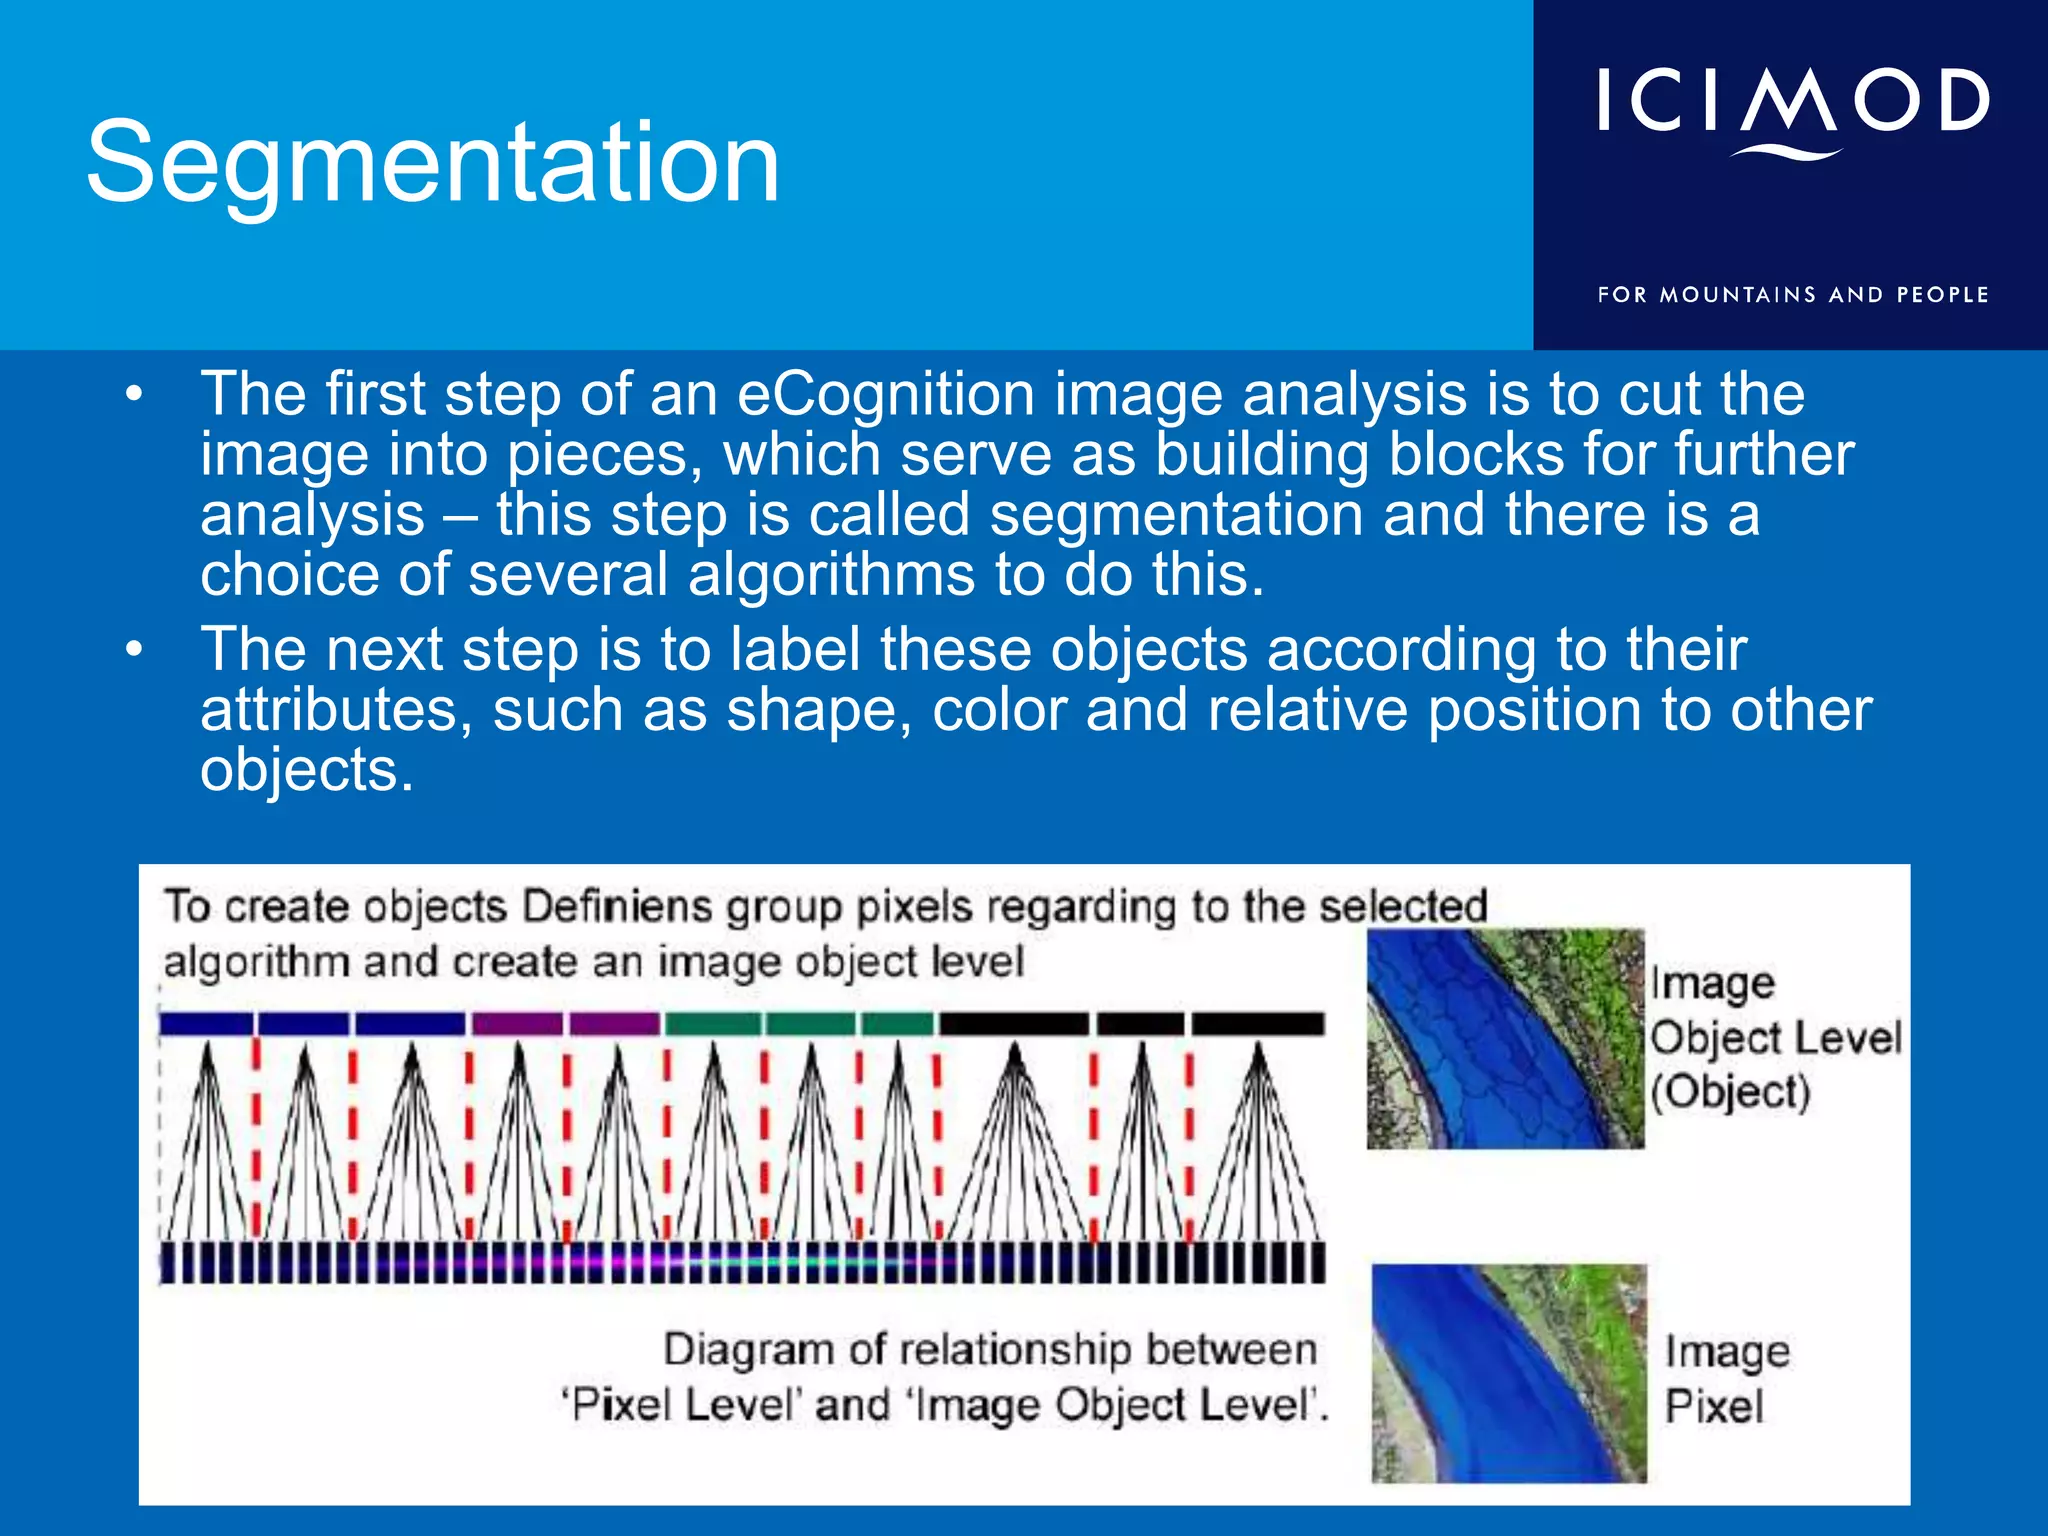
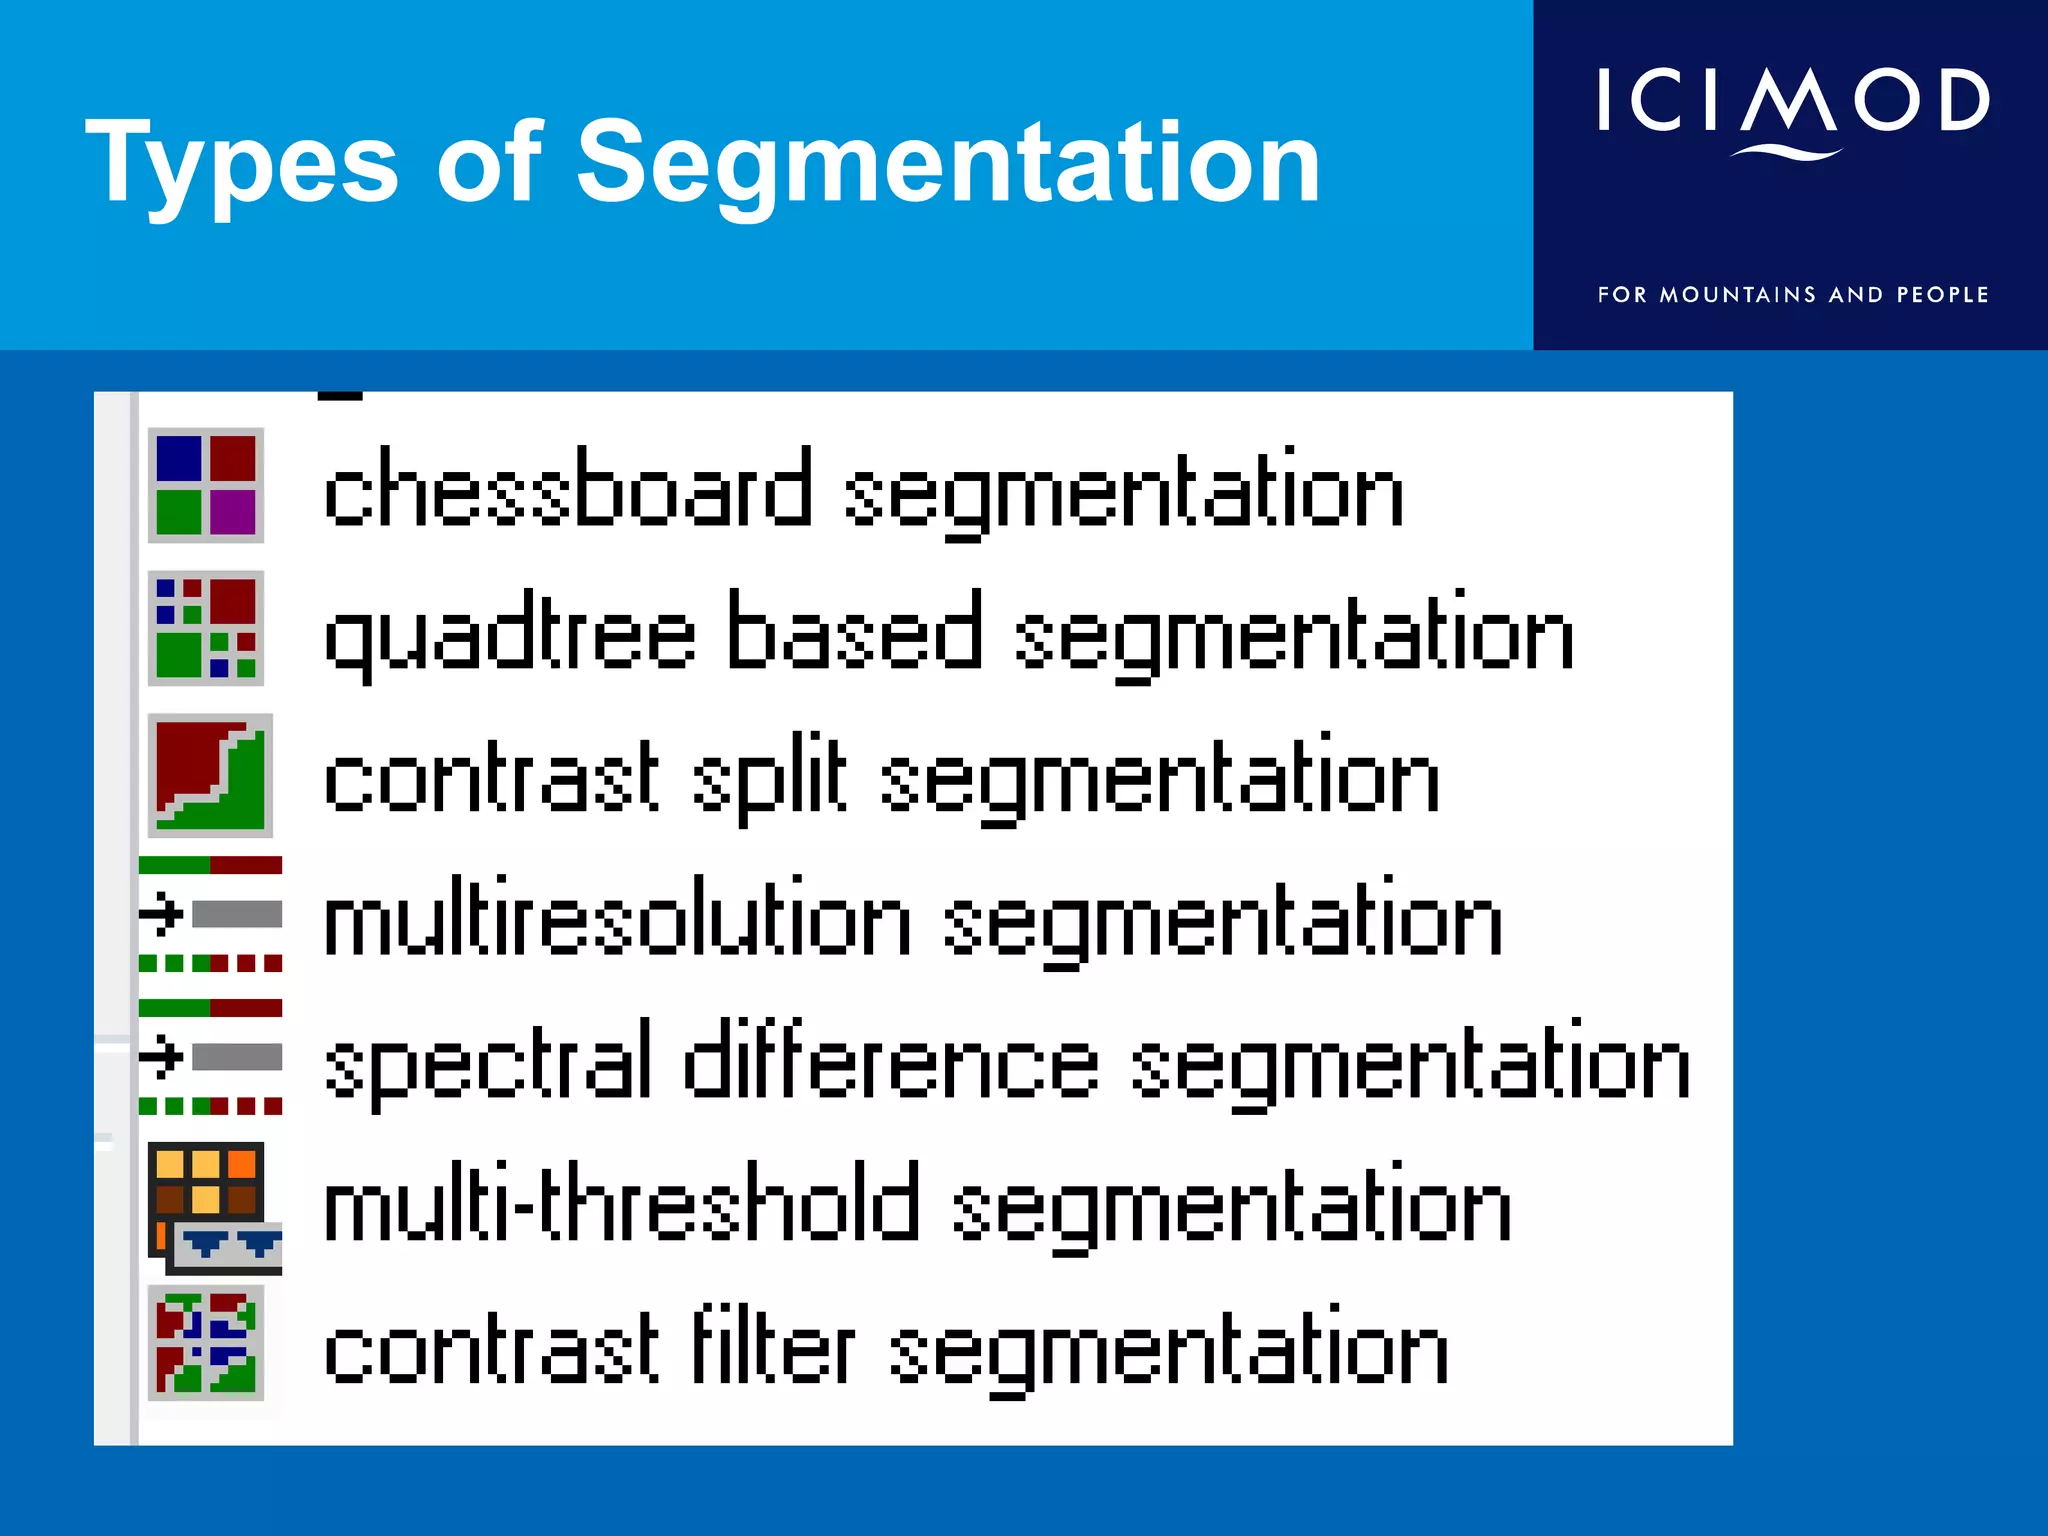
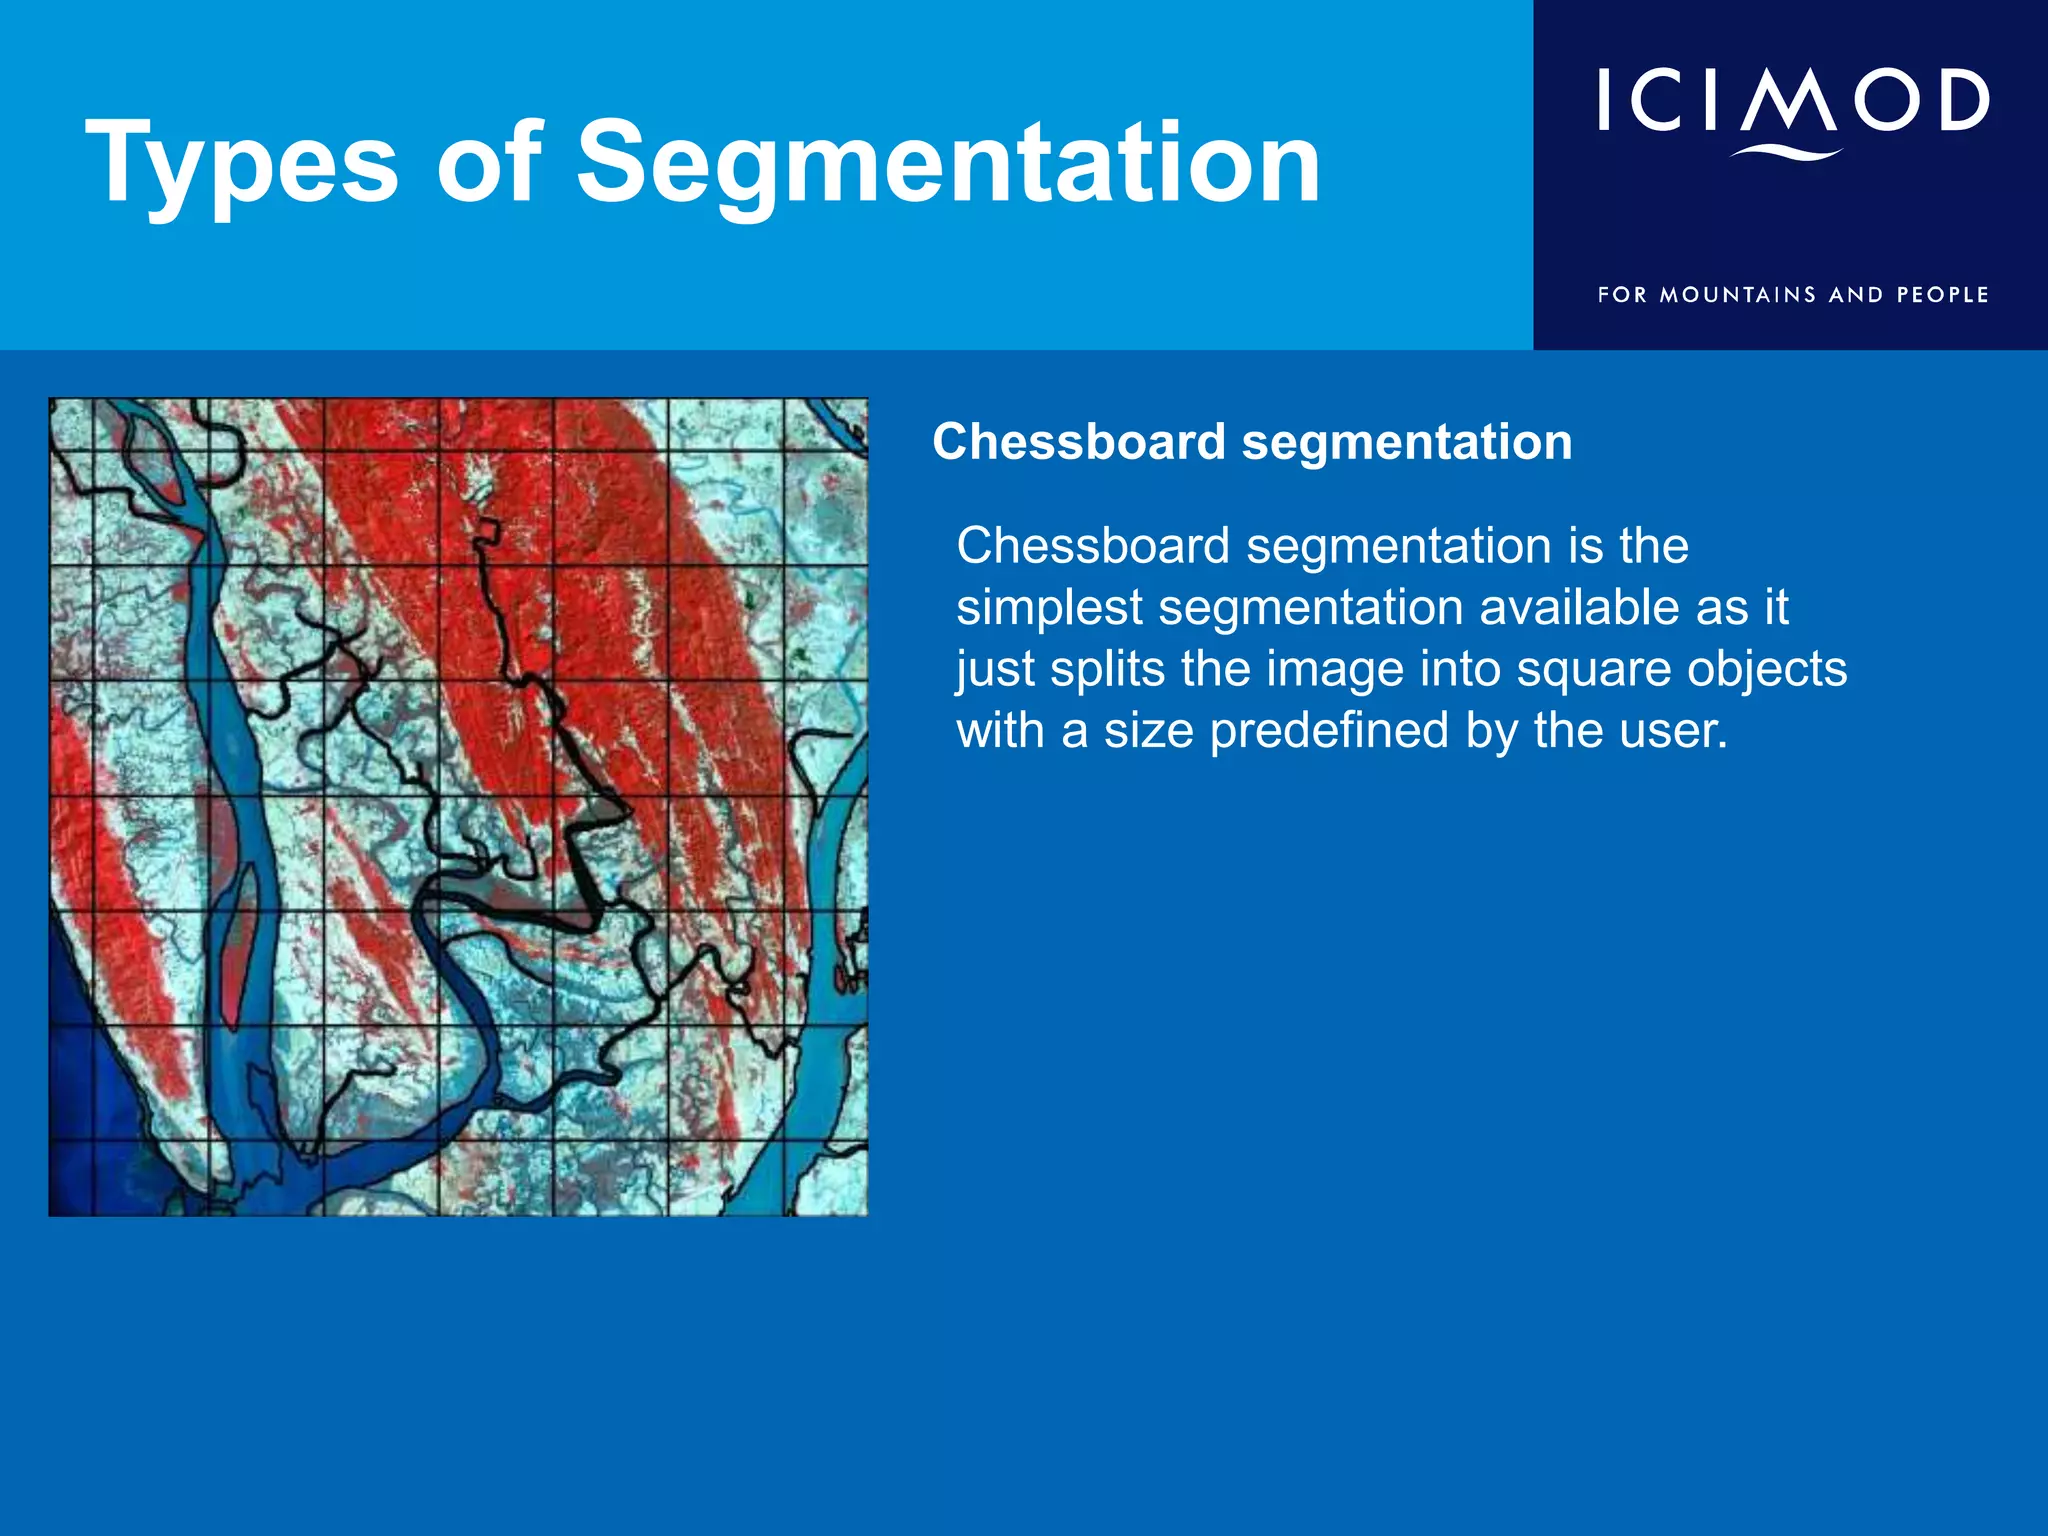
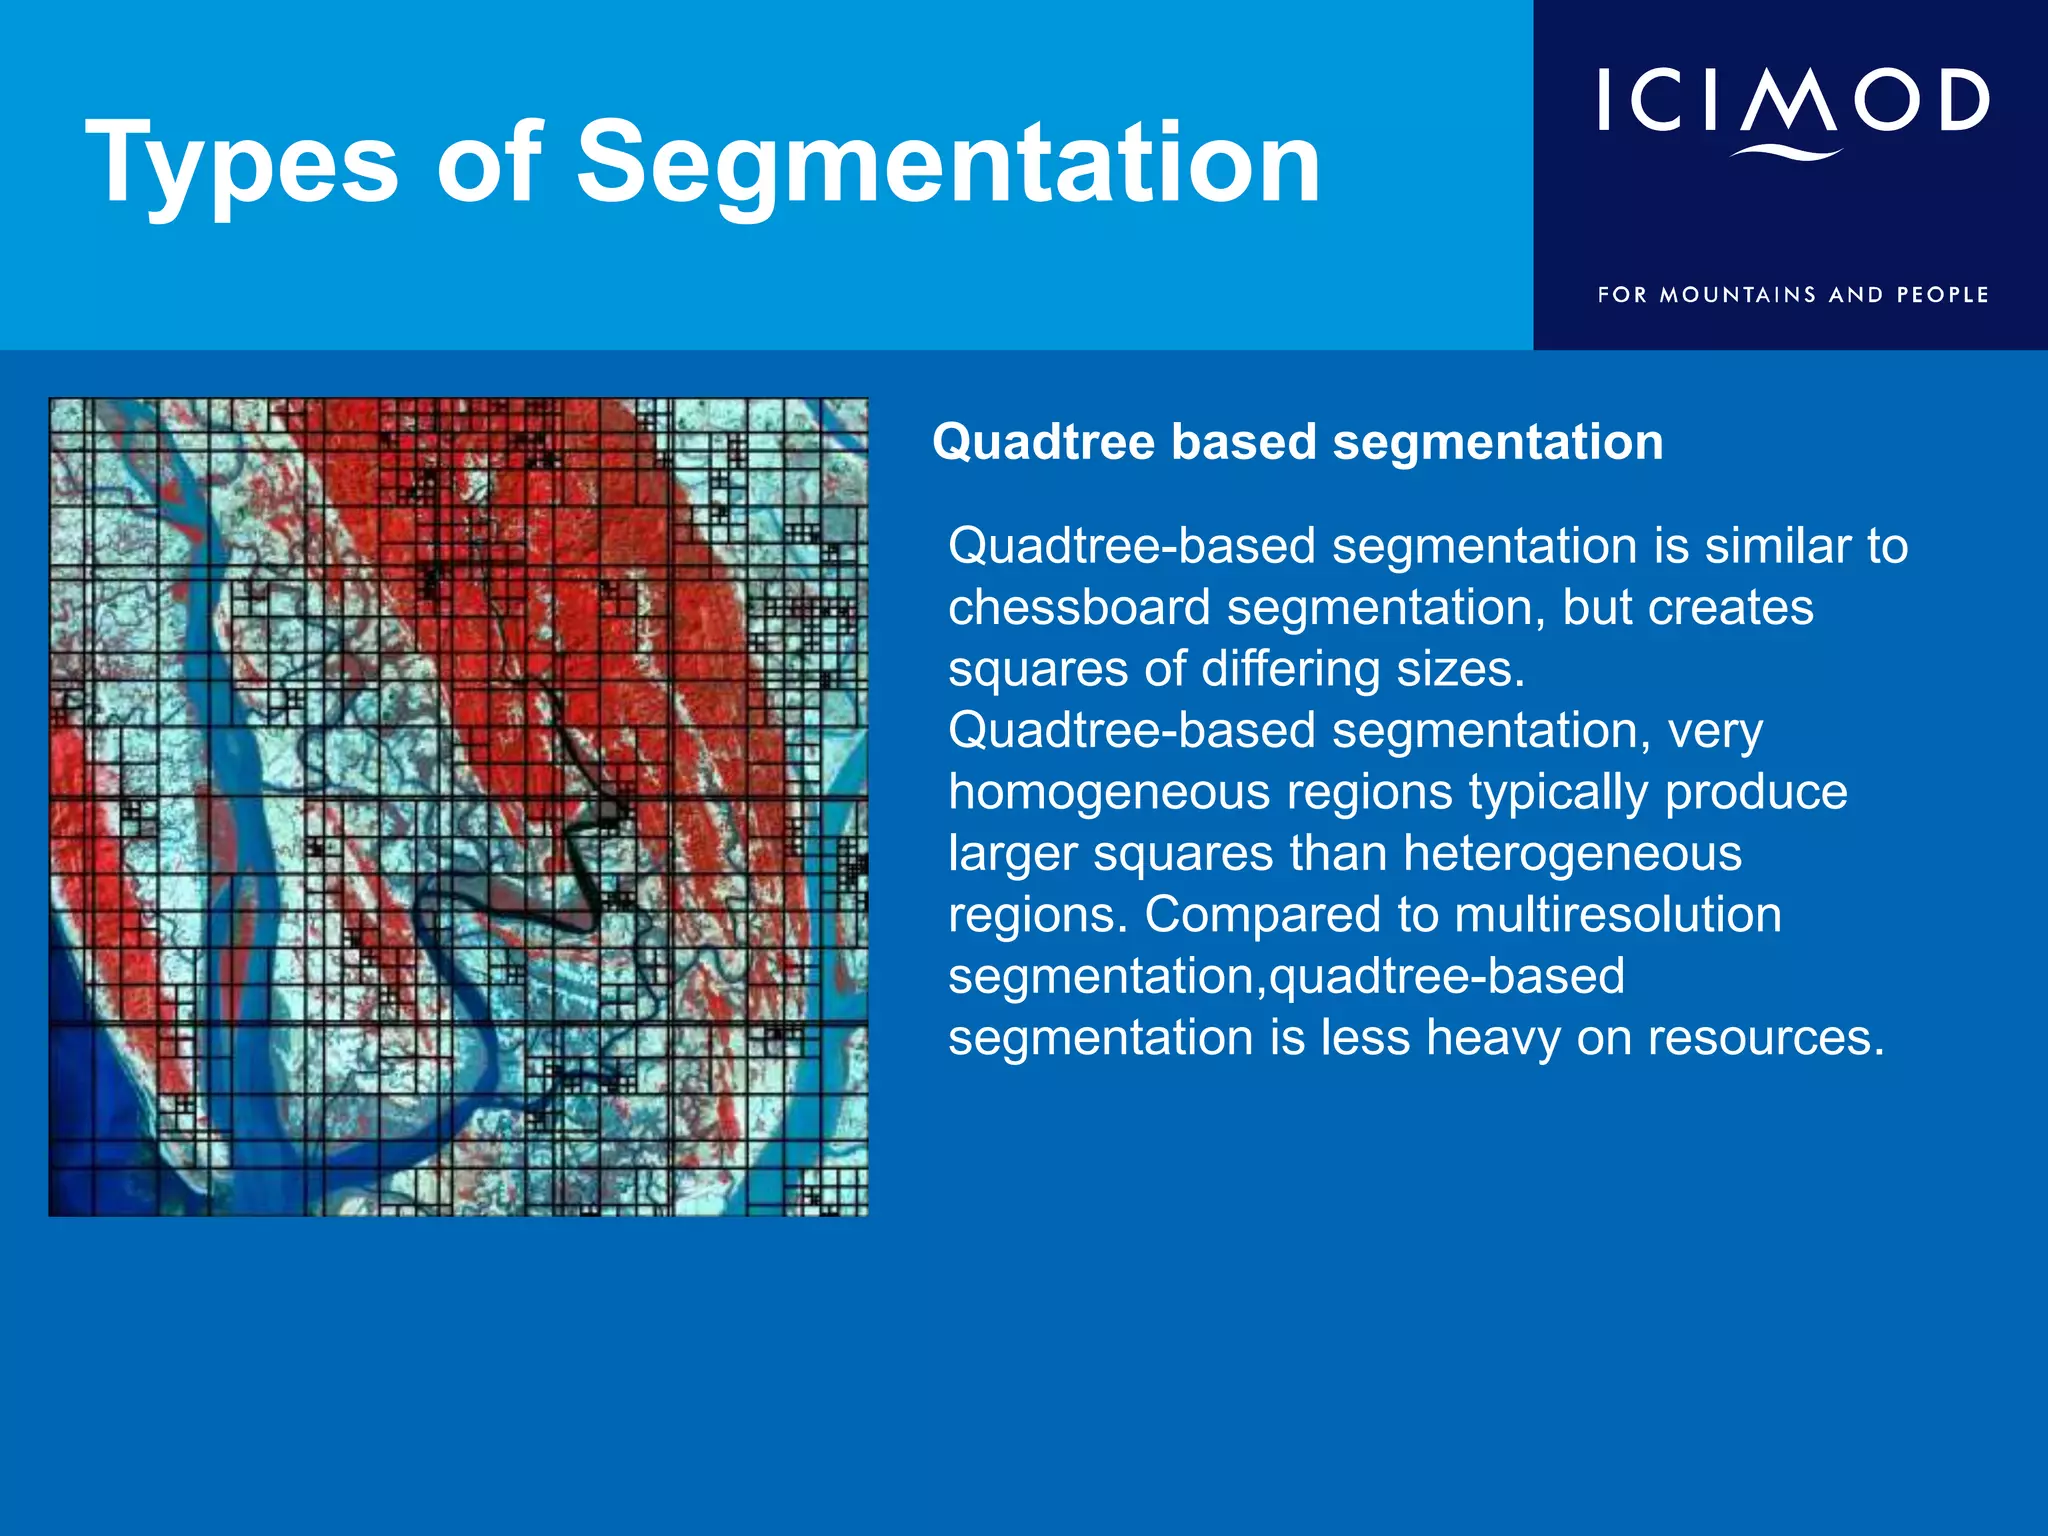


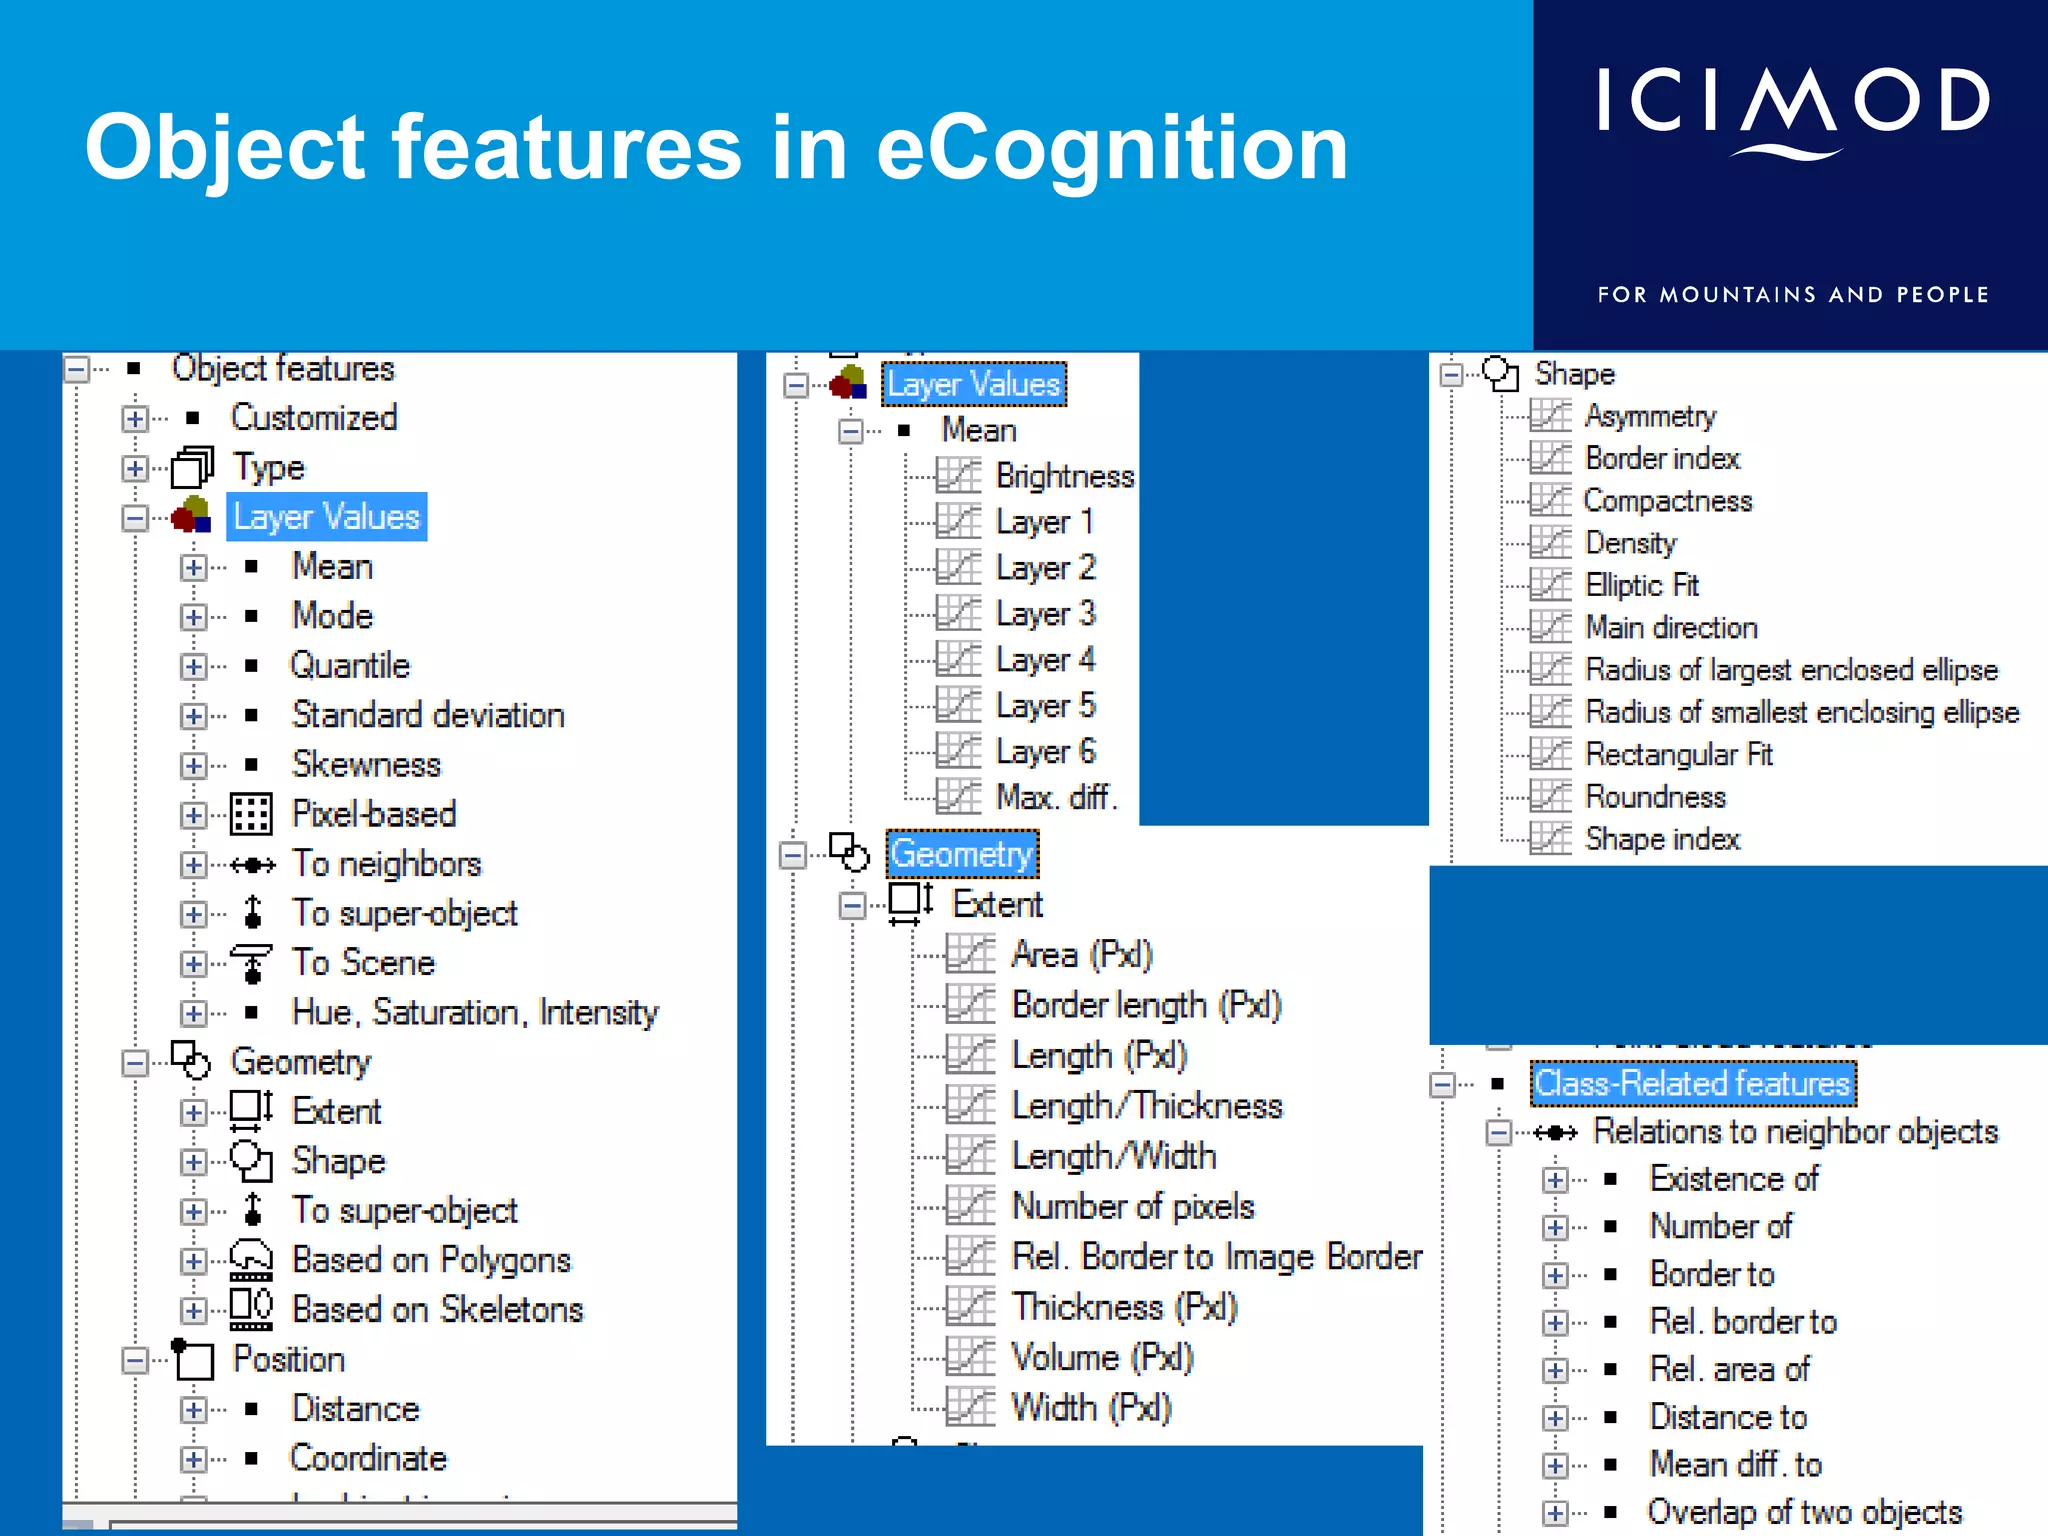

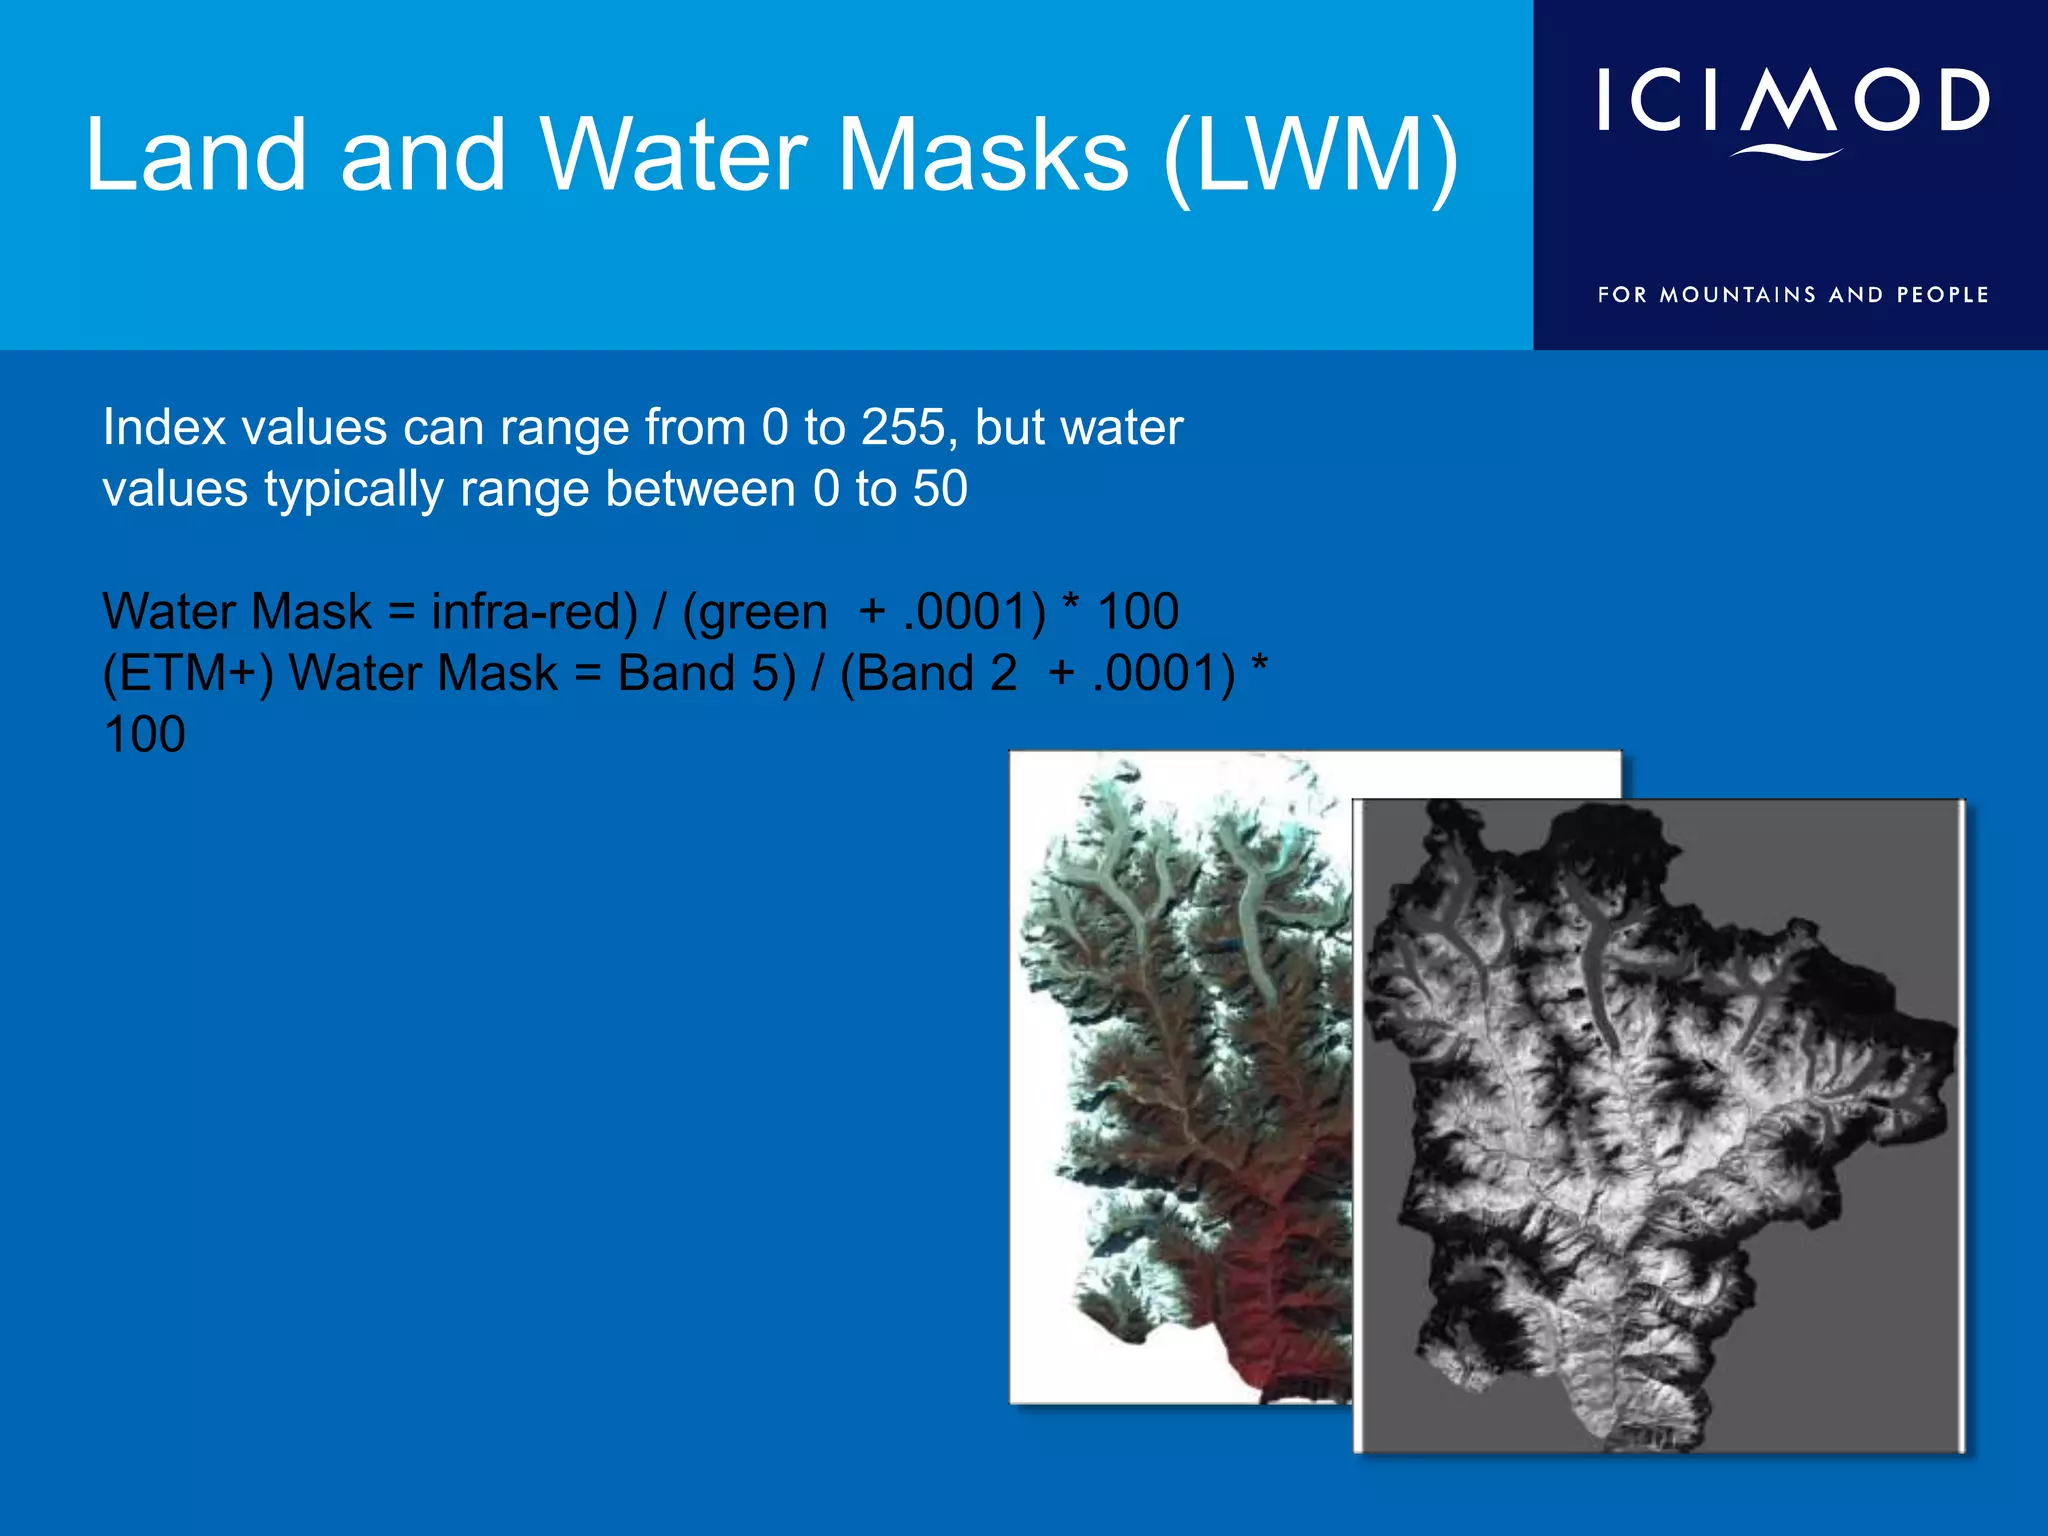
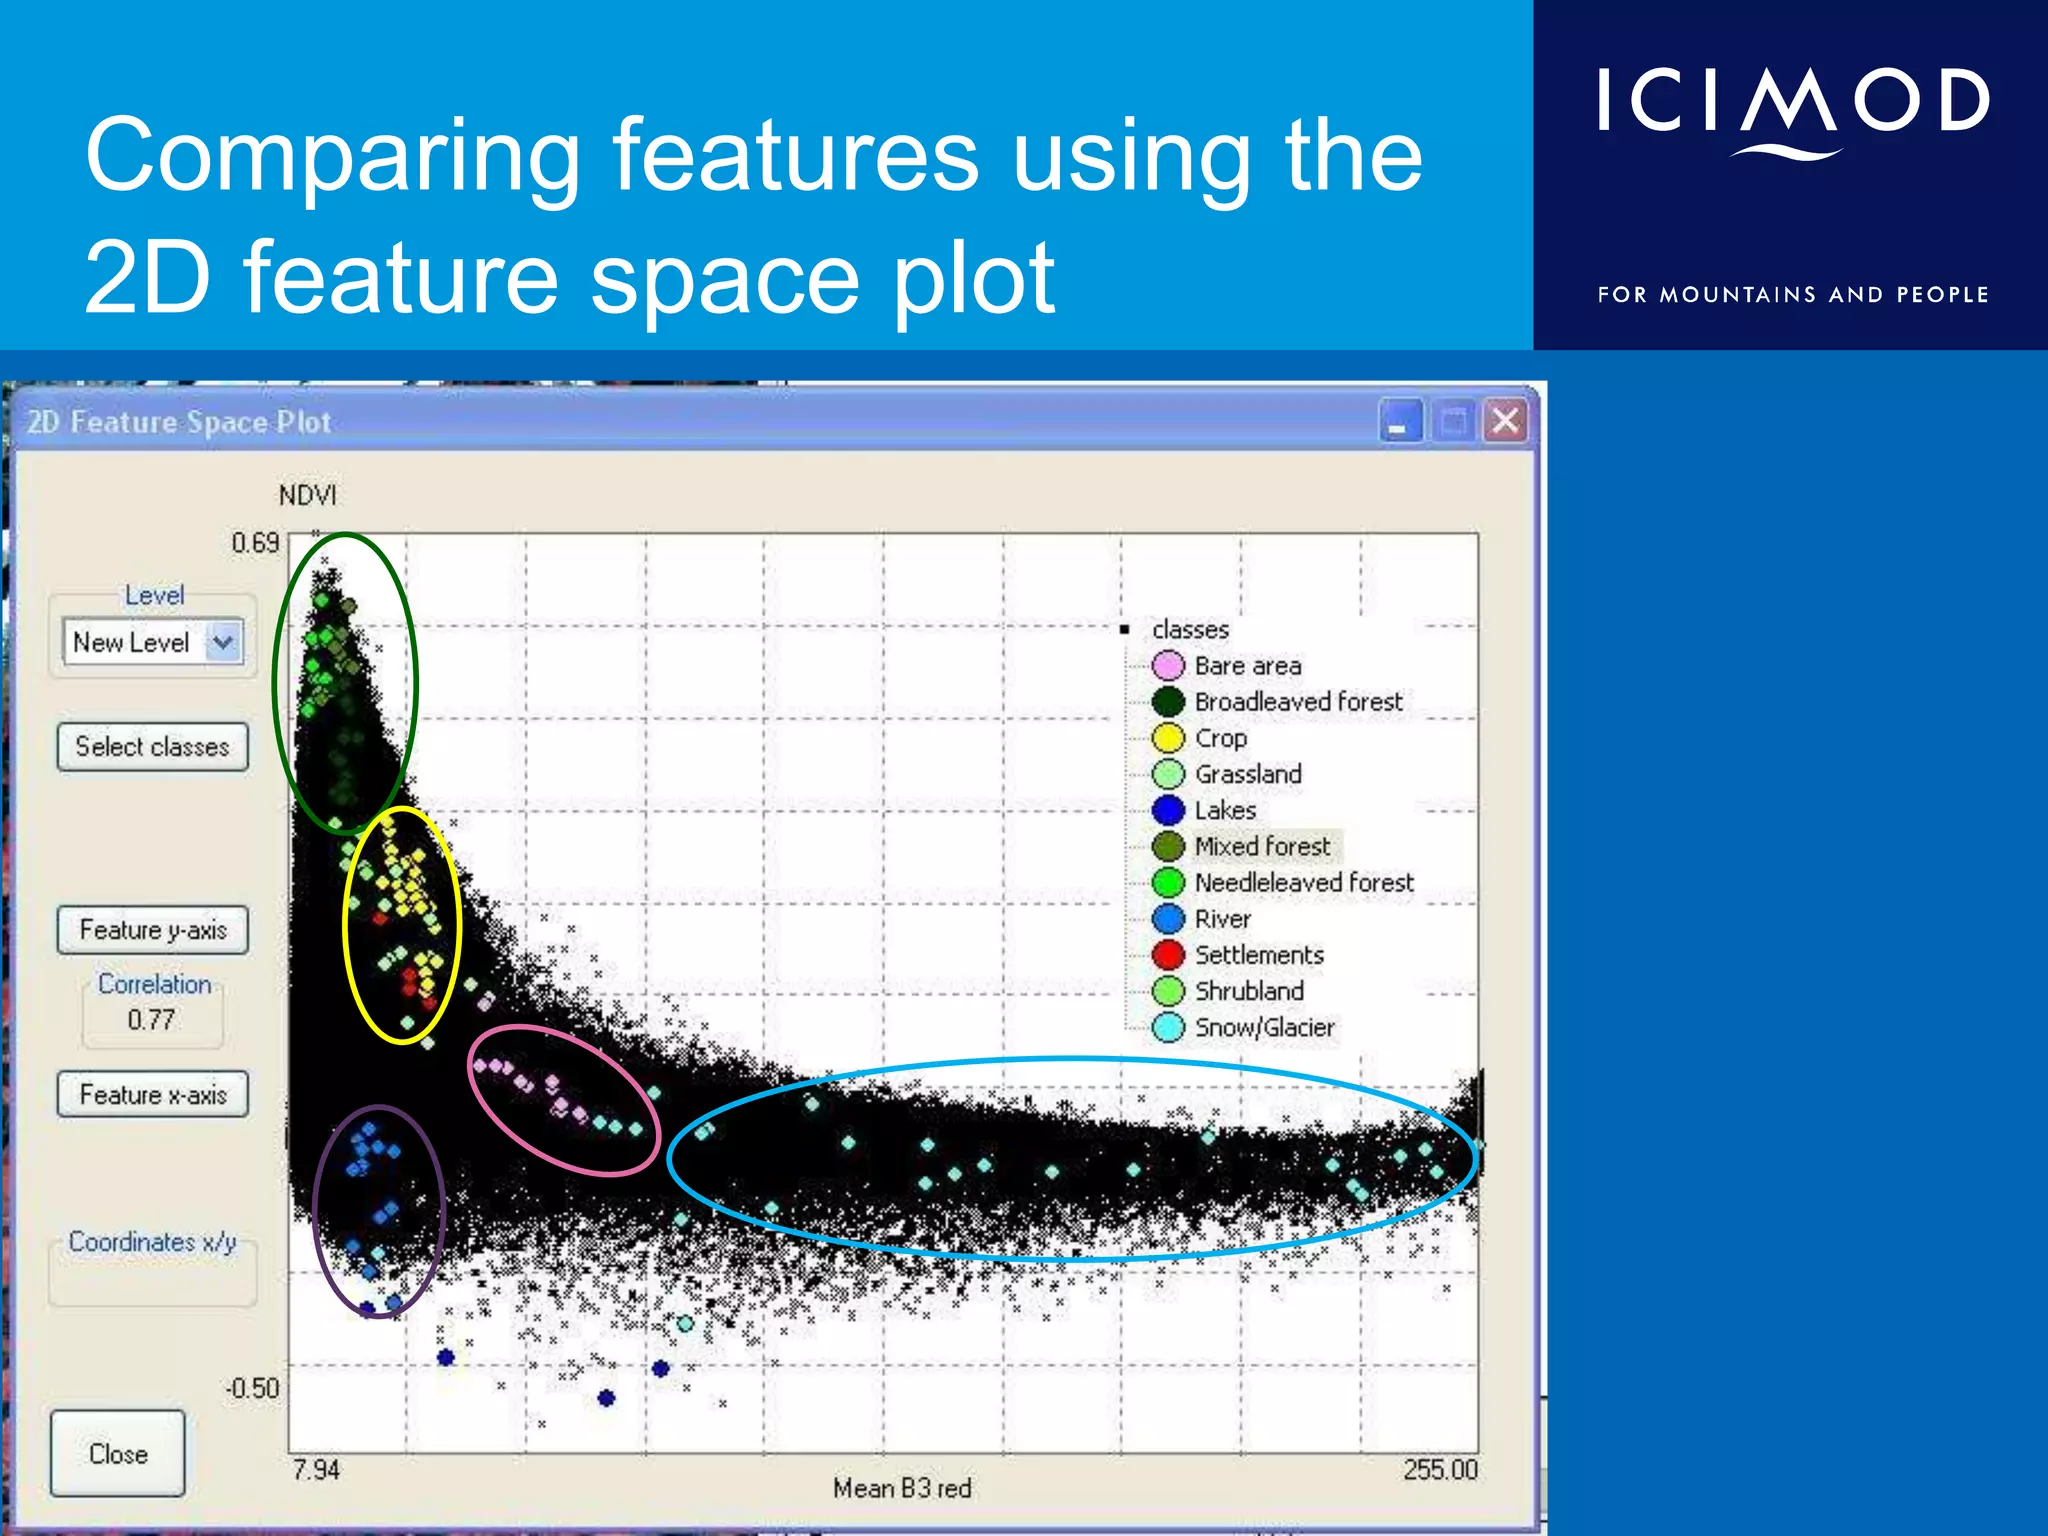
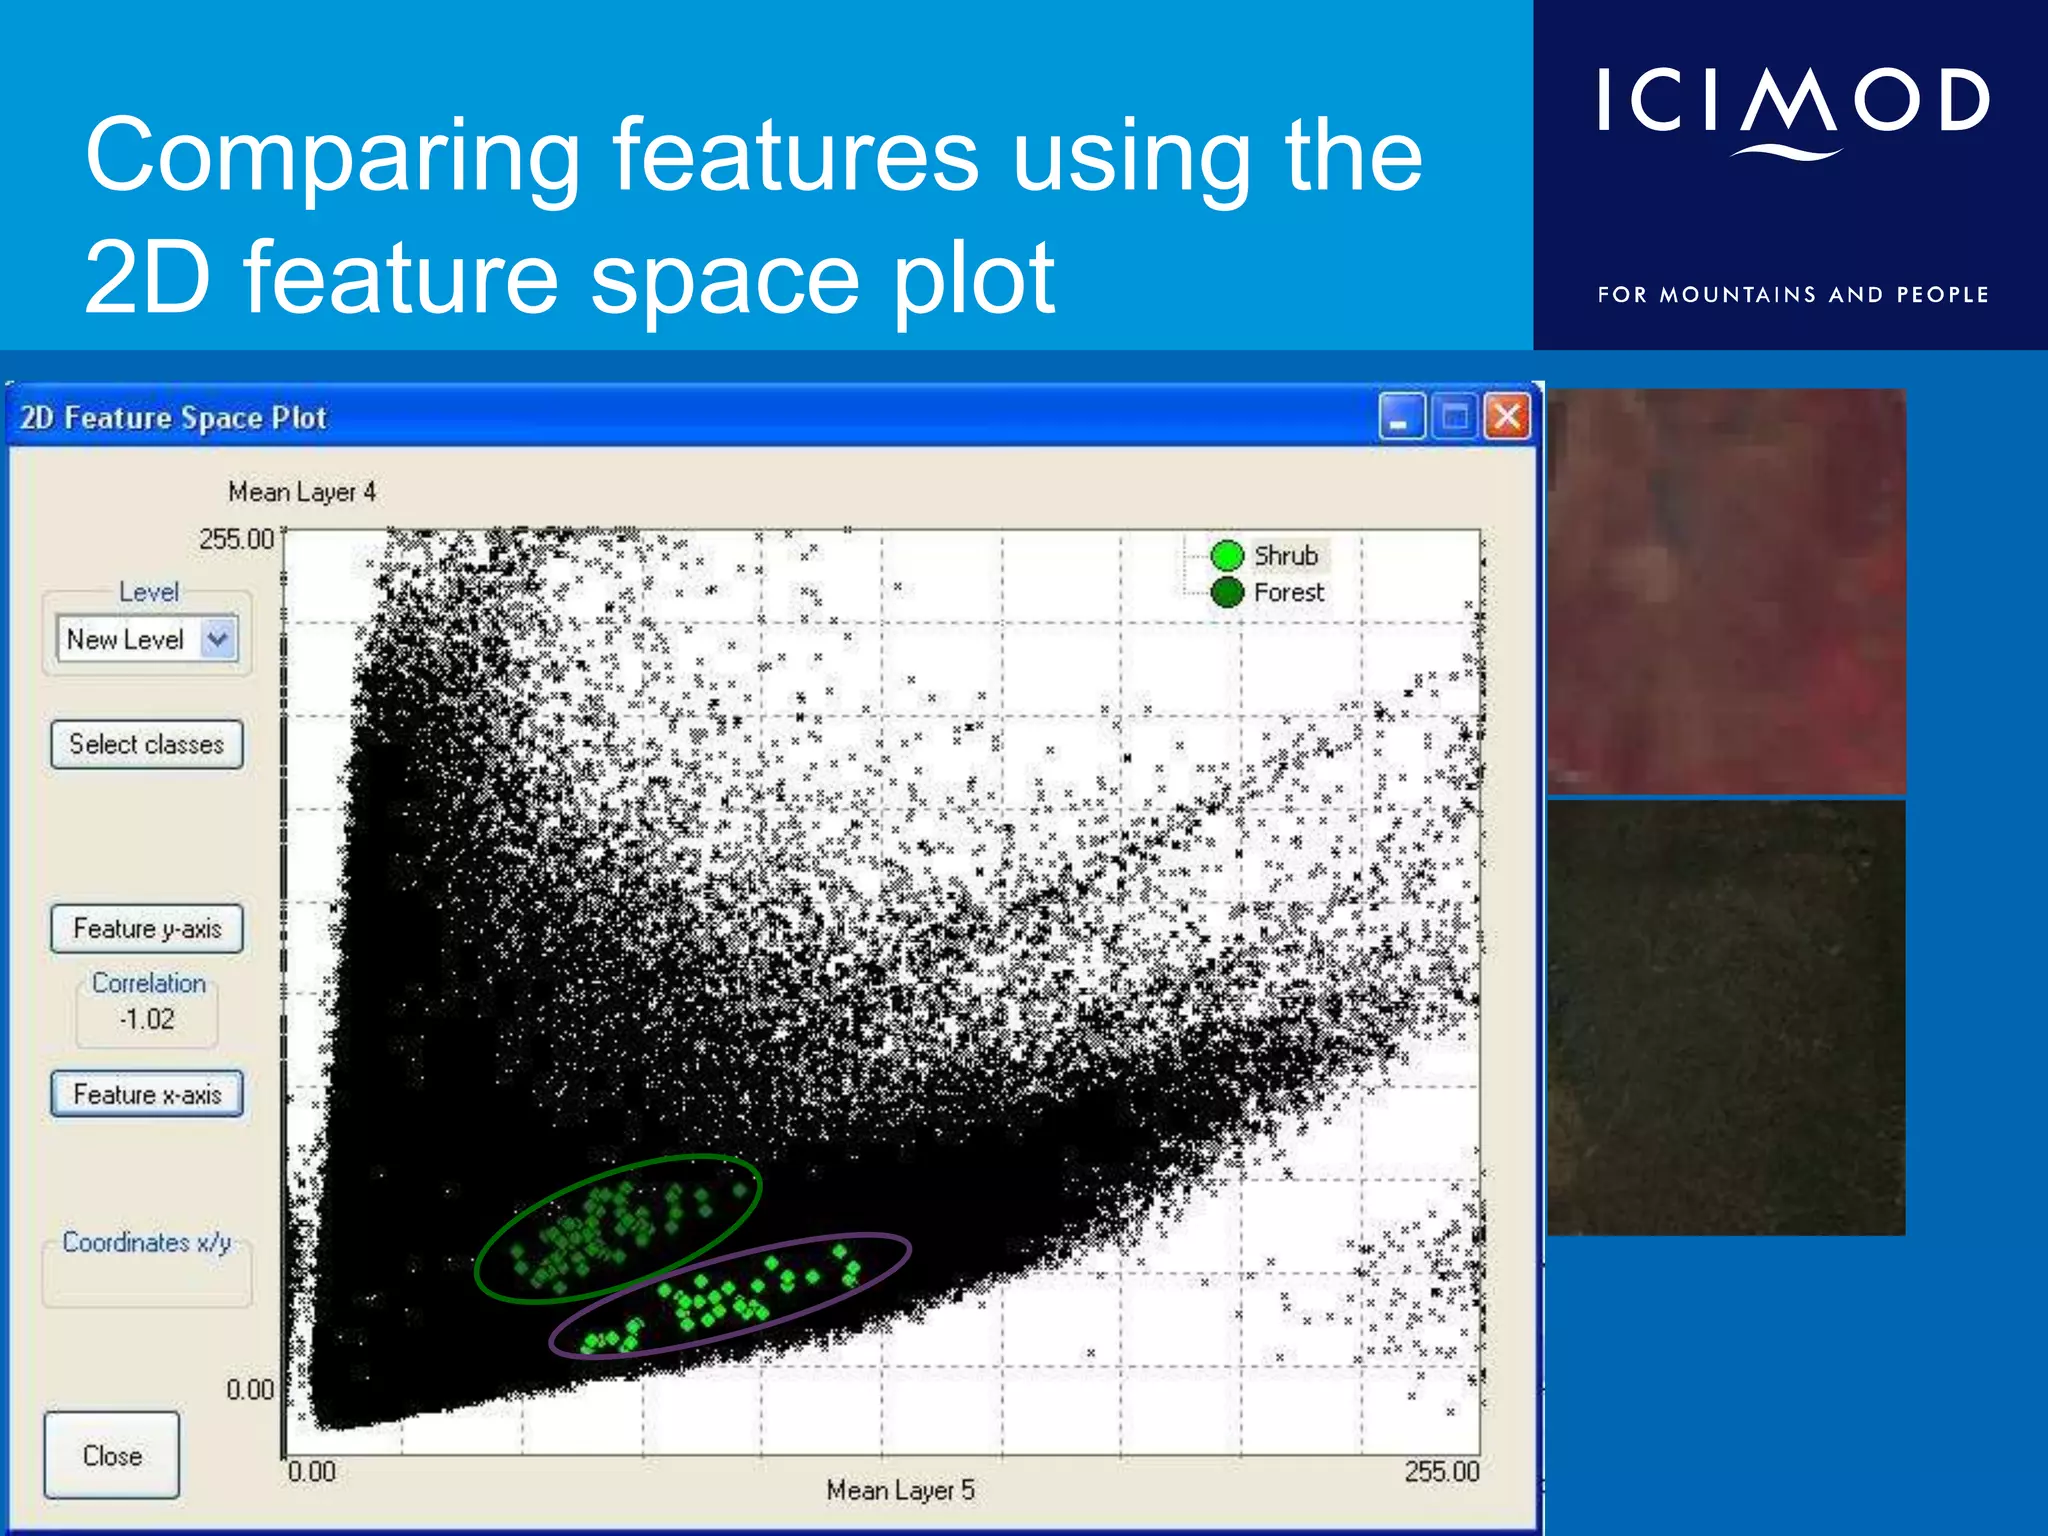


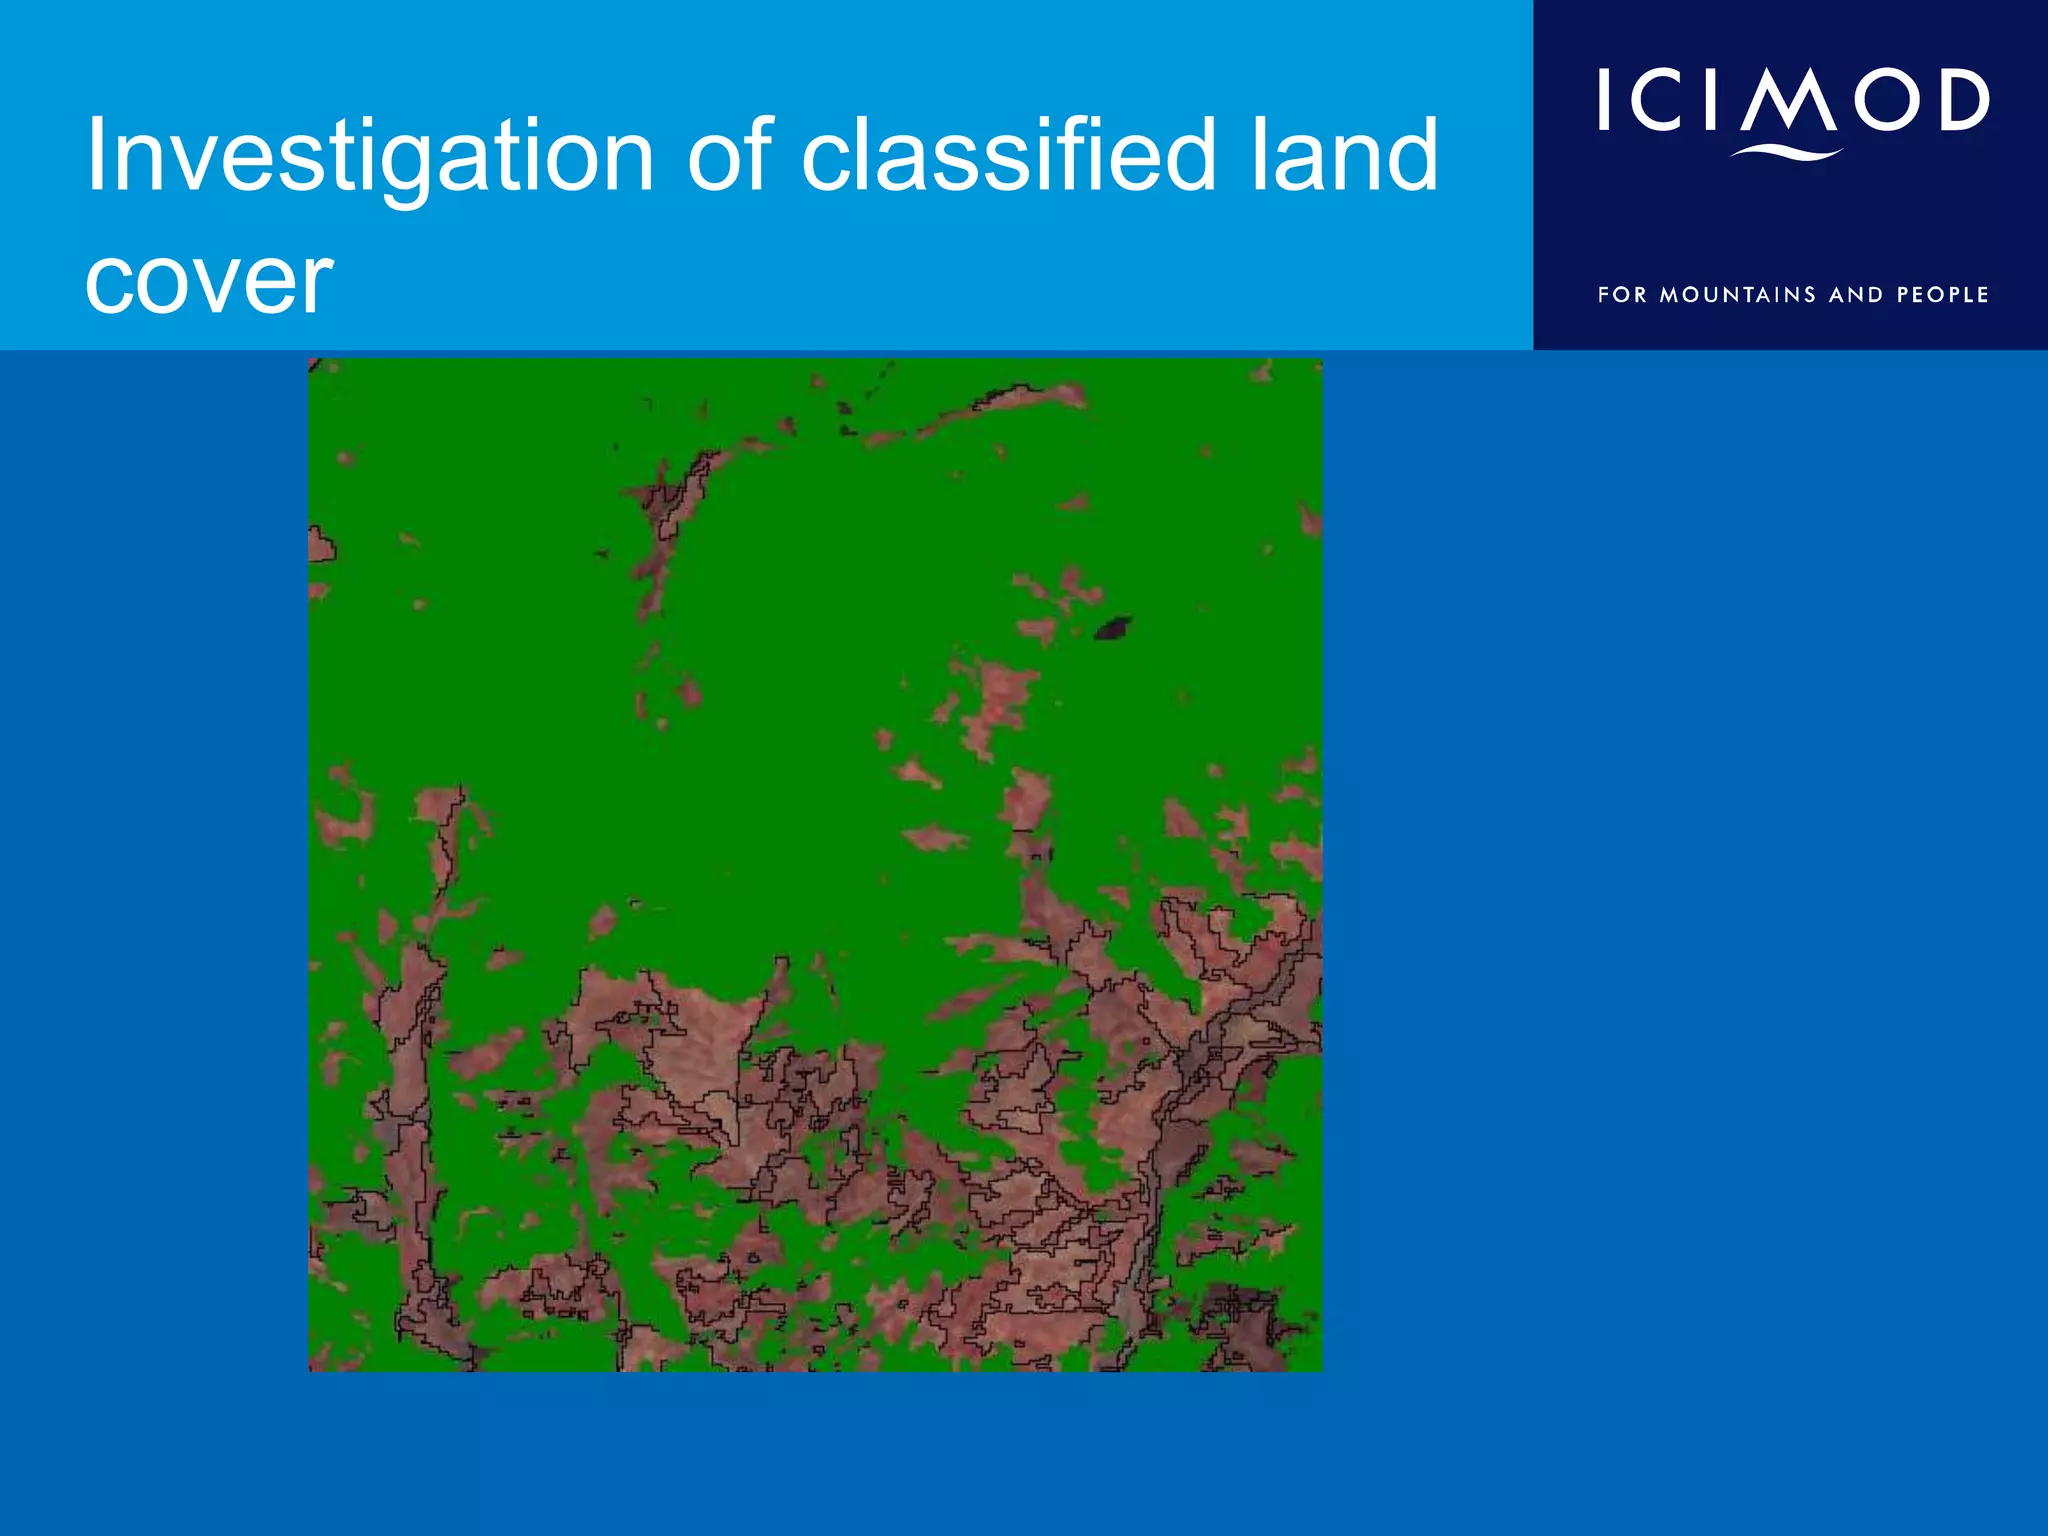
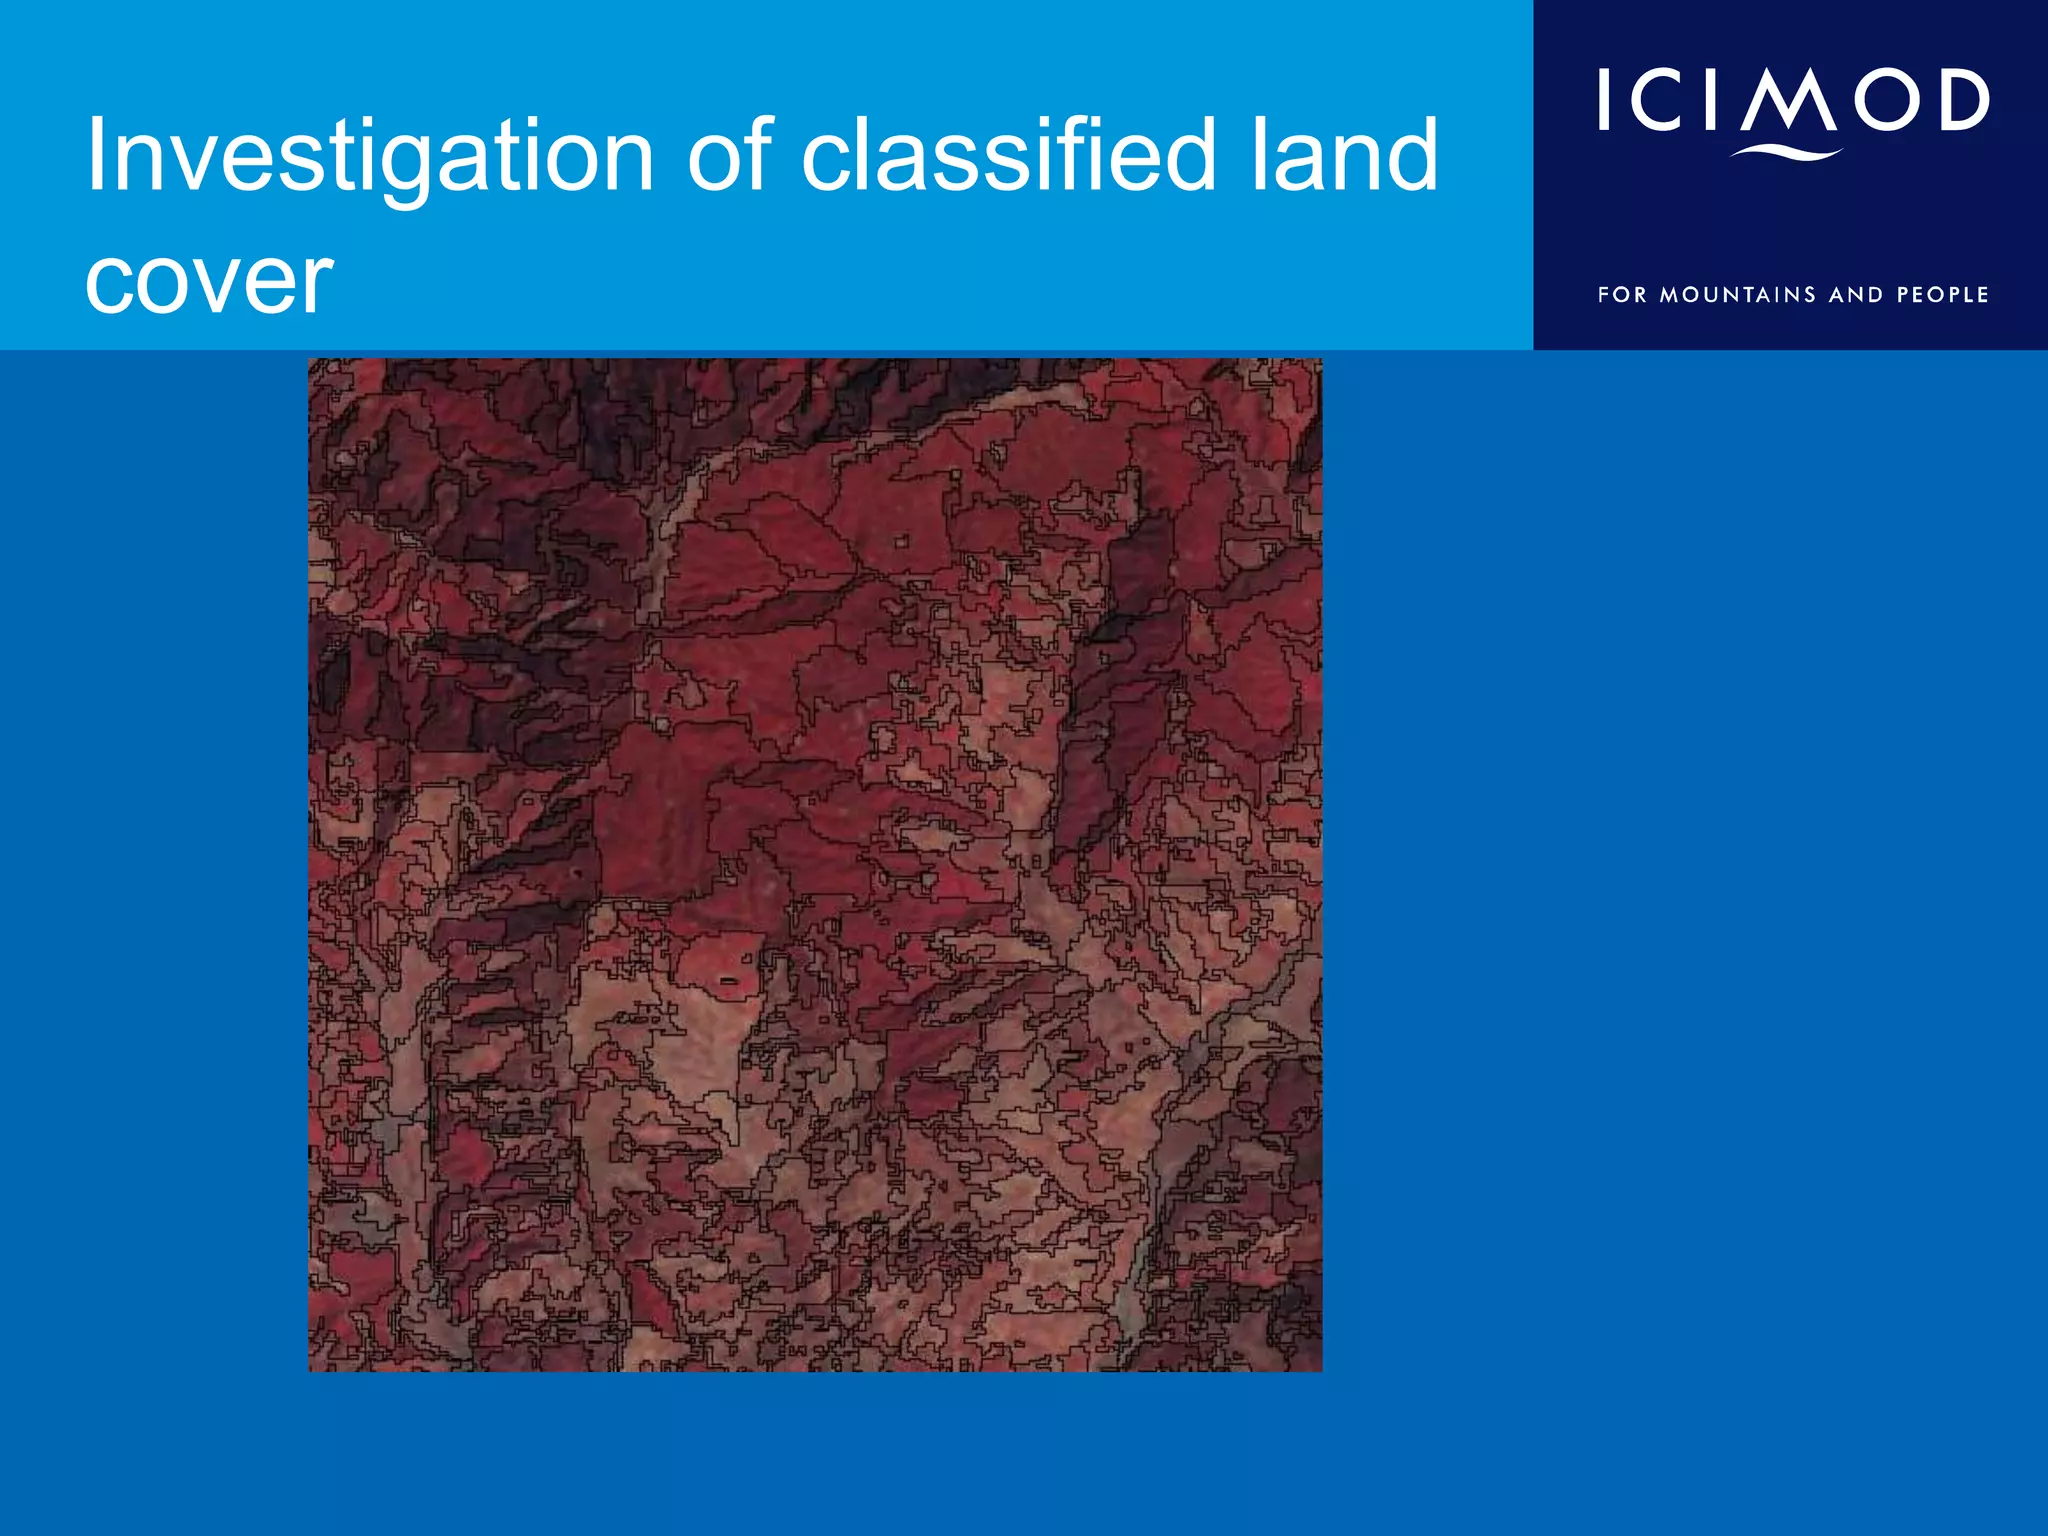
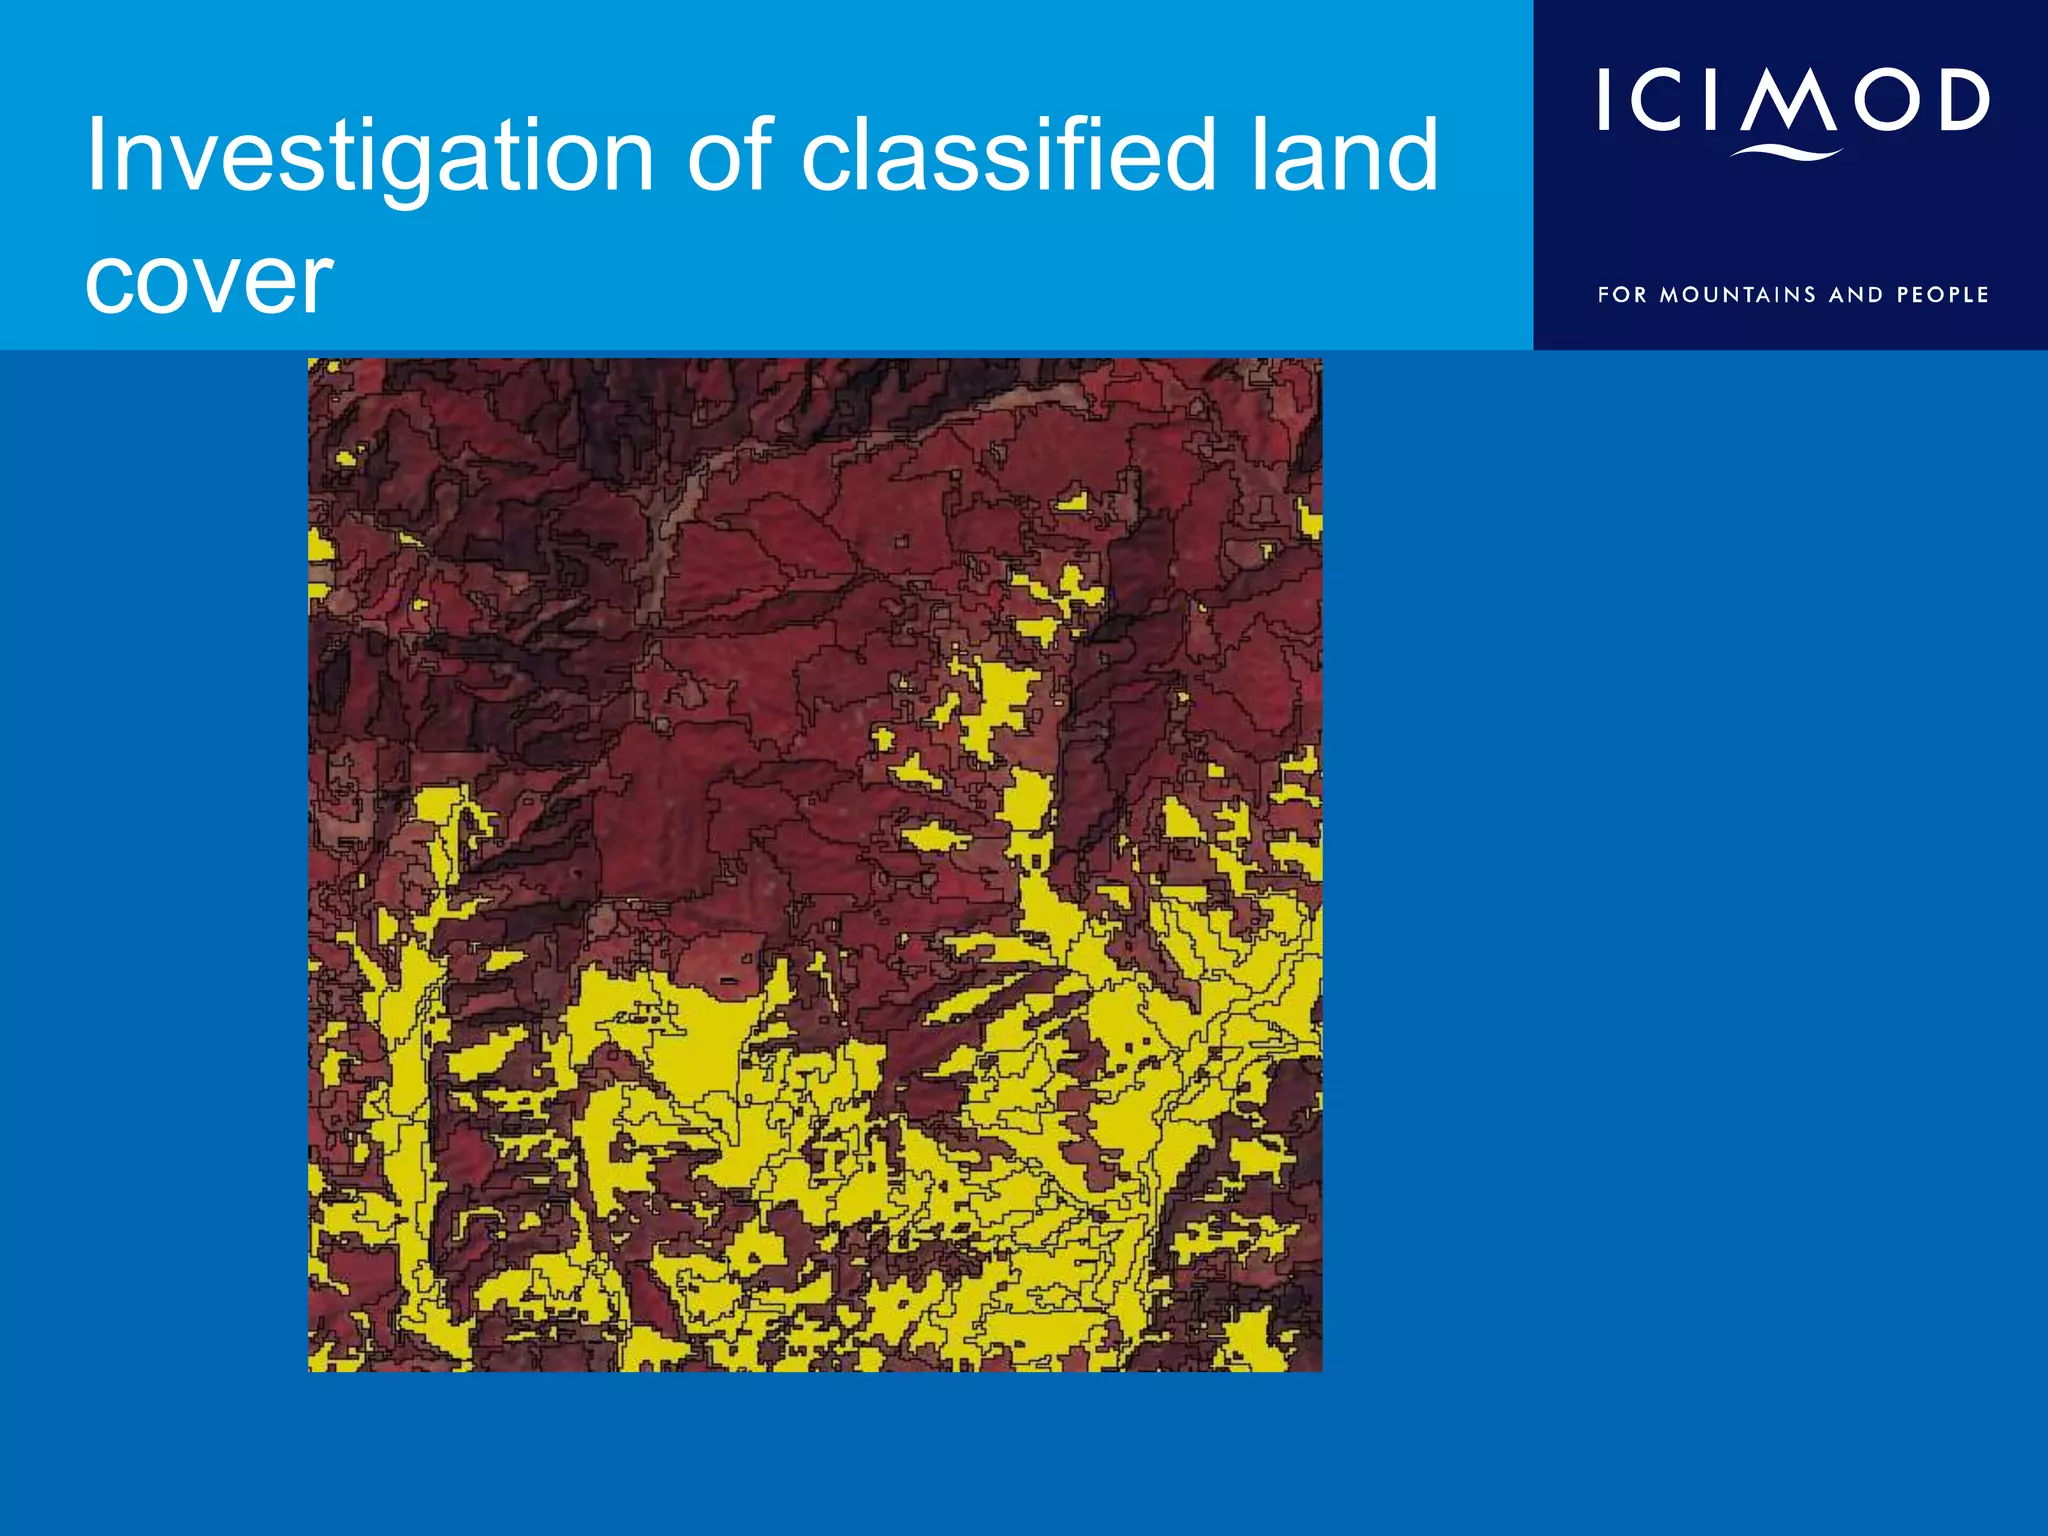
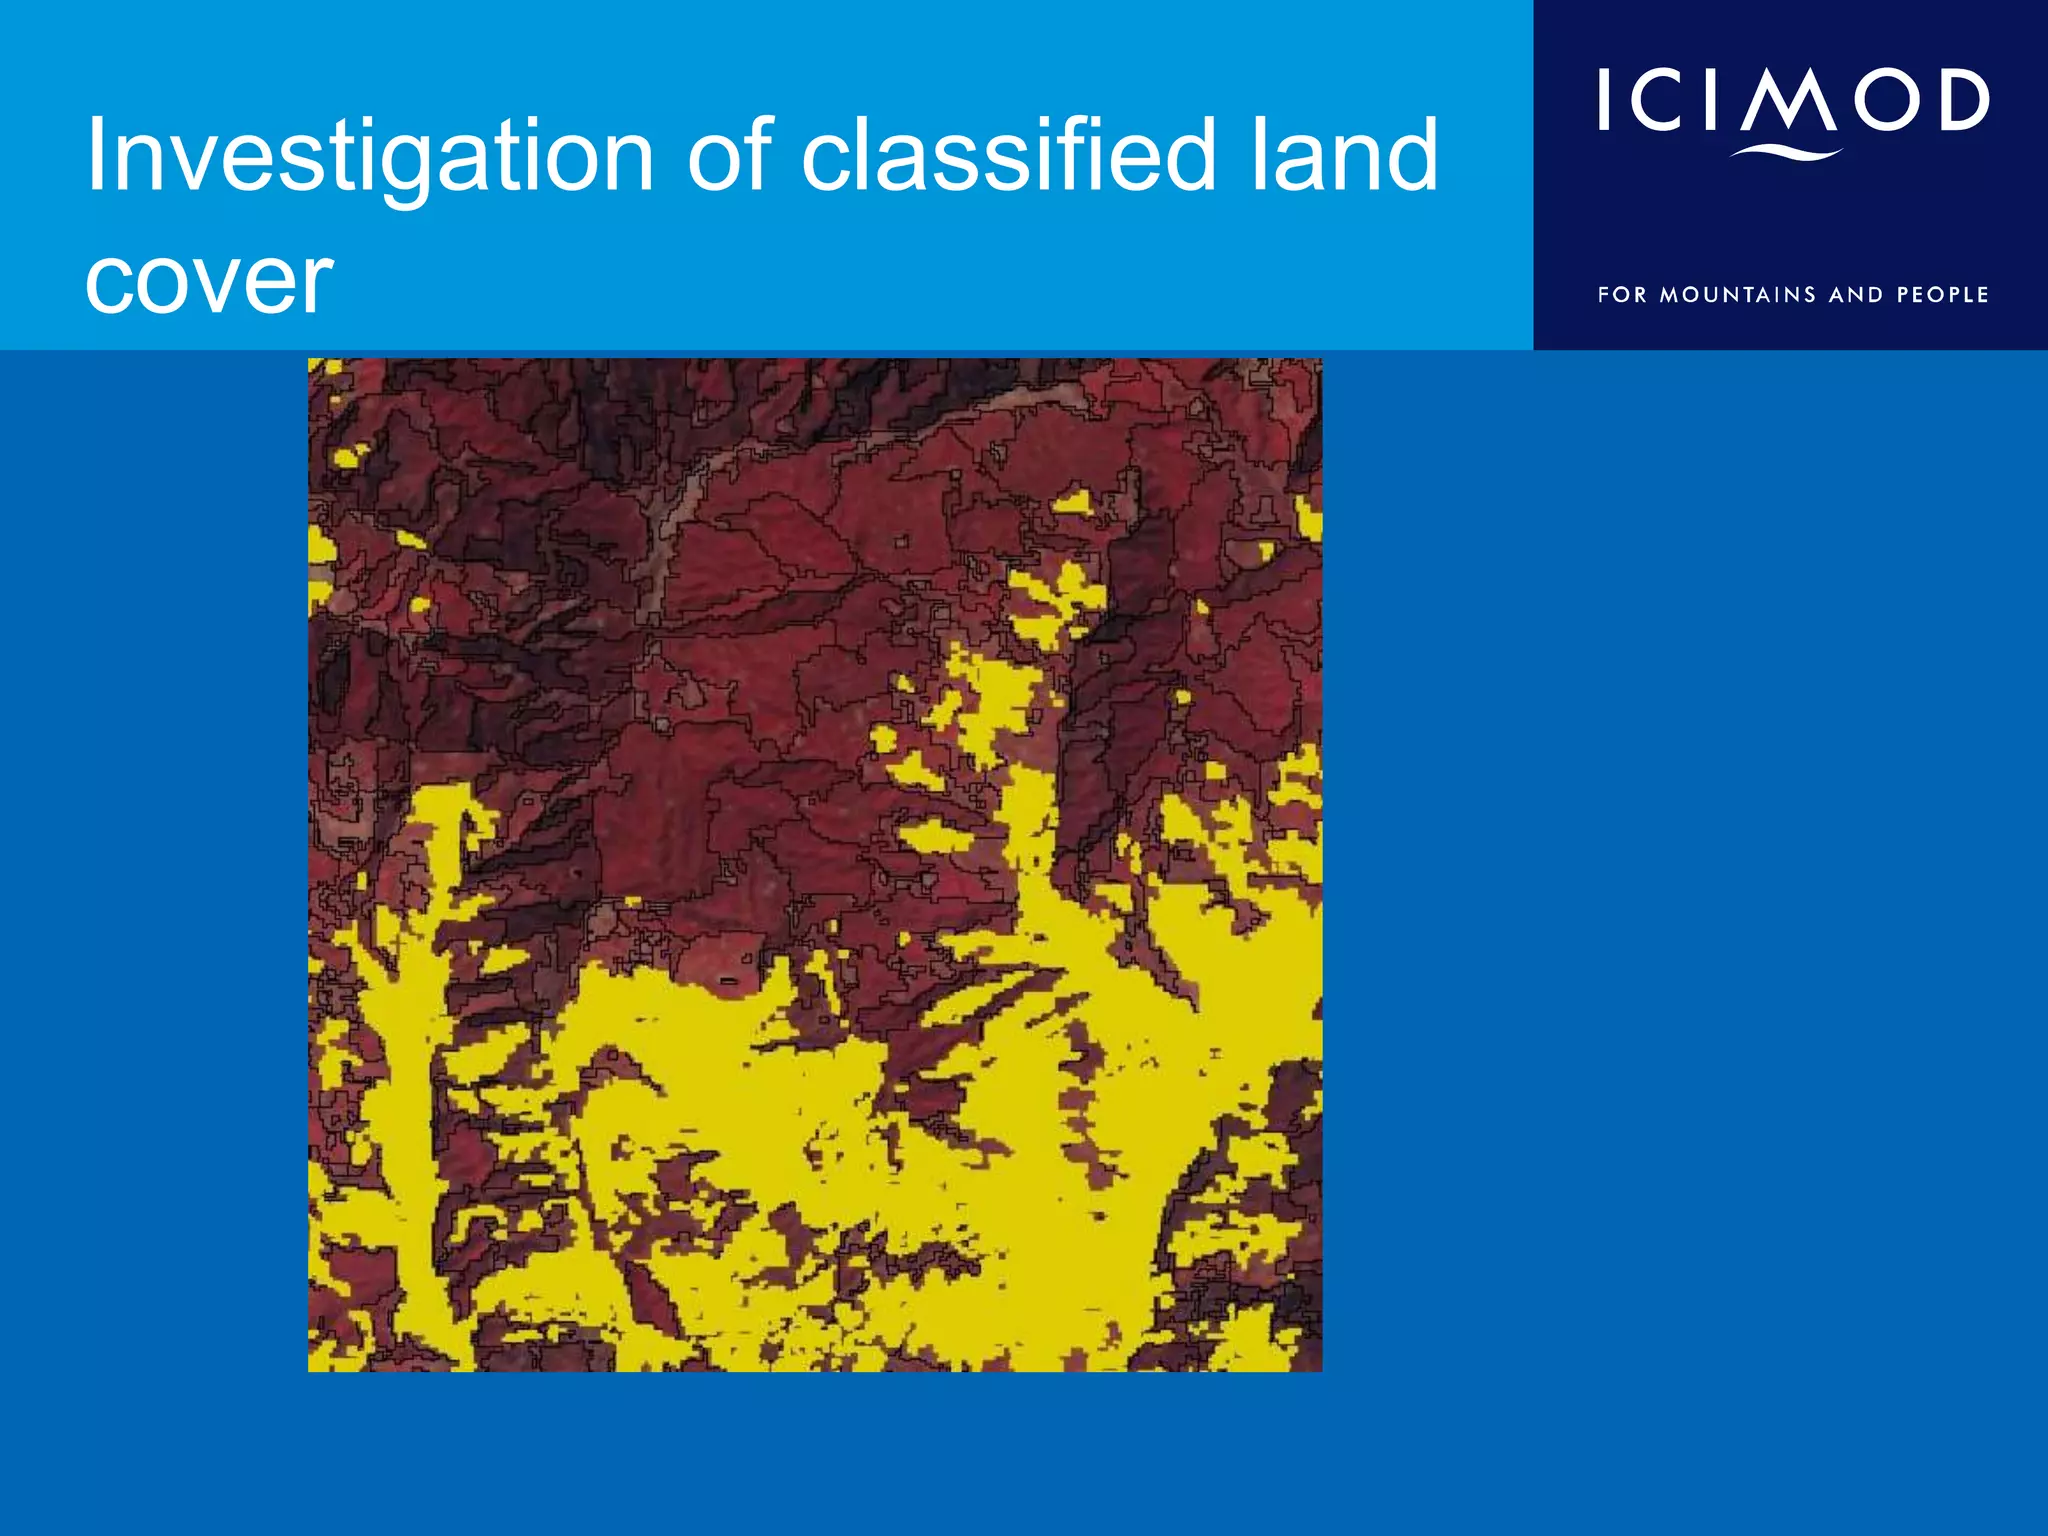
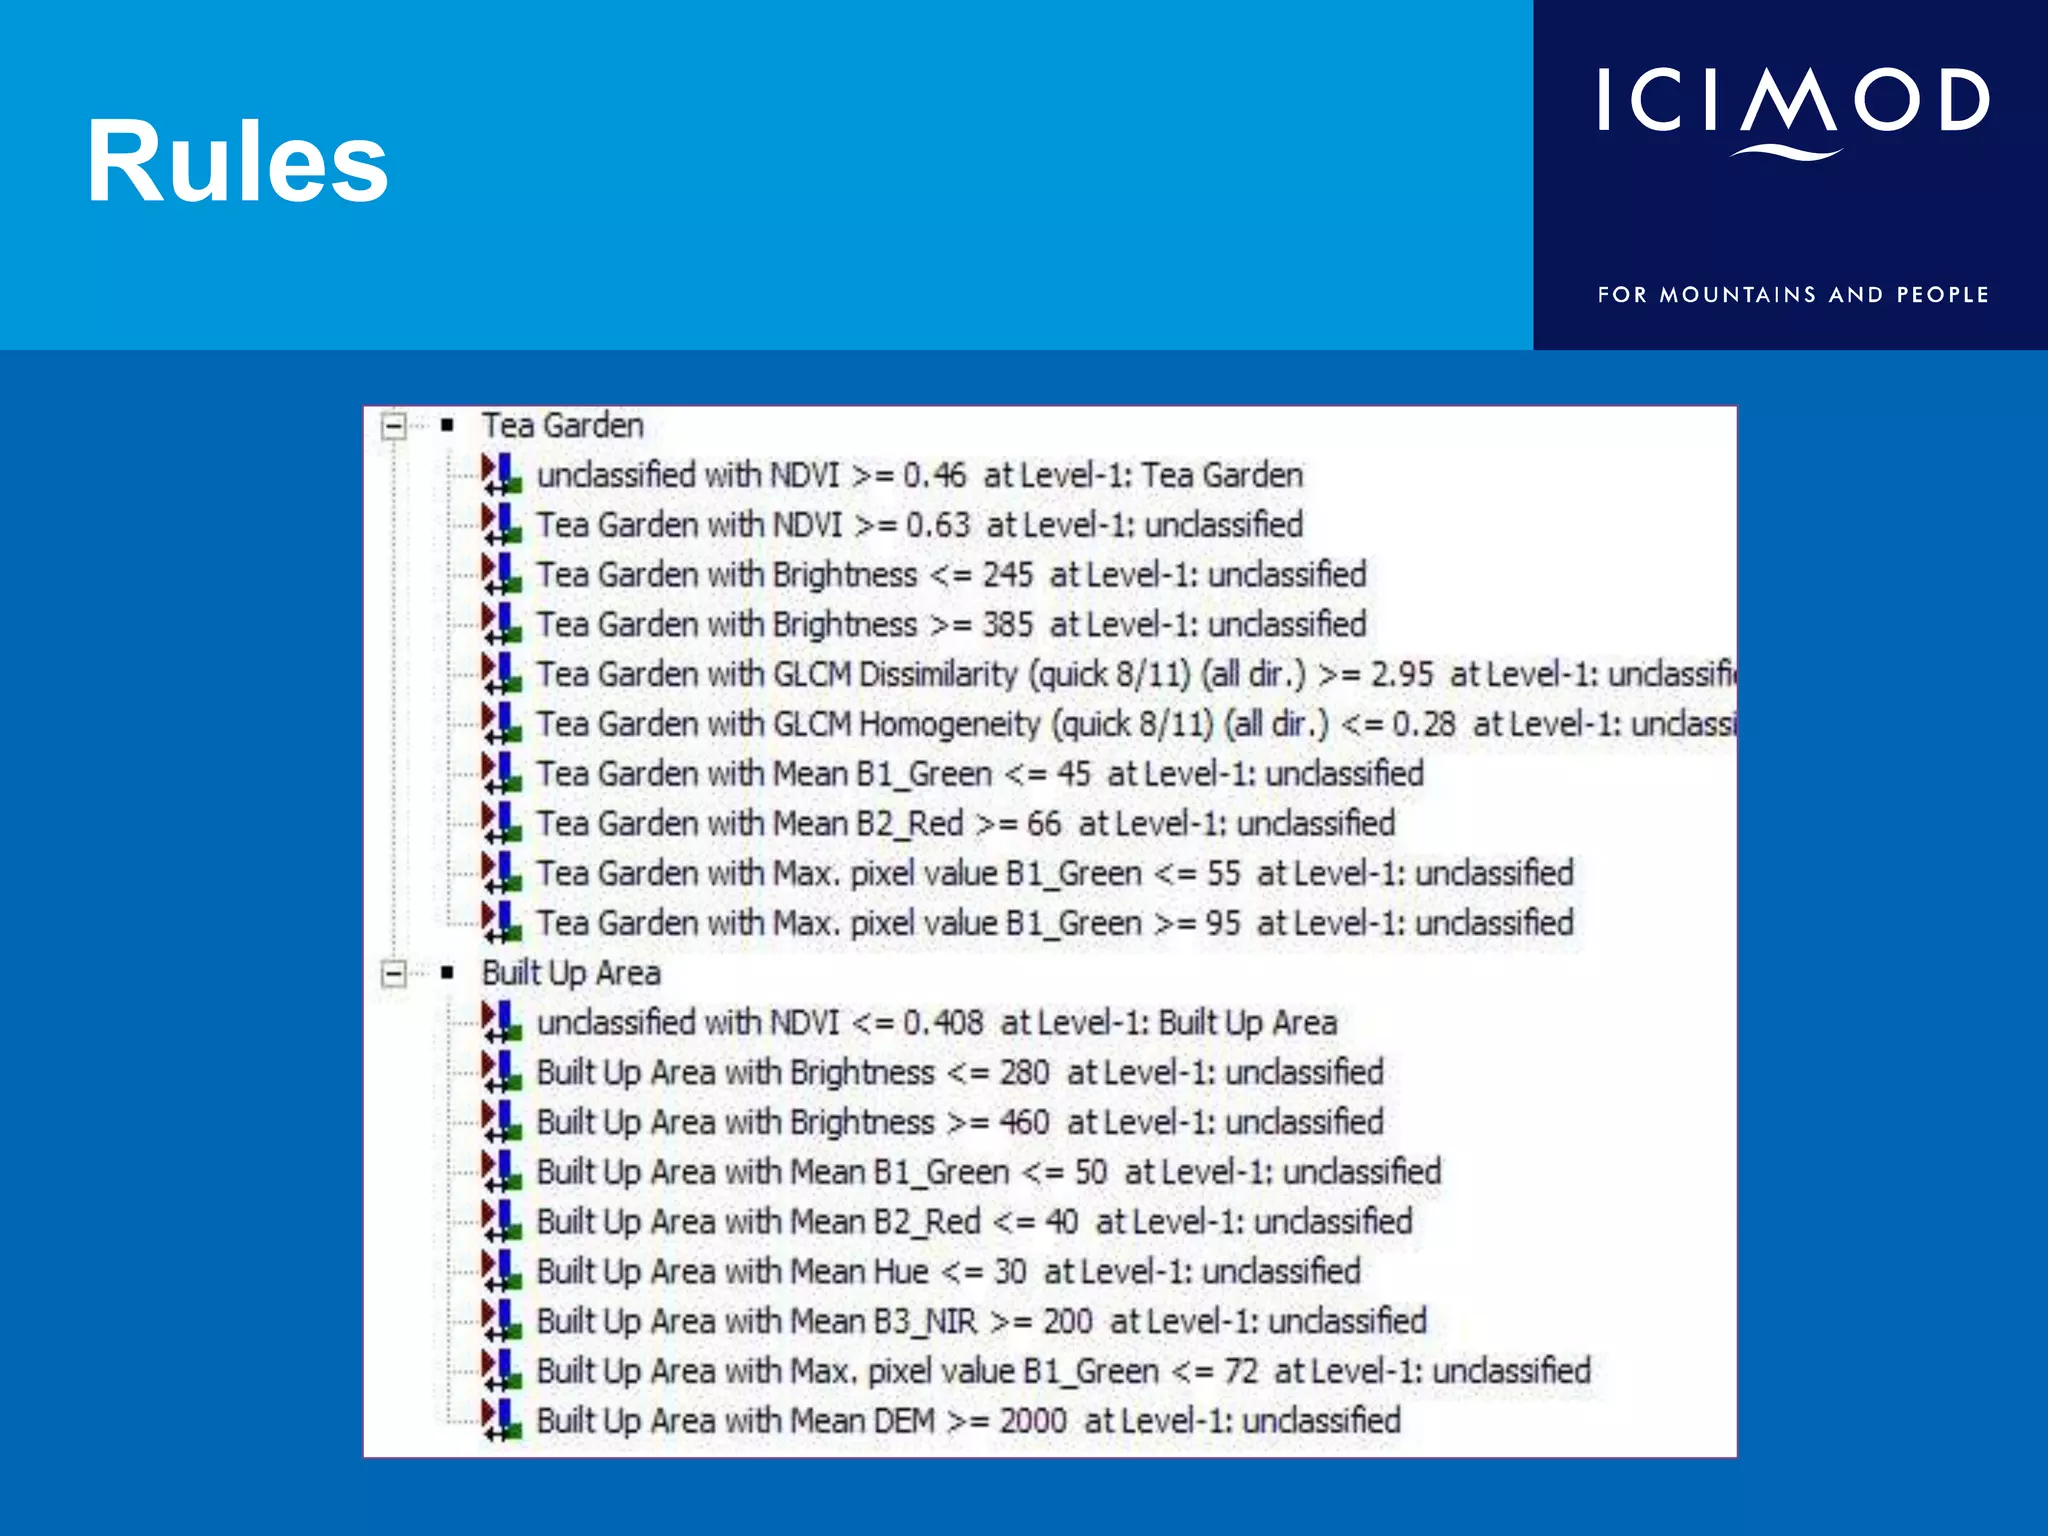


- The document discusses object-based image analysis (OBIA) and its advantages over traditional pixel-based image analysis for extracting information from remote sensing imagery. - OBIA involves segmenting images into image objects based on characteristics like color, shape, texture, and relationships between objects. These objects can then be classified thematically. - Several software packages that perform OBIA are discussed, including eCognition, IDRISI, ENVI, and MadCat. Key steps in the OBIA process like segmentation, classification rule development, and accuracy assessment are also outlined. - An example of using OBIA to extract water features from a high resolution image is provided to illustrate the technique.


