Download to read offline
![www.1stepgrow.com
>>> sns.set_context("talk")
>>> sns.set_palette("husl",3)
>>> sns.set_palette(flatui)
>>> flatui = "#9b59b6", "#3498db",
"#95a5a6","#e74c3c","#34495e",
"#2ecc71"]
>>> sns.color_palette("husl")
>>> sns.set_context("notebook",
font_scale=1.5, rc=
{"lines.linewidth":2.5})
Set context to "talk"
Define the color palette
Set your own color palette
Use with with to temporarily set
palette
Set context to "notebook",
Scale font elements
andoverride param mapping
Seaborn styles
Context Functions
Color Palette](https://image.slidesharecdn.com/07-250207115053-5c18e963/85/python-for-data-science-Datascience-Python-4-320.jpg)

![www.1stepgrow.com
>>> sns.set_context("talk")
>>> sns.set_palette("husl",3)
>>> sns.set_palette(flatui)
>>> flatui = "#9b59b6", "#3498db",
"#95a5a6","#e74c3c","#34495e",
"#2ecc71"]
>>> sns.color_palette("husl")
>>> sns.set_context("notebook",
font_scale=1.5, rc=
{"lines.linewidth":2.5})
Set context to "talk"
Define the color palette
Set your own color palette
Use with with to temporarily set
palette
Set context to "notebook",
Scale font elements
andoverride param mapping
Seaborn styles
Context Functions
Color Palette](https://image.slidesharecdn.com/07-250207115053-5c18e963/75/python-for-data-science-Datascience-Python-4-2048.jpg)


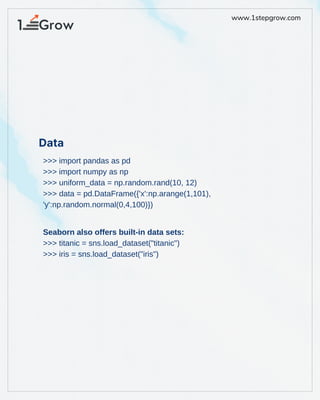
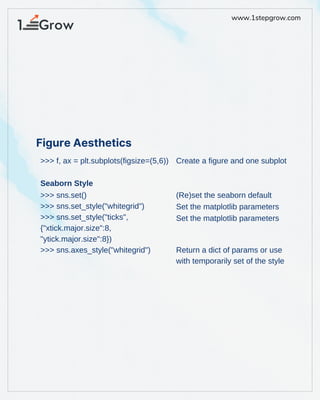
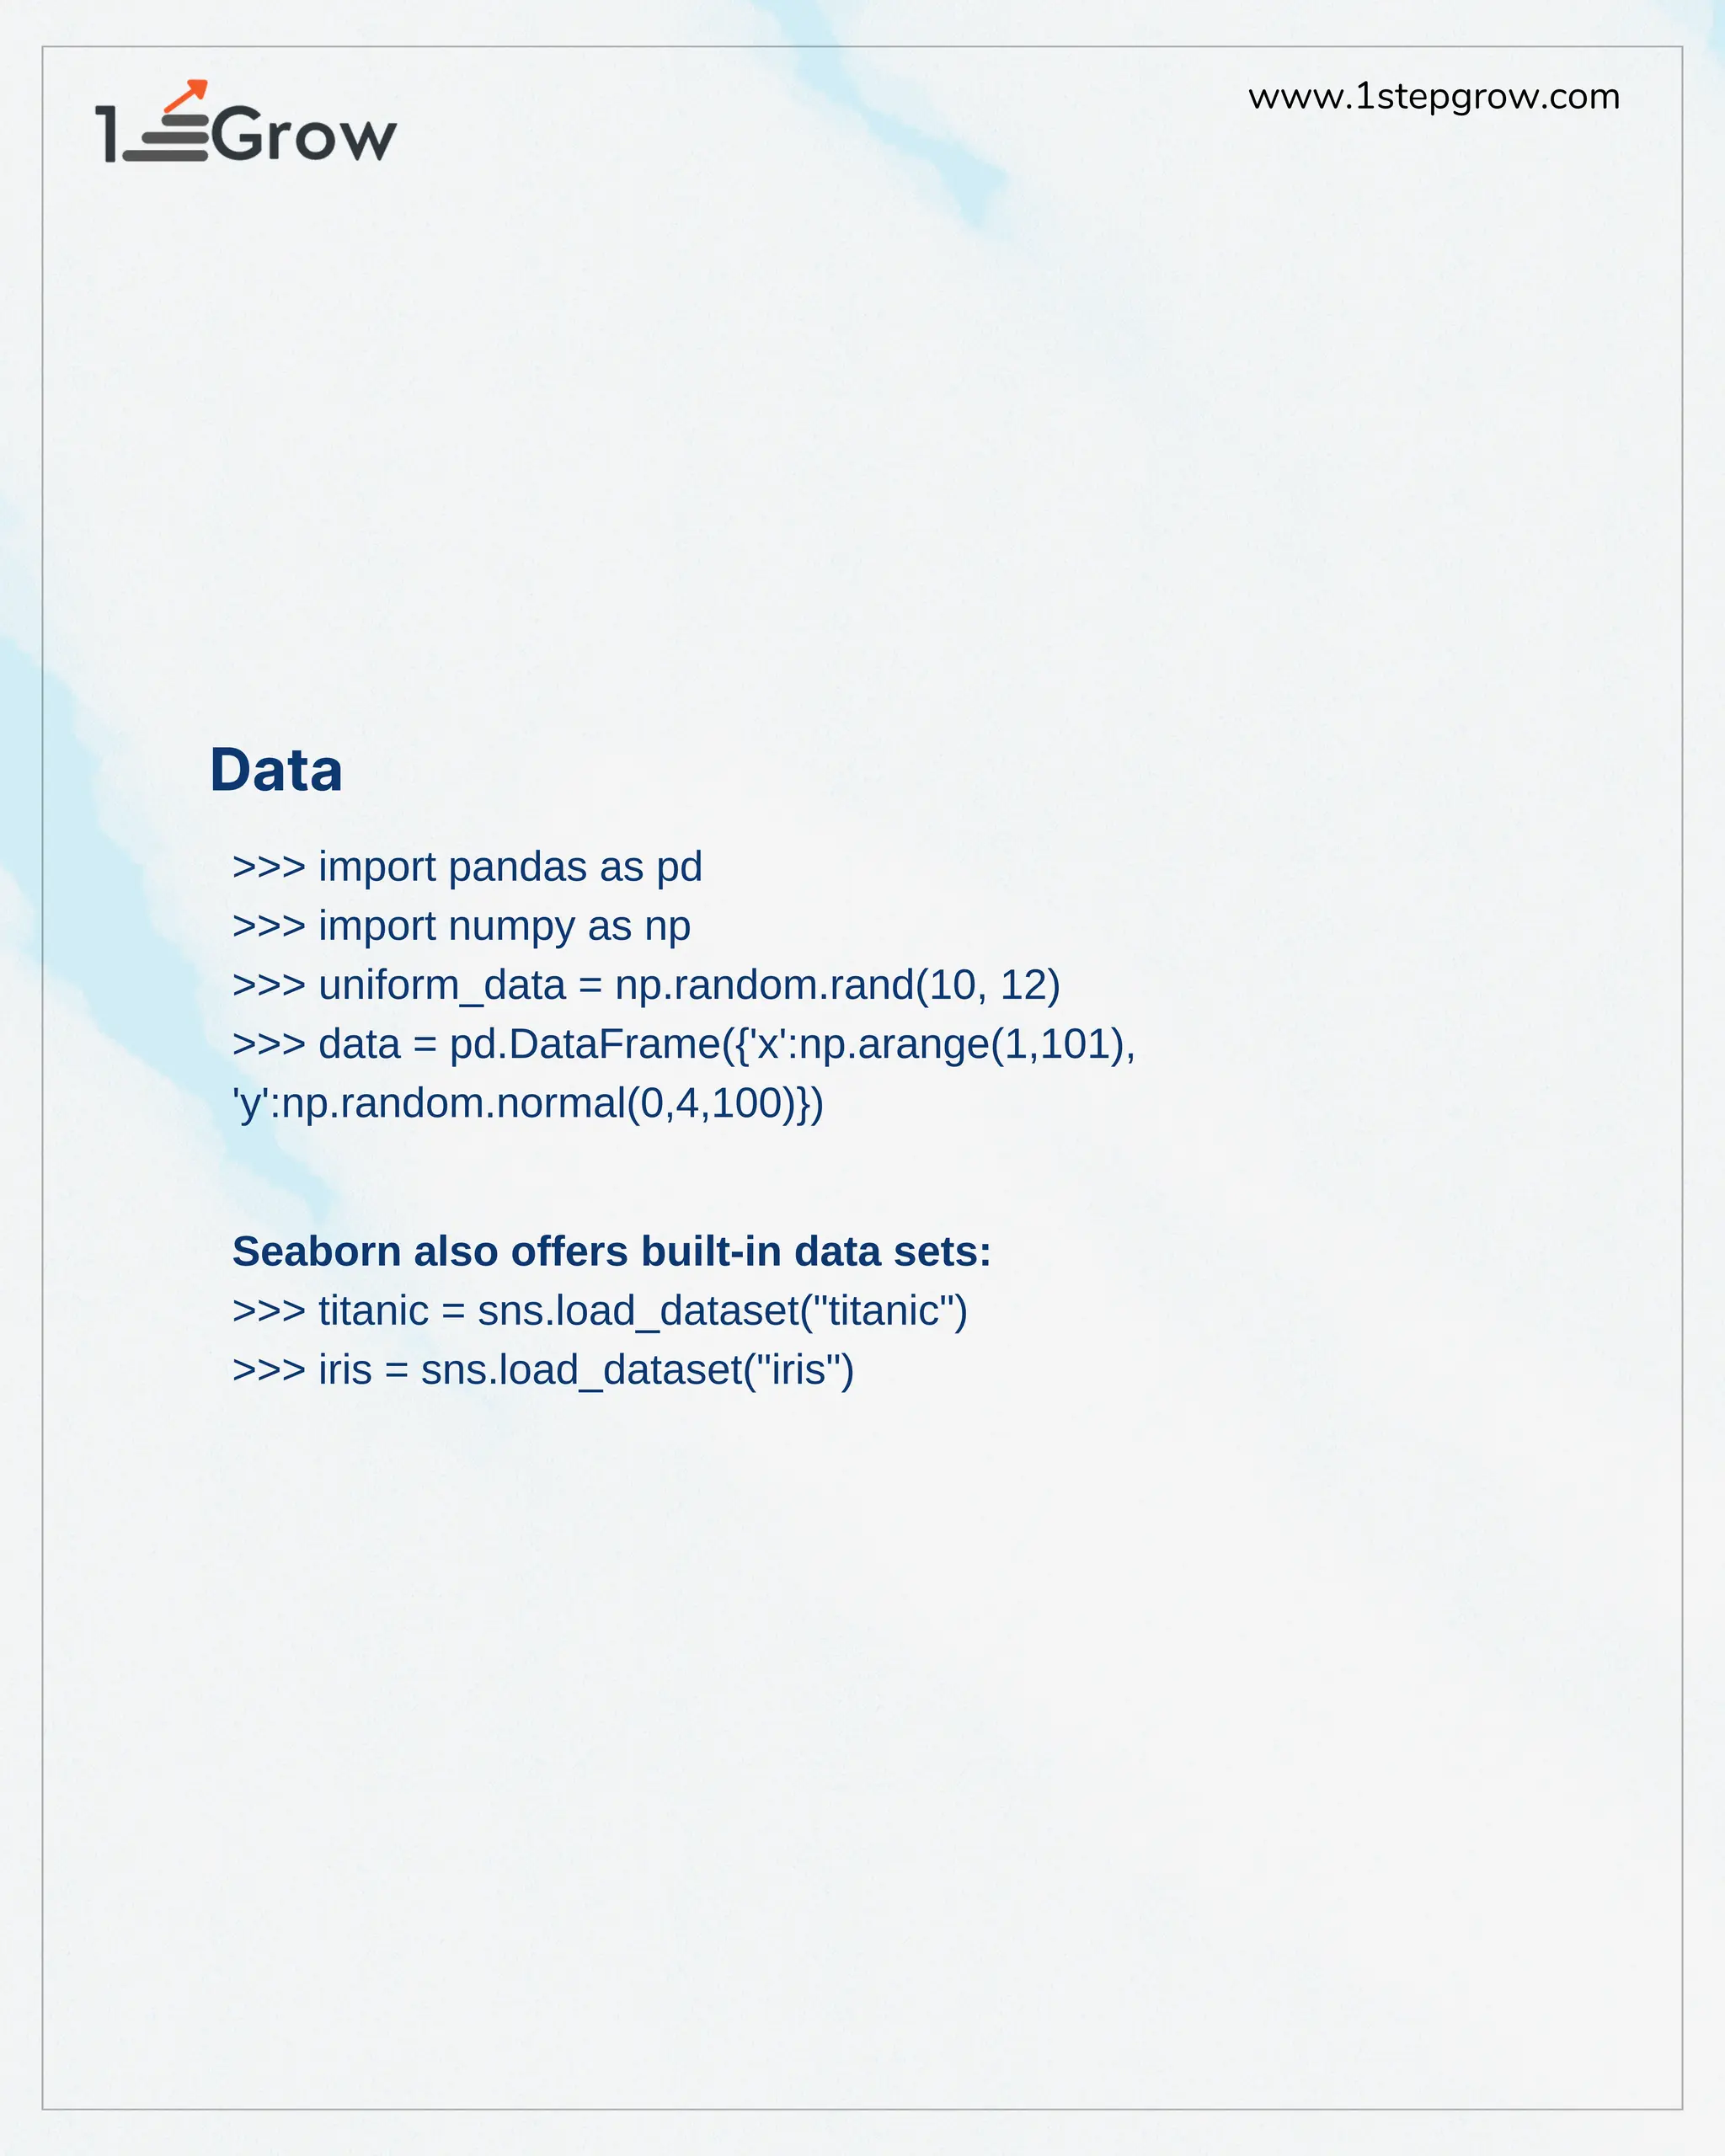
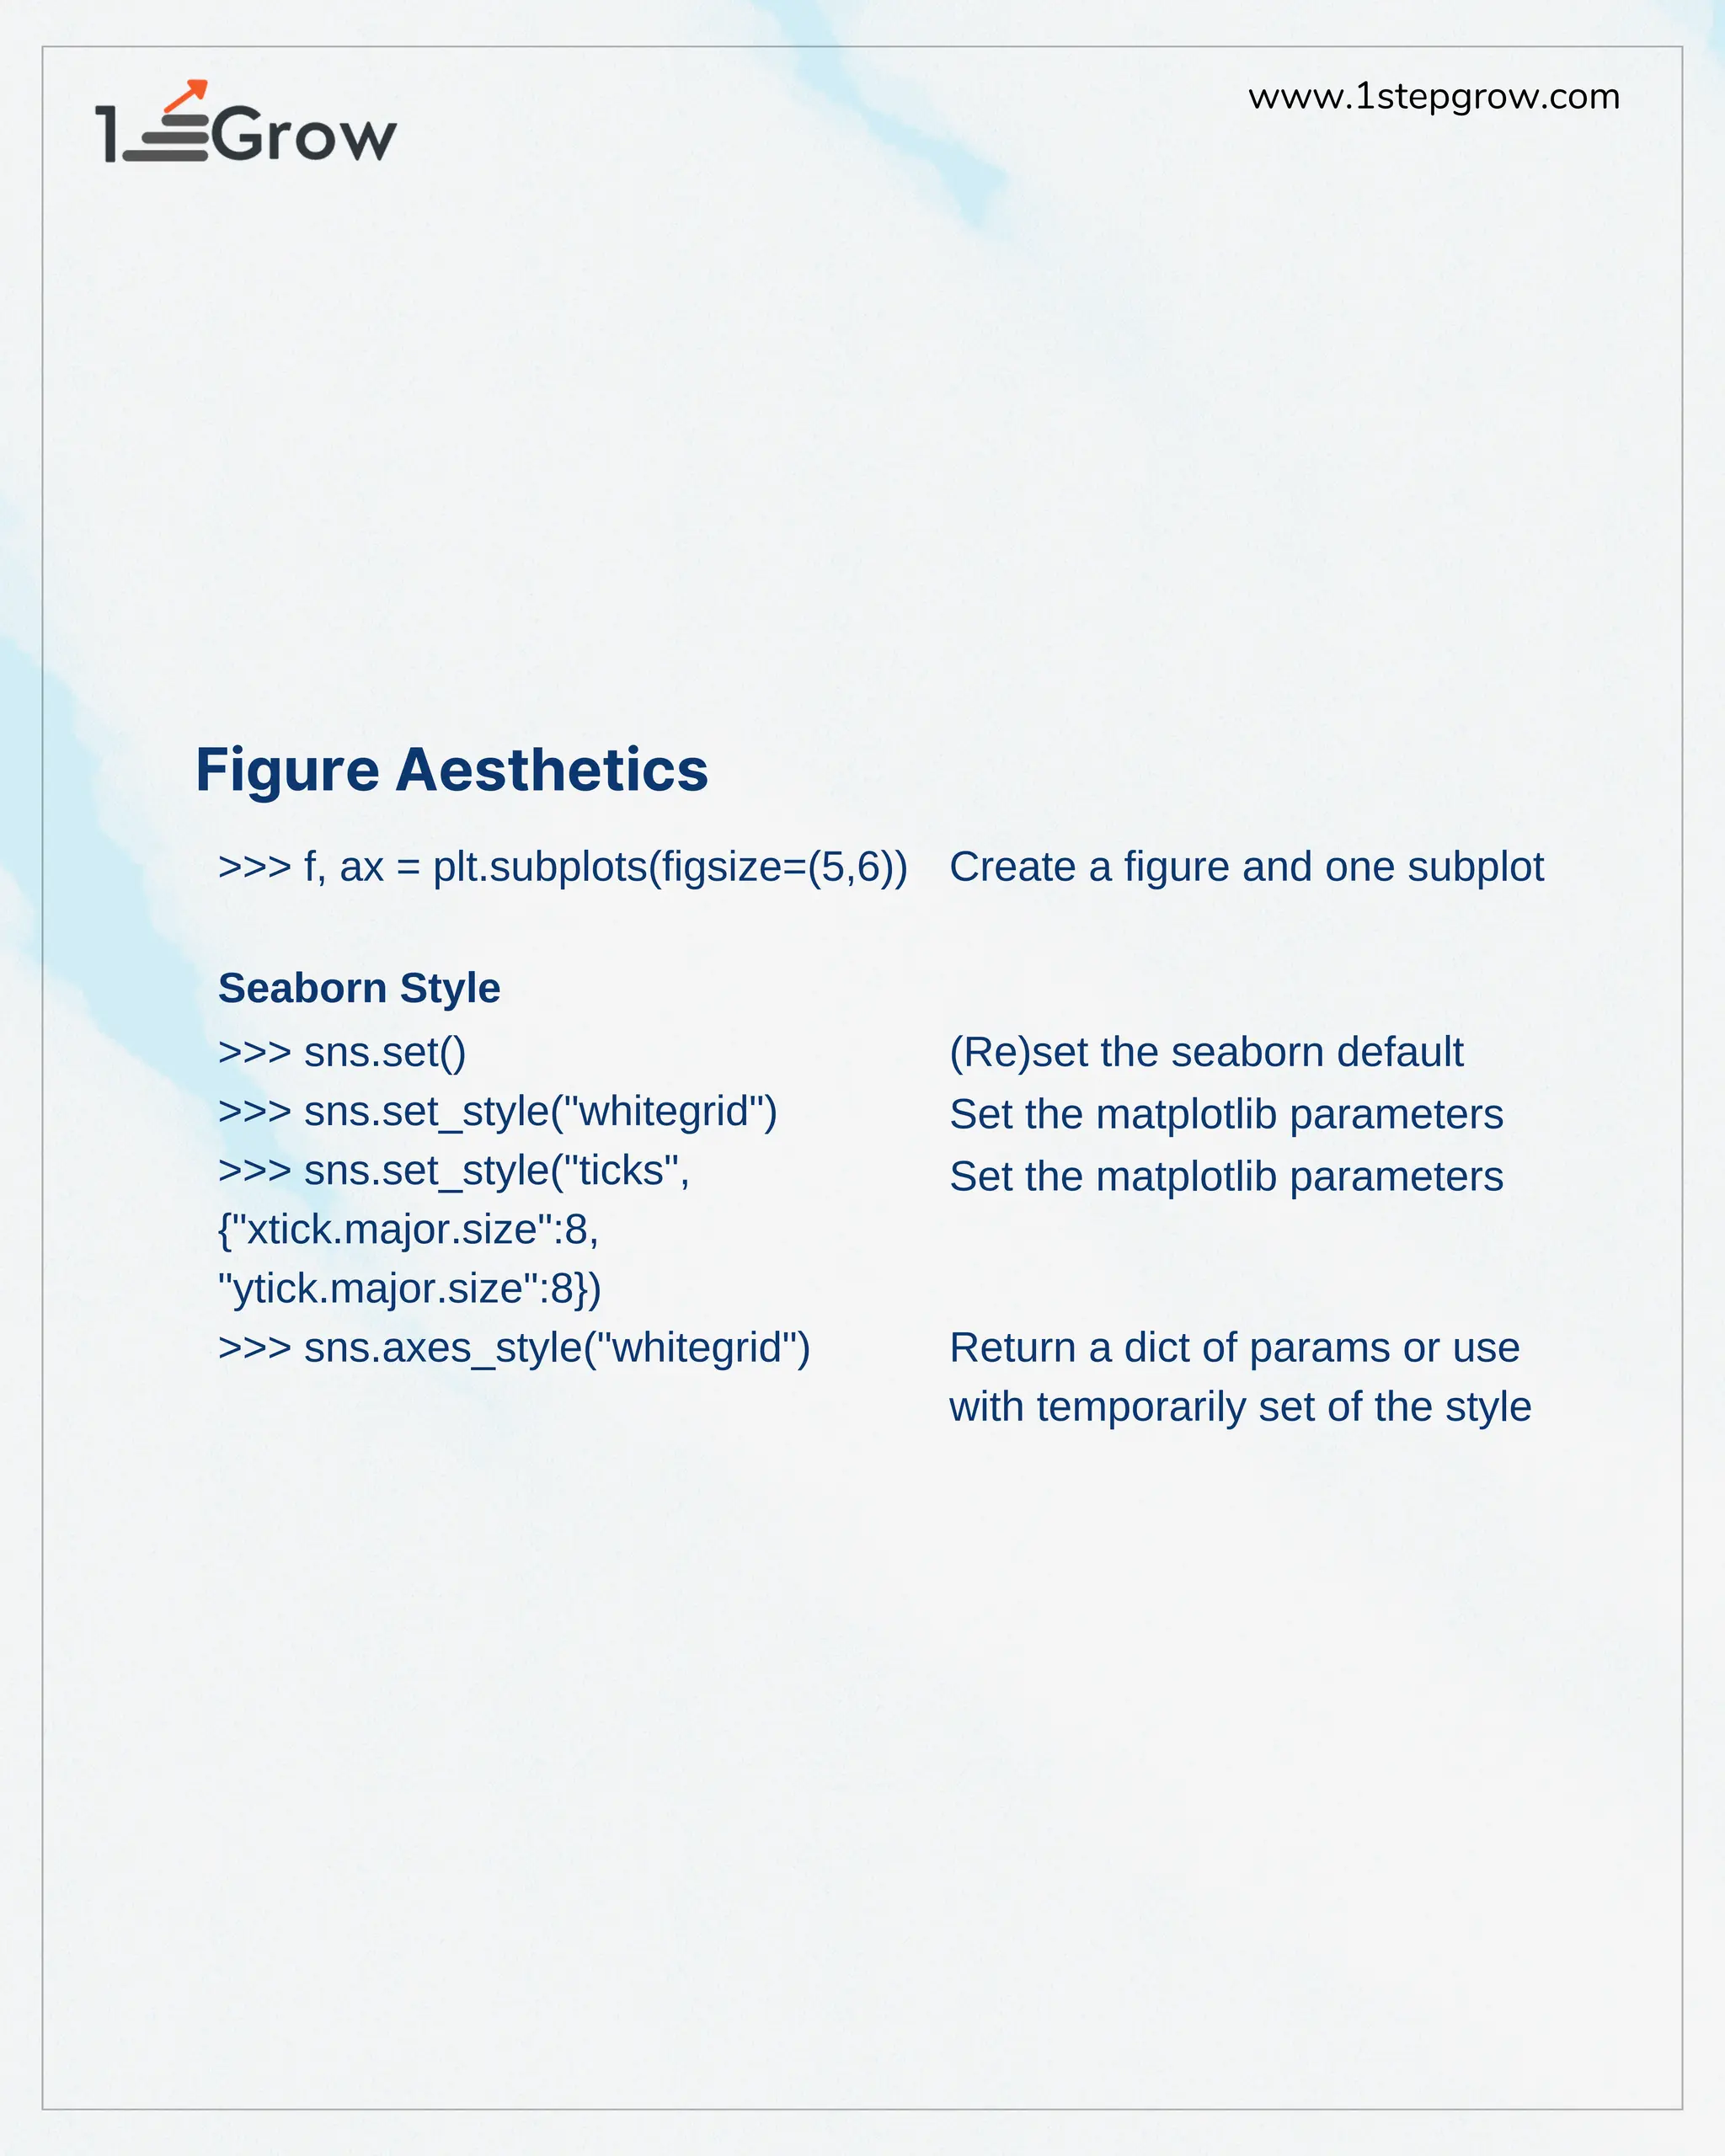
The document provides a cheat sheet for using Seaborn in Python for data science, detailing how to create and customize plots using the library. It includes examples of setting styles, contexts, and color palettes, as well as working with built-in datasets like Titanic and Iris. Additionally, it promotes 1stepgrow academy for career development in data science.


![python libray for data analytics seaborn[1].pptx](https://cdn.slidesharecdn.com/ss_thumbnails/pythonseaborn1-241222125910-e118d8f2-thumbnail.jpg?width=600ounds&width=560&fit=bounds)


