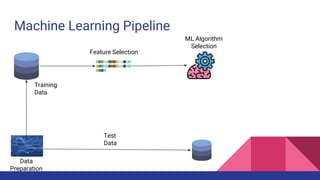
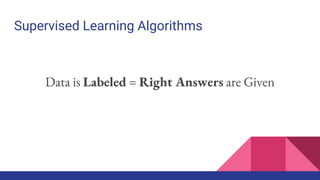
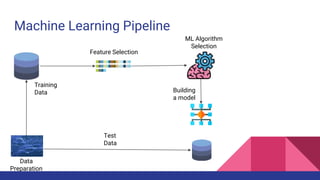
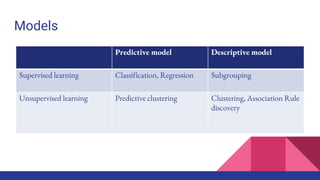
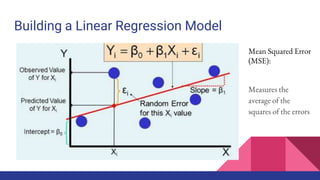
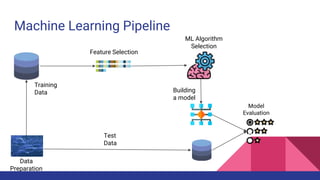
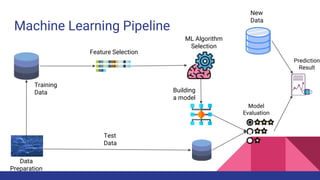
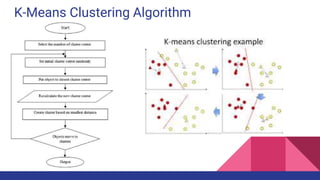
The document provides an overview of machine learning concepts including definitions, algorithms, and the machine learning pipeline. It discusses supervised and unsupervised learning algorithms like classification, regression, and clustering. It also describes steps in the machine learning pipeline such as data preparation, algorithm selection, model building, evaluation, and prediction. Examples of applications like spam filtering and recommendations are provided. The agenda outlines an introduction to machine learning algorithms and their implementation for different use cases.

![Source:
[xkcd_1838]](https://image.slidesharecdn.com/tophpcml20191-190505101332/85/Intro-to-Machine-Learning-for-non-Data-Scientists-4-320.jpg)
![Machine Learning Definition
Arthur Samuel (1959):
“Field of study that gives computers the ability to learn without being explicitly
programmed.” [ML_Awad]
Source: [fortune]](https://image.slidesharecdn.com/tophpcml20191-190505101332/85/Intro-to-Machine-Learning-for-non-Data-Scientists-5-320.jpg)
![Machine Learning Definition
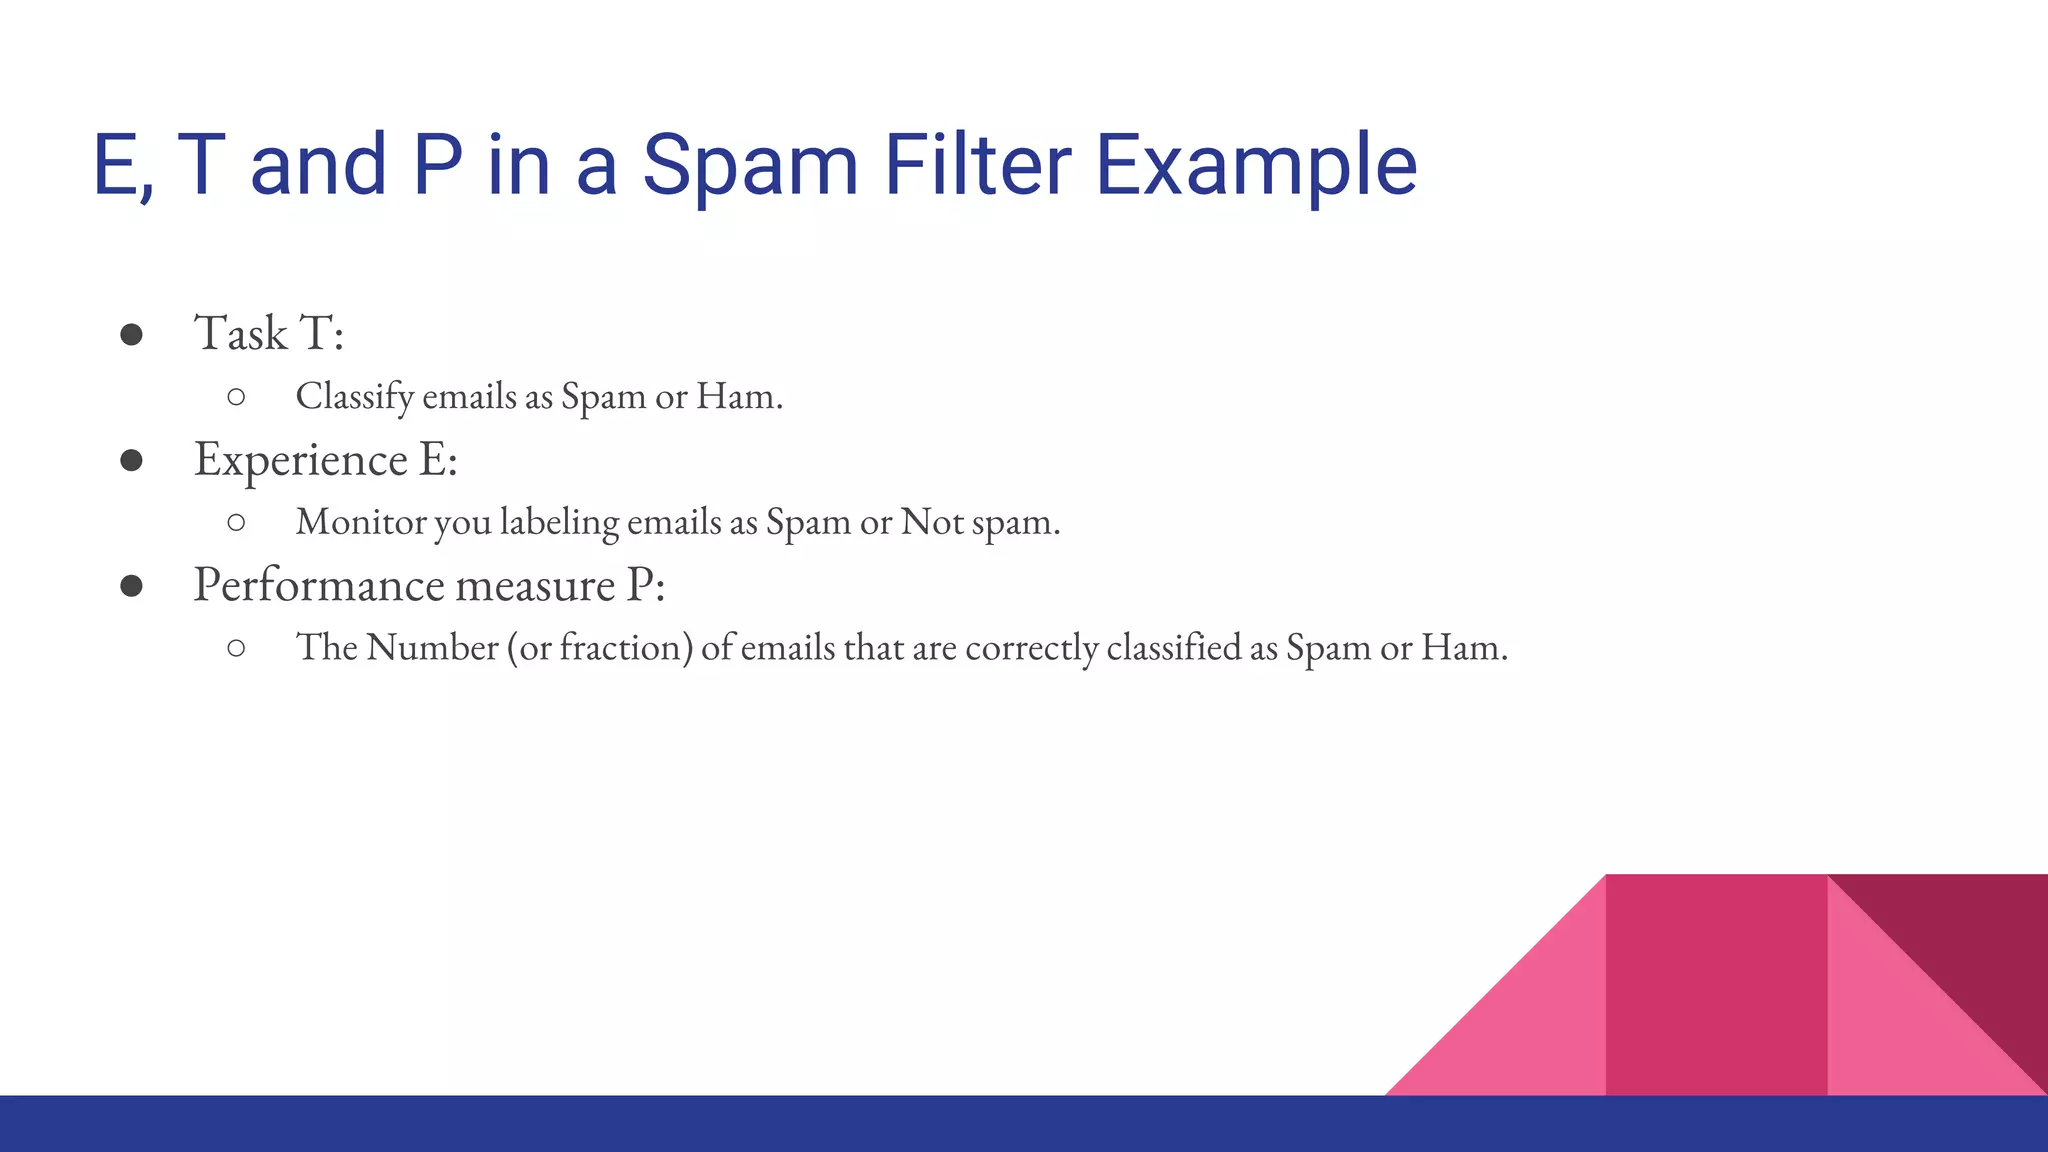
Tom Mitchell (1998):
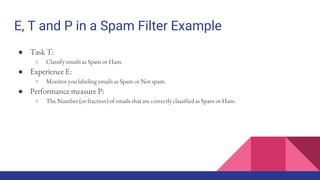
“A computer program is said to learn from experience E with respect to some class of tasks
T and performance measure P if its performance at tasks in T, as measured by P, improves
with experience E.” [ML_Mitchell]](https://image.slidesharecdn.com/tophpcml20191-190505101332/85/Intro-to-Machine-Learning-for-non-Data-Scientists-7-320.jpg)
![Machine Learning Definition
Peter Flach (2012):
“Machine learning is the systematic study of algorithms and systems that improve their
knowledge or performance with experience.” [ML_Flach]](https://image.slidesharecdn.com/tophpcml20191-190505101332/85/Intro-to-Machine-Learning-for-non-Data-Scientists-9-320.jpg)
![Source:
[towardsdatascience]](https://image.slidesharecdn.com/tophpcml20191-190505101332/85/Intro-to-Machine-Learning-for-non-Data-Scientists-10-320.jpg)
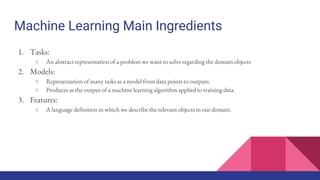
![Source: [ML_Flach]
Machine Learning Main Ingredients](https://image.slidesharecdn.com/tophpcml20191-190505101332/85/Intro-to-Machine-Learning-for-non-Data-Scientists-12-320.jpg)

![Source: [Medium]](https://image.slidesharecdn.com/tophpcml20191-190505101332/85/Intro-to-Machine-Learning-for-non-Data-Scientists-14-320.jpg)

![Clustering in Biology
Source: [researchgate]](https://image.slidesharecdn.com/tophpcml20191-190505101332/85/Intro-to-Machine-Learning-for-non-Data-Scientists-25-320.jpg)
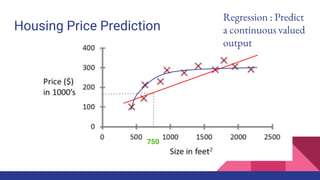
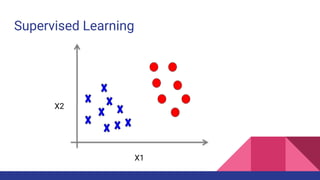
![Example of Supervised learning
Source:[radimrehurek]](https://image.slidesharecdn.com/tophpcml20191-190505101332/85/Intro-to-Machine-Learning-for-non-Data-Scientists-28-320.jpg)

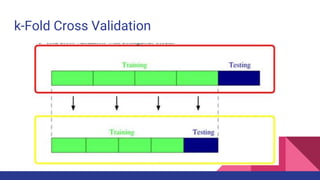
![k=4 Cross Validation
Source: [wiki]
Mean Squared
Prediction Error:
computed on q
data points that
were not used in
estimating the
model](https://image.slidesharecdn.com/tophpcml20191-190505101332/85/Intro-to-Machine-Learning-for-non-Data-Scientists-38-320.jpg)
![Get your hands dirty
Source: [karlstratos]](https://image.slidesharecdn.com/tophpcml20191-190505101332/85/Intro-to-Machine-Learning-for-non-Data-Scientists-40-320.jpg)


![Pandas DataFrame Data Types
Pandas type Python native type Description
obj string The most general dtype.
Will be assigned to your
column if it contains mixed
types (numbers and
strings).
int64 int Numeric characters. 64 refers to
the memory allocated to hold
this character.
float64 float Numeric characters with
decimals. If a column contains
numbers and NaNs(see below),
pandas will default to float64, in
case your missing value has a
decimal.
datetime64, timedelta[ns] N/A (but see thedatetimemodule
in Python’s standard library)
Values meant to hold time data.
Look into these for time series
experiments.](https://image.slidesharecdn.com/tophpcml20191-190505101332/85/Intro-to-Machine-Learning-for-non-Data-Scientists-45-320.jpg)
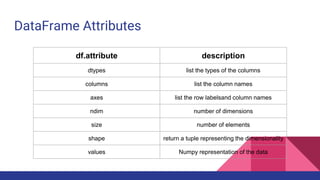
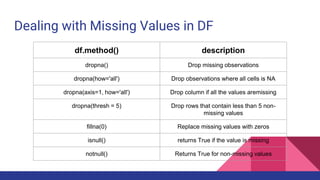
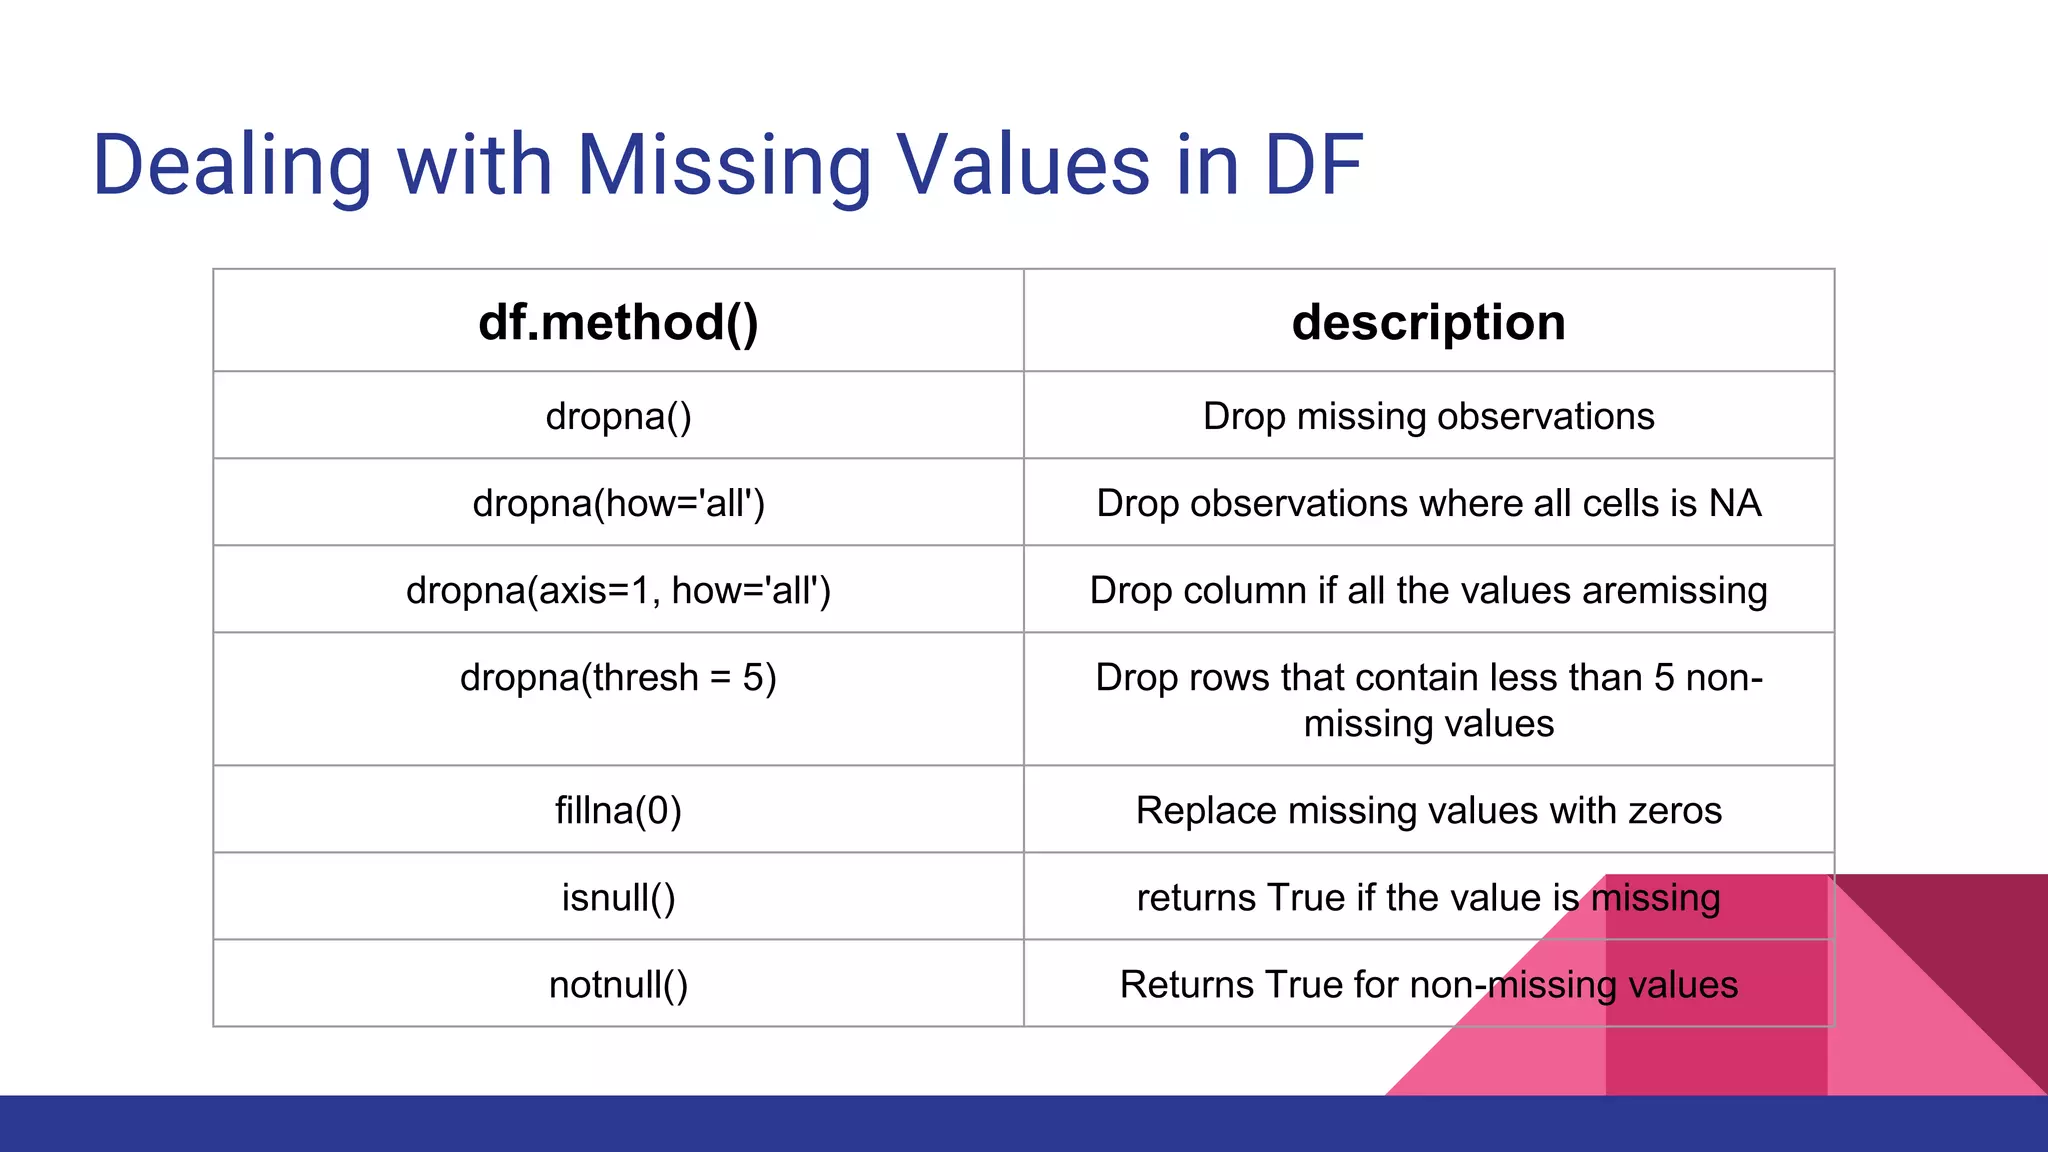
![DataFrame Methods
df.method() description
head( [n] ), tail( [n] ) first/lastn rows
describe() generate descriptive statistics (for numeric
columns only)
max(), min() return max/min values for all numeric
columns
mean(), median() return mean/median values for all numeric
columns
std() standard deviation
sample([n]) returns a random sample of the data frame
dropna() drop all the records with missing values](https://image.slidesharecdn.com/tophpcml20191-190505101332/85/Intro-to-Machine-Learning-for-non-Data-Scientists-48-320.jpg)

![Source: [Print_Lego]](https://image.slidesharecdn.com/tophpcml20191-190505101332/85/Intro-to-Machine-Learning-for-non-Data-Scientists-53-320.jpg)


![References
[ML_Awad] Awad M., Khanna R. (2015) Machine Learning. In: Efficient Learning Machines. Apress, Berkeley, CA
[xkcd_1838] https://xkcd.com/1838/
[fortune] http://fortune.com/2018/06/25/ai-business-breakthrough/
[ML_Flach] Flach, P. (2012). Machine Learning: The art and science of algorithms that make sense of data. Cambridge University Press.
[ML_Mitchell] Mitchell, T. M. (1997). Machine Learning. New York: McGraw-Hill. ISBN: 978-0-07-042807-2
[Medium_Sharma] https://medium.com/datadriveninvestor/how-to-built-a-recommender-system-rs-616c988d64b2
[karlstratos] http://karlstratos.com/drawings/drawings.html
[Print_Lego] https://www.pinterest.com/pin/422071796300372061/
[Medium] https://medium.com/@mehulved1503/feature-selection-and-feature-extraction-in-machine-learning-an-overview-
57891c595e96
[researchgate] https://www.researchgate.net/figure/Hierarchical-clustering-of-the-181-genes-corresponding-to-zinc-biology-related-
functional_fig6_26688269](https://image.slidesharecdn.com/tophpcml20191-190505101332/85/Intro-to-Machine-Learning-for-non-Data-Scientists-65-320.jpg)
![References (2)
[redimrehurek] https://radimrehurek.com/data_science_python/
[wiki] https://en.wikipedia.org/wiki/Cross-validation_(statistics)](https://image.slidesharecdn.com/tophpcml20191-190505101332/85/Intro-to-Machine-Learning-for-non-Data-Scientists-66-320.jpg)


![Source:
[xkcd_1838]](https://image.slidesharecdn.com/tophpcml20191-190505101332/75/Intro-to-Machine-Learning-for-non-Data-Scientists-4-2048.jpg)
![Machine Learning Definition
Arthur Samuel (1959):
“Field of study that gives computers the ability to learn without being explicitly
programmed.” [ML_Awad]
Source: [fortune]](https://image.slidesharecdn.com/tophpcml20191-190505101332/75/Intro-to-Machine-Learning-for-non-Data-Scientists-5-2048.jpg)

![Machine Learning Definition
Tom Mitchell (1998):
“A computer program is said to learn from experience E with respect to some class of tasks
T and performance measure P if its performance at tasks in T, as measured by P, improves
with experience E.” [ML_Mitchell]](https://image.slidesharecdn.com/tophpcml20191-190505101332/75/Intro-to-Machine-Learning-for-non-Data-Scientists-7-2048.jpg)
![Machine Learning Definition
Peter Flach (2012):
“Machine learning is the systematic study of algorithms and systems that improve their
knowledge or performance with experience.” [ML_Flach]](https://image.slidesharecdn.com/tophpcml20191-190505101332/75/Intro-to-Machine-Learning-for-non-Data-Scientists-9-2048.jpg)
![Source:
[towardsdatascience]](https://image.slidesharecdn.com/tophpcml20191-190505101332/75/Intro-to-Machine-Learning-for-non-Data-Scientists-10-2048.jpg)

![Source: [ML_Flach]
Machine Learning Main Ingredients](https://image.slidesharecdn.com/tophpcml20191-190505101332/75/Intro-to-Machine-Learning-for-non-Data-Scientists-12-2048.jpg)
![Source: [Medium]](https://image.slidesharecdn.com/tophpcml20191-190505101332/75/Intro-to-Machine-Learning-for-non-Data-Scientists-14-2048.jpg)

![Clustering in Biology
Source: [researchgate]](https://image.slidesharecdn.com/tophpcml20191-190505101332/75/Intro-to-Machine-Learning-for-non-Data-Scientists-25-2048.jpg)

![Example of Supervised learning
Source:[radimrehurek]](https://image.slidesharecdn.com/tophpcml20191-190505101332/75/Intro-to-Machine-Learning-for-non-Data-Scientists-28-2048.jpg)


![k=4 Cross Validation
Source: [wiki]
Mean Squared
Prediction Error:
computed on q
data points that
were not used in
estimating the
model](https://image.slidesharecdn.com/tophpcml20191-190505101332/75/Intro-to-Machine-Learning-for-non-Data-Scientists-38-2048.jpg)

![Get your hands dirty
Source: [karlstratos]](https://image.slidesharecdn.com/tophpcml20191-190505101332/75/Intro-to-Machine-Learning-for-non-Data-Scientists-40-2048.jpg)

![Pandas DataFrame Data Types
Pandas type Python native type Description
obj string The most general dtype.
Will be assigned to your
column if it contains mixed
types (numbers and
strings).
int64 int Numeric characters. 64 refers to
the memory allocated to hold
this character.
float64 float Numeric characters with
decimals. If a column contains
numbers and NaNs(see below),
pandas will default to float64, in
case your missing value has a
decimal.
datetime64, timedelta[ns] N/A (but see thedatetimemodule
in Python’s standard library)
Values meant to hold time data.
Look into these for time series
experiments.](https://image.slidesharecdn.com/tophpcml20191-190505101332/75/Intro-to-Machine-Learning-for-non-Data-Scientists-45-2048.jpg)

![DataFrame Methods
df.method() description
head( [n] ), tail( [n] ) first/lastn rows
describe() generate descriptive statistics (for numeric
columns only)
max(), min() return max/min values for all numeric
columns
mean(), median() return mean/median values for all numeric
columns
std() standard deviation
sample([n]) returns a random sample of the data frame
dropna() drop all the records with missing values](https://image.slidesharecdn.com/tophpcml20191-190505101332/75/Intro-to-Machine-Learning-for-non-Data-Scientists-48-2048.jpg)
![Source: [Print_Lego]](https://image.slidesharecdn.com/tophpcml20191-190505101332/75/Intro-to-Machine-Learning-for-non-Data-Scientists-53-2048.jpg)

![References
[ML_Awad] Awad M., Khanna R. (2015) Machine Learning. In: Efficient Learning Machines. Apress, Berkeley, CA
[xkcd_1838] https://xkcd.com/1838/
[fortune] http://fortune.com/2018/06/25/ai-business-breakthrough/
[ML_Flach] Flach, P. (2012). Machine Learning: The art and science of algorithms that make sense of data. Cambridge University Press.
[ML_Mitchell] Mitchell, T. M. (1997). Machine Learning. New York: McGraw-Hill. ISBN: 978-0-07-042807-2
[Medium_Sharma] https://medium.com/datadriveninvestor/how-to-built-a-recommender-system-rs-616c988d64b2
[karlstratos] http://karlstratos.com/drawings/drawings.html
[Print_Lego] https://www.pinterest.com/pin/422071796300372061/
[Medium] https://medium.com/@mehulved1503/feature-selection-and-feature-extraction-in-machine-learning-an-overview-
57891c595e96
[researchgate] https://www.researchgate.net/figure/Hierarchical-clustering-of-the-181-genes-corresponding-to-zinc-biology-related-
functional_fig6_26688269](https://image.slidesharecdn.com/tophpcml20191-190505101332/75/Intro-to-Machine-Learning-for-non-Data-Scientists-65-2048.jpg)
![References (2)
[redimrehurek] https://radimrehurek.com/data_science_python/
[wiki] https://en.wikipedia.org/wiki/Cross-validation_(statistics)](https://image.slidesharecdn.com/tophpcml20191-190505101332/75/Intro-to-Machine-Learning-for-non-Data-Scientists-66-2048.jpg)


![Agentic Systems and Compliance - A brief intro [1.2]](https://cdn.slidesharecdn.com/ss_thumbnails/agenticsystemsandcompliace-1-251018025303-958a42ec-thumbnail.jpg?width=600ounds&width=560&fit=bounds)


![RTP_AR_Basic_Learners' Workbook_KS2 [FOR REPRODUCTION] (1).pdf](https://cdn.slidesharecdn.com/ss_thumbnails/rtparbasiclearnersworkbookks2forreproduction1-251016024943-e51a16ac-thumbnail.jpg?width=600ounds&width=560&fit=bounds)


